
 ?Mathematical formulae have been encoded as MathML and are displayed in this HTML version using MathJax in order to improve their display. Uncheck the box to turn MathJax off. This feature requires Javascript. Click on a formula to zoom.
ABSTRACT
Predictive factors for forwarder rut formation were studied on fine-grained mineral soils. The study was carried out in southern Finland in mid-May, when the soil water contents were high after snowmelt. A total of 7 study tracks of 20 m were cut with a harvester. After removing the logging residues, a loaded forwarder made 3–4 passes on each track. The forwarder rut depth was related to the total overdriven mass driven over the measurement line, volumetric water content, cone penetration resistance and the harvester rut depth. A total of five mixed-effects models are presented to predict the rut depth. The first model includes the overdriven cumulative mass, volumetric water content of the soil and the cone penetration resistance. As a penetrometer is more of a research tool, the second model includes only the overdriven cumulative mass and water content, factors that can be used in practical planning operations. The remaining three models all include the rut depth after the harvester pass and the overdriven cumulative mass and also include volumetric water content and cone penetration resistance. The model including the rut depth after a harvester pass and the overdriven cumulative mass is a good predictor of the rut depth and supports earlier findings on the connection between harvester and forwarder rut formations.
Introduction
Year-round timber harvesting is needed to guarantee raw material maintenance in the forest industry and the effective use of capital-intensive harvesting machinery. In a seasonal climate, characterised by strong variability in environmental conditions, the timing and planning of harvesting operations can play a crucial role in minimising soil damage which has several environmental and economic consequences. The severity of soil damage depends both on the applied machinery and the load, traffic intensity and site characteristics such as the soil texture, organic matter content, moisture and topography (Nugent et al. Citation2003; Bygden et al. Citation2004; Cambi et al. Citation2015). Tree roots reinforce the forest floor and significantly increase the bearing capacity of the soil. The contribution of the root layer on the soil bearing capacity depends on the number of the roots, as well as their diameter, the orientation of the roots and their mechanical properties (Rubio Citation2015).
Other factors include the machine equipment used (tyres, tyre pressure, tracks, chains) and the harvesting method (Jansson and Johansson Citation1998; Susnjar et al. Citation2006; Sakai et al. Citation2008; Gerasimov and Katarov Citation2010). The residue mat from logging provides good cover to the soil and reduces rutting (Wronski et al. Citation1990; McDonald and Seixas Citation1997; Han et al. Citation2006; Kärhä et al. Citation2010; Sirén, Ala-Ilomäki, et al. Citation2013; Labelle et al. Citation2015). For example, in Norway spruce thinnings a residue mat of 15–20 kg/m2 is achievable (Sirén, Ala-Ilomäki, et al. Citation2013). Poltorak et al. (Citation2018) found, that mixed-wood brush mats of 15 and 20 kg/m2 provide significant soil protection.
For instance, in Finland, the accepted levels of rutting and soil damage are set by the forest legislation (Forest Act Citation1996; Government decree Citation2013) and forestry recommendations (Hyvän metsänhoidon suositukset Citation2006). According to the law, the portion of ruts deeper than 10 cm should not exceed 20% of the total length of strip roads. If the share of ruts deeper than 10 cm is less than 5% of the overall strip road length, the results are acceptable.
In Finland, the forest sites have been traditionally classified into three main classes. On winter sites harvesting is possible only in the wintertime, while frost heave sites are harvestable in all seasons and summer sites are harvestable in the summertime, with some dependence on weather conditions (Korjuujälki harvennushakkuussa Citation2003). Peatlands play an important role in Finnish wood production, and a lot of effort has been made in developing peatland trafficability classifications. The newest classification (Högnäs et al. Citation2011) combines stand properties and machine characteristics. If the machines have the proper equipment (wide tyres, special tracks), and harvesting planning reacts accordingly to the weather conditions, a remarkable share of peatlands can be harvested during the non-frost period.
Soil wetness indices such as the topographic wetness index (TWI, Beven and Kirkby Citation1979) and the cartographic depth-to-water index (DTW, Murphy et al. Citation2007) have been shown to reflect forest soil trafficability conditions and soil rutting (Salmi et al. Citation2013; Ågren et al. Citation2014; Jones and Arp, Citation2017; Niemi et al. Citation2017). In Sweden, the results of Bergkvist et al. (Citation2014) showed that more than 60% of soil damage was on areas characterised as “wet” based on the DTW maps. Mohtashami et al. (Citation2017) conducted a survey on the influence of the soil type, DTW maps, slash reinforcement and the traffic intensity on rut formation. The soil type and traffic intensity were found to be significant factors in rut formation, while the DTW and slash reinforcement were not. This suggests that DTW maps should be combined with other information, such as the soil type, to contribute to the development of support tools for decision-making.
There are tutoring systems for machine operators such as BESTWAY in Sweden (Friberg Citation2014; Friberg and Bergkvist Citation2016; Willén et al. Citation2017) and LoggingMap in Finland (Väätäinen et al. Citation2013). These tutoring systems can help machine operators to position the heavily trafficked primary strip roads, to avoid extreme slopes and to find places needing slash reinforcement. New site harvestability classifications utilising multi-source data have been developed (Peuhkurinen Citation2017) and these show promising results (Luoma Citation2017). In the future, classifications are likely to react to weather changes (Vega-Nieva et al. Citation2009; Jones and Arp Citation2017; Salmivaara et al. Citation2017). There are promising results on harvester-measured rut-depths with LiDAR (Salmivaara et al. Citation2018) and CAN-bus information (Ala-Ilomäki et al. Citation2012). With this data damage due to forwarder operations can be avoided and trafficability predictions can be validated.
To use open geospatial data to its full advantage in the future, it will be a prerequisite to understand the factors affecting rut formation. One of the most important factors is the soil bearing strength indicating the capacity of the soil to resist external forces (Susnjar et al. Citation2006) and this is mainly influenced by the soil moisture and soil particle size distribution (e.g. Susnjar et al. Citation2006; Lüscher et al. Citation2010; Marx et al. Citation2013). Fine-grained mineral soils and peatlands are sensitive to rut formation during periods of high moisture content (e.g. Saarilahti Citation2002; Nugent et al. Citation2003; Zeleke et al. Citation2007; Marx et al. Citation2013; Uusitalo and Ala-Ilomäki Citation2013), and the correct timing of forestry operations is necessary to avoid soil damage (Freitag Citation1987). The most fertile sites are typically on moist and fine-grained soils where the bearing capacity is low and seasonal variations in trafficability are strong (Sutinen et al. Citation2002; Hyvönen et al. Citation2003; Eliasson and Wästerlund Citation2007). Norway spruce has horizontal superficial roots, and stands are susceptible to root damage followed by growth loss and decay (Sirén, Ala-Ilomäki, et al. Citation2013). Earlier studies have shown that rut formation after a harvester pass is a good predictor of the rut formation in forwarding, both on mineral soils (Sirén, Ala-Ilomäki, et al. Citation2013) as well as on peatland (Sirén, Hytönen, et al. Citation2013).
This work explores factors predicting forwarder rut formation on fine-grained mineral soils on flat ground. First, we address the influence of soil properties, especially the water content, on rut formation. Second, we consider the possible relation between harvester and forwarder rut formation. Finally, we present and compare models predicting forwarder rut formation and discuss their feasibility in harvesting planning and implementation.
Materials and methods
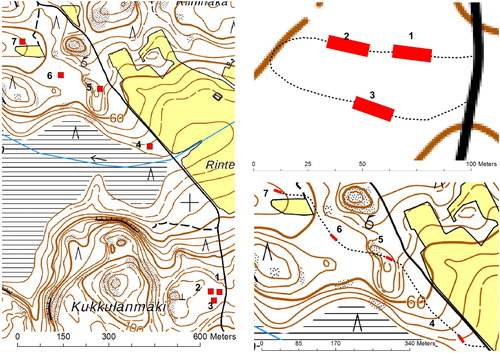
Total of 7 test tracks of 20 m was established at Vihti in southern Finland, 60°24.48′N, 24°23.23′E in WGS84 (). The maximum distance between test tracks in the study area was less than 1.5 km, and all the tracks were on even ground. Test drives were done in mid-May of 2016. The rainfall in April at Vihti had been 74.6 mm, near twofold compared to the 30-year average and the average temperature was 4.1°C, which was slightly higher than the 30-year average. The beginning of May was dry and warm, but on the weekend before the test drives 13 mm of rainfall was accumulated (Ilmatieteen laitoksen sääasemien arkisto Citationn.d.).
Figure 1. Map of experimental area. Locations of study tracks are marked with red lines. Contains data from the National Land Survey of Finland Topographic map series (raster) 10/2017.
Just before harvesting, 20 transversal measurement lines were marked on each track, and measurement points for rut formation were marked on these lines. On each measurement line, the soil penetration resistance (Cone index, CI) was determined using the Eijkelkamp Penetrologger 0615SA penetrometer consisting of a 11.28 mm diameter (1 cm2) and a 60-degree cone. Measurements were taken without moving the organic layer. The stoniness of the soil was estimated by steel-rod sounding (Tamminen Citation1991). A 60 cm rod was pushed into the soil and the average rod penetration depth (ARP, cm) was recorded.
The soil volumetric water content (VWC, %) was measured point-wise with an electrical capacitance probe (Percometer by Adek Ltd., Tallin, Estonia). The instrument is able to cover the whole VWC gradient, in addition to saturated minerogenic and organic/peat materials. To minimise the impact of soil heterogeneity, two readings (15–20 cm apart) were taken for each reference point (micro-site, Närhi et al. Citation2011) on the measurement line. To find a representative VWC for the measurement line, the mean of these two measurements and the 4 nearest measurements were used to convert the soil dielectric values to VWC with the model presented by Sutinen (Citation1992). The conversion model has been found valid in a range of soil types in Finland but yields ca. 5% lower VWC compared to the commonly used conversion model by Topp et al. (Citation1980). Sutinen (Citation1992) used natural soil materials in his study, while Topp et al. (Citation1980) used glass beads. The measured soil volume was approximated to 500 cm3. The measurement depth of the probe was approximately 10 cm and the measurements included both the organic and mineral layers.
On each track, two mineral soil samples (5 m from the starting point and 5 m before the end point) were taken with a core sampler which was 500 mm in height and 46 mm in diameter. The samples were pooled and analysed in the laboratory for the organic matter content, dry bulk density and grain size distribution. The thickness of the organic layer at the mineral soil sample points was also recorded.
All the test tracks were located on first or second thinning stands. Before harvesting, the tree species distributions and timber volumes of the study tracks were measured in circular sample plots of 100 or 300 m2.
Machines used and the monitoring of rut formation
Test tracks were harvested with Ponsse Scorpion King harvester, which was driven by an experienced machine operator. The harvester had Nokian Forest King F2 710/45-26.5 tyres with one pair of OFA Matti chains on the front and rear bogies. The machine had no bogie tracks, which are typically used on the front bogie of harvesters in soils with poor bearing capacity. Normal recommended tyre pressures were used. The total mass of the harvester was 22,500 kg. The calculated weight distribution for the harvester was 11,900 kg in the front/11,400 kg at the rear and the nominal ground pressure (Malmberg Citation1981) was 61.4/58.8 kPa.
The harvester was equipped with a Ponsse H7 harvester head. The harvester operator was told to process the harvested trees mainly outside the strip roads. The reason for this was to minimise the amount of logging residues on the strip roads to avoid the influence of the residues on rut formation. Possible cutting residues were removed from the tracks before forwarding.
The forest haulage operations were carried out with an 8-wheeled Ponsse Elk forwarder driven by an experienced operator. Forwarder was equipped with Nokia Forest King F2 710/45-26.5 tyres, universal Olofsfors ECO tracks on the rear bogie and Superhokki 160 TS chains on the two rear wheels of the front bogie. Normal recommended tyre pressures were used. The masses of the forwarder, its tracks and chains were 17,600, 1780 and 400 kg, respectively. All the forward passes were driven loaded with pulpwood which made the total mass of the forwarder to be 30,000 kg. The calculated weight distribution for the loaded forwarder was 11,560 kg in the front/19,640 kg at rear and the nominal ground pressure was 59.6/45.0 kPa.
After each machine passes, the rut depths on the measurement line were measured to the nearest cm by using a wooden measurement frame and measuring stick, and these depths were averaged to represent the rut depth on the measurement line. The measurement frame was wide enough to eliminate the effect of possible soil bulges near the ruts. To ensure consecutive measurements were conducted at same locations, the measurement points were marked on the ground with spray paint. The rut depth can also be measured with construction laser (Toivio et al. Citation2017) and photogrammetric estimation (Pierzchała et al. Citation2016; Marra et al. Citation2018).
Data processing and modelling
The collected data was used to construct models for predicting the rut depth. Different combinations of variables describing the soil characteristics and number of forwarder passes as well as their logarithmic transformations were tested, and highly correlated independent variables were avoided. When a logarithmic transformation was used for dependent variables (the average rut depth of the measurement line), the value 0.5 cm was assigned to 23 observations with an original value of 0 cm to include them in the modelling. Special attention was paid to testing the influences on the rut depth of the rod penetration (ARP, cm), average cone penetration resistance from 0 to 20 cm (CI, MPa), volumetric water content (VWC, %) and cumulative overdriven mass (CM, kg) driven over the measurement line. All these variables were measured at the measurement line level. We also studied the influence of the share of clay in the soil (SC, %) and the median of the grain size (GS, µm), values based on two soil samples per track, on the rut depth. We also tested whether the rut depth after a harvester pass (Hr, cm) could be used as an indicator of the rut depth after following forwarder passes. In this case, only observations after the first pass (harvester) were used and the measured Hr value was given for each observation.
The statistical significance of the variables including both fixed and random effects was tested by using the Linear Mixed Models procedure of the IBM SPSS v.22 software. The REML estimation method was used. The models were compared by using goodness of fit statistics (Akaike Information Criterion, AIC) and residuals for the models. With i denoting the measurement (repeated after each pass) and m the (∼20) measurement lines within track t (n = 7), the basic form of the mixed model predicting the logarithm of rut depth y (the average of the measurements in one measurement line, cm) was:(1)
(1) where, y = The dependent variable for the rut depth (average of the measurements in measurement line line), b0 = Constant, b = the (Row) vector of the (fixed) regression coefficients, X = the (Column) vector of the explanatory variables, utm = The random measurement line effect, nested within the random effect of track t, etmi = The measurement effect (after each pass).
In order to account for the correlation between repeated measurements of the same track, a first order auto-regressive AR(1) covariance structure was assumed for the residuals etmi meaning that successive passes were more correlated with correlation coefficient , and the correlation decreased toward zero with increasing difference in the number of passes. The within-track correlation between the measurement lines was also modelled with an AR(1) structure. This meant that the adjacent measurement lines were more correlated, with the coefficient
, than pairs of plots further apart on the same track. Parameters
and
are the variances of random effects utm and etmi, respectively.
Results
Soil and stand conditions
The average thickness of the organic layer on the tracks was 6.2 cm (range of variability 4.2–8.3 cm) and the organic content mass in the soil samples was 6.2% (4.2–8.3%). The soil properties of the study tracks are presented in and the particle size distribution is shown in . The track-average CI profiles are presented in .
Figure 2. Particle size distribution for the study tracks.
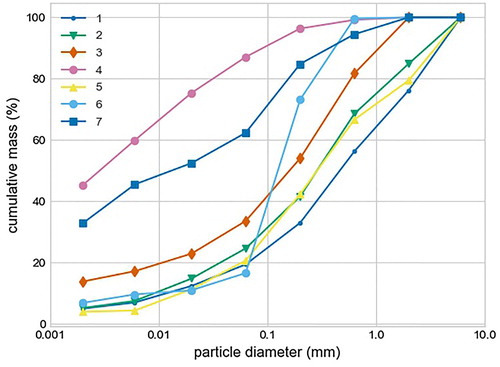
Figure 3. Average profiles of cone penetration resistance (CI) on the study tracks. Averages between 0 and 20 cm were used in the modelling.
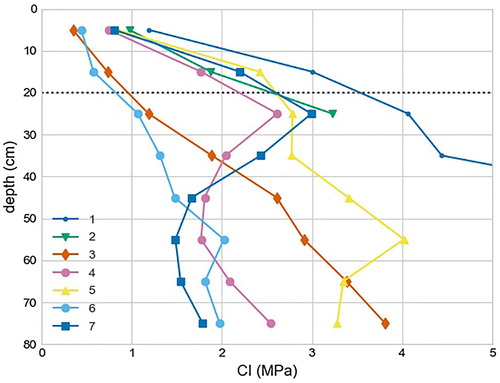
Table 1. Soil characteristics at the study tracks.
The tracks studied were located in the first and second stands. Track 4 was on the second thinning pine stand with 700 trees and the volume of the trees was 159 m3/ha. All the other tracks were on the first thinning stands, and the number of trees varied between 1300 and 2100 trees/ha and the volumes varied between 66 and 232 m3/ha.
Rut formation
The average rut depths after the machine passes are presented in .
Figure 4. Average rut depths in the study tracks (1–7) after machine passes. Pass 1 = harvester (mass 22,500 kg), 2 = forwarder passes with load (mass 30,000 kg).
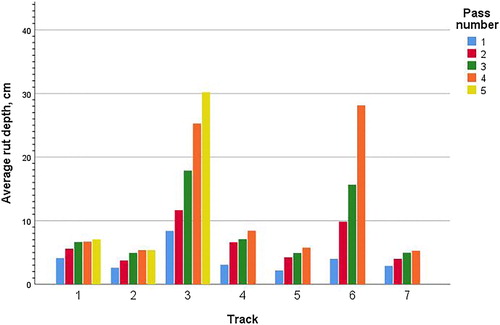
The average rut depth after harvester pass was 3.9 cm (SD 3.4 cm). After harvester pass and two forwarder passes the average rut depth was 8.9 cm (SD 6.7 cm).
The Pearson correlations between the rut depth after a harvester pass, three forwarder passes, and the average site conditions are presented in .
Table 2. Pearson correlation coefficients between rut depths (after one harvester pass and three forwarder passes) and soil properties calculated as averages for the test tracks.
Rut depth models
We present a total of five models predicting the logarithm of the average rut depth (cm) in a measurement line (). Every model includes the cumulative mass (CM) driven over measurement line. The model (Equation (2)) predicting the average rut depth of the measurement line based on the overdriven mass and measurement line soil properties was:(2)
(2) The volumetric water content (VWC) and penetration resistance (CI) are the soil properties included in the first model. In the second model () the volumetric water content is the only soil property.
Table 3. Mixed-linear models predicting the logarithm of the average rut depth (ln (ytmi)) of measurements in a measurement line.
In the consecutive models, we include the rut depth after harvester pass (Hr) in the model. The full model including harvester pass is presented in Equation (3):(3)
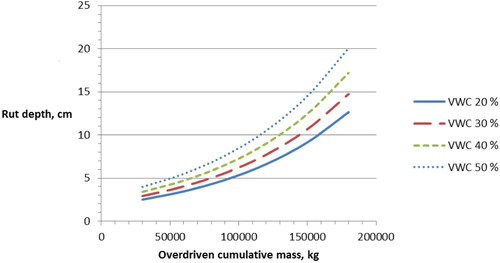
(3) In this model () we include the harvester rut depth, VWC, penetration resistance and cumulative overdriven mass. The fourth model includes all these except the penetration resistance and the fifth model includes only the cumulative overdriven mass and harvester rut depth. In , we show the predicted rut depths with different soil water contents and overdriven masses calculated with model 2 in .
Figure 5. The influence of the cumulative overdriven mass and soil volumetric water content on the rut depth.
Discussion
Experimental conditions
The field studies were carried out in test tracks located near each other. Most of the test tracks had fine-grained soils, but there were also test tracks on moraine soil and thus the mean of the median grain size (MGS) varied from 3.5–465.5 µm. The variation in bulk density (BD) was small (0.71–0.92 g/cm3). The bulk densities in Nordic studies (Wästerlund Citation1989; Westman Citation1990) have been a little higher (0.95–1.2 g/cm3) overall than in our study. On three tracks the percentage of clay was noticeable. The soil bearing conditions during the experiment were demanding due to high volumetric water contents and the fine-textured soils. An increase in the soil water content implies a reduction in the frictional forces between the soil particles and reduces the bearing capacity of the soil (McDonald and Seixas Citation1997; McNabb et al. Citation2001; Han et al. Citation2006).
The highest water contents were in small dales, and the water contents of the study tracks were possibly more related to the topographic position of the track than the soil type. Moreover, the VWC was measured with an electrical capacitance probe at a depth of 10 cm in soil that contained high amounts of organic matter while the soil samples represented a deeper soil layer. Jointly these factors are likely to explain the high water contents of two of the tracks (3 and 6) that were not on the most fine-grained soils (). Because the volumetric water content was measured on every rut measurement line and the rut formation on the measurement line could be linked to the actual measured water content, the data for the modelling was considered reliable.
Bulk densities and grain size distributions were based on two mineral soil samples taken from each 20 m track. The average BD and average MGS of these samples was used for the measurement line in the modelling. The penetration resistance (CI) was measured without moving the organic topsoil (mean depth 6.2 cm) and readings between 0 and 20 cm were used. The average penetration resistance was 1.23 MPa and varied a lot between tracks (0.51–1.89). Uusitalo et al. (Citation2018) modelled soil moisture and strength relationships for fine-grained mineral soils, and part of the study stands were located near to our test tracks. In that previous study the penetration resistance of the humus layer was at the level of 0.5–0.6 MPa and the mean of the penetration resistance in the inorganic layers for the first 10–15 cm varied between 0.7–1.9 Mpa. The penetration resistance was controlled by the volumetric water content, bulk density and clay content supporting the earlier findings (Ayers and Perumpral Citation1982; Elbanna and Witney Citation1987; Dexter et al. Citation2007). In our study, the volumetric water content, bulk density, average rod penetration depth (ARP) and medium grain size were correlated with the penetration resistance, but the clay content was not. The reason for this difference is likely to be the limited variation of soil properties in our study. Increased organic matter content reduces the penetration resistance because of soil aggregation, i.e. by further loosening the point of contact between the aggregated soil particles (Jones and Arp Citation2017). When comparing the penetration resistance values in different studies, it is important to know which layers and depths are included and what kinds of cones are used to take the measurements.
Rut formation and factors affecting them
Modern forest machinery was used in the experiment. Both the harvester and forwarder used were eight-wheeled machines. The same driving lines were used in different passes. In poor bearing conditions, operators often use slightly different driving lines. On peatlands widening the primary strip roads with heavy traffic can be a good solution (Uusitalo et al. Citation2015). The intensity of machine traffic (number of passes) is a main controlling factor of rut depth, as demonstrated by several authors (e.g. Jakobsen and Greacen Citation1985; McNabb et al. Citation2001; Nugent et al. Citation2003; Bygden et al. Citation2004; Eliasson Citation2005; Eliasson and Wästerlund Citation2007).
In order to find the actual bearing capacity of the soil, the logging residues were removed after cutting from the test tracks. This has two effects on interpretation of our results. Firstly, the notable covering effect of the logging residue mat was removed. Secondly, when logging residues are removed, the measurement of rut formation is more precise. Because the best possible machine equipping for poor bearing conditions was not used, especially in cutting (driving without bogie tracks), and because the logging residues were removed, the results show the bearing capacity of the soil and not the actual harvesting traces after normal operations.
The average rut depths after one harvester pass and three forwarder passes were positively correlated with the volumetric water content, soil bulk density and average rod penetration and were negatively correlated with the cone penetration resistance. The average harvester rut depth was positively correlated with the forwarder rut depth. A lower average rod penetration often means increased stoniness, which has been connected to reduced rut formation in earlier studies (Sirén, Ala-Ilomäki, et al. Citation2013; Niemi et al. Citation2017).
There was a high variation in the rut formation between () and also within some tracks. The average rut depth after harvester was 3.9 cm, which is quite high, and the average rut depth was higher than 10 cm after two forwarder passes over two of seven tracks. These two test tracks (3 and 6) had high average volumetric water contents resulting in deep ruts which were similar to those observed by Gerasimov and Katarov (Citation2010) on very wet silt loam soils in Russia. In their study, there was no slash reinforcement on the tracks and bogie tracks were not used on the forwarder.
If we exclude the two tracks (3 and 6) with strong rut formation and look at the remaining five tracks, 75% of the final rut formation after 3 or 4 forwarder passes was reached after the first forwarder pass. The removal of logging residues could be the reason for this because the root and residue mat usually hinders rut formation during the first passes. Toivio et al. (Citation2017) studied the effects of forwarding on physical properties and rut depths on fine-grained soils next to our experimental area. The harvesting and processing of the trees were carried out from outside the study tracks to keep them intact and residues were collected. Test drives were carried out with the same forwarder as used in our tests. The first three passes caused the greatest compaction and rutting. The first pass had the strongest impact. After the first and third pass 34–55% and over 70% of the total mean rut depth after 10 passes was formed, respectively. Further passes caused only minor rutting. Moreover, Toivio et al. (Citation2017) found a clear relationship between the volumetric water contents measured from soil samples and rut depths (correlation coefficient 0.42). In our study, the correlation was a little bit higher, possibly due to higher variation in the VWC. A major influence of the first machine passes on penetration resistance was also found by Han et al. (Citation2006). On silt loam soil, moisture had significant effect on penetration resistance. From the pre-harvest levels, the penetration resistance increased up to the second pass of a fully loaded forwarder, and there was only a small increase after that.
Rut-depth models
A total of five mixed-effects models were presented to predict the rut depth after harvester and forwarder passes. Model 1 includes the overdriven cumulative mass, volumetric water content of soil and the cone penetration resistance. As penetrometer is more like a research tool, also the average rod penetration depth reflecting the stoniness of the soil was suggested for the model along with the overdriven cumulative mass and water content. However, even though ARP was correlated with the rut depth, it was not a significant predictor (p = 0.183) in the model.
Model 2 includes only the overdriven cumulative mass and water content, factors which could be used in practical planning operations, and it reaches to very similar results as model 1.
The three other models include the rut depth after harvester pass, which was found to be a good predictor of the rut depth after the forwarder. When the rut depth after harvester pass is included in the model, the water content and penetration resistance, even though they are significant predictors in the models, do not improve the AIC compared to the simple model (model 5) that includes only the cumulative mass and harvester rut depth. Residuals plotted against the predicted values show no trends especially with model 5. In the rut prediction model by Sirén, Ala-Ilomäki, et al. (Citation2013) the best model included the cumulative mass, harvester rut depth and the thickness of the residue mat. In our study, the logging residues were removed to determine the bearing capacity of the soil and thus the results are in line with earlier findings.
With model 5 in we can estimate, for instance, the maximum cumulative mass that still maintains the rut depth below the commonly accepted 10 cm limit. If the harvester rut depth is 2 cm, the allowed cumulative mass is some 180,000 kg and for 4 cm it is 145,000 kg.
Conclusions
In this work, the strong impact of the soil water content on rut formation on fine-grained soils was observed. In addition, the rut depth after one harvester pass was found to be a good proxy for the forwarder rut formation. The first finding encourages the development of harvesting planning tools that contain information on moisture variability, such as DTW maps. However, to be effective planning tools, DTW maps must be combined with soil type information (Mohtashami et al. Citation2017). The next step could be more dynamic wetness maps that adapt to changing hydrologic conditions (Jones and Arp Citation2017; Salmivaara et al. Citation2017).
The second finding was, that harvester rut formation predicts forwarder rut formation well and supports earlier results (Sirén, Ala-Ilomäki, et al. Citation2013; Sirén, Hytönen, et al. Citation2013). Additionally, this encourages the development of automated continuous rut depth measurement taken by the harvester. When operational, this data stream could be directly used for forwarder operator tutoring (Väätäinen et al. Citation2012), validation of trafficability classifications and in automated harvesting quality control.
Acknowledgements
The authors want to thank Metsäkoneurakointi Pekka Liiri Oy and Puistometsäpalvelu Oldenburg Oy for providing the machinery for the test drives.
Disclosure statement
No potential conflict of interest was reported by the authors.
ORCID
Matti Sirén http://orcid.org/0000-0003-2270-2989
Jari Ala-Ilomäki http://orcid.org/0000-0002-6671-7624
Additional information
Funding
References
- Ågren AM, Lidberg W, Strömgren M, Ogilvie J, Arp PA. 2014. Evaluating digital terrain indeces for soil wetness mapping – a Swedish case study. Hydrol Earth Syst Sci. 18:3623–3634. doi: 10.5194/hess-18-3623-2014
- Ala-Ilomäki J, Lamminen S, Sirén M, Väätäinen K, Asikainen A. 2012. Using harvester CAN-bus data for mobility mapping. In: Special issue. Abstracts for international conferences organized by LSFRI Silava in cooperation with SNS and IUFRO. Mezzinatne 25(58):85–87.
- Ayers PD, Perumpal JV. 1982. Moisture and density effect on cone index. Trans ASAE. 25:1169–1172. doi: 10.13031/2013.33691
- Bergkvist I, Friberg G, Mohtashami S, Sonesson J. 2014. STIG-projektet 2010-2014. [The STIG Project, 2010-2014.] Skogforsk, Arbetsrapport nr. 818 -2014. 18 pp. (in Swedish with English summary). Available from: https://www.skogforsk.se/kunskap/kunskapsbanken/2014/stig-projektet-20102014/.
- Beven KJ, Kirby MJ. 1979. A physically based, variable contributing area model of basin hydrology. Hydrol Sci J. 24(1):43–69. doi: 10.1080/02626667909491834
- Bygden G, Eliasson L, Wasterlund I. 2004. Rut depth, soil compaction and rolling resistance when using bogie tracks. J Terramech. 40:179–190. doi: 10.1016/j.jterra.2003.12.001
- Cambi M, Certini G, Neri F, Marchi E. 2015. The impact of heavy traffic on forest soils: a review. For Ecol Manag. 338:124–138. doi: 10.1016/j.foreco.2014.11.022
- Dexter AR, Czyz EA, Gate OP. 2007. A method for prediction of soil penetration resistance. Soil Tillage Res. 93:412–419. doi: 10.1016/j.still.2006.05.011
- Elbanna E, Witney B. 1987. Cone penetration resistance equation as a function of the clay ratio, soil moisture content and specific weight. J Terramech. 24:41–56. doi: 10.1016/0022-4898(87)90058-9
- Eliasson L. 2005. Effects of forwarder tyre pressure on rut formation and soil compaction. Silva Fenn. 39:549–557. Available from: http://www.metla.fi/silvafennica/full/sf39/sf394549.pdf. doi: 10.14214/sf.366
- Eliasson L, Wästerlund I. 2007. Effects of slash inforcement of strip roads on rutting and soil compaction on a moist fine-grained soil. For Ecol Manag. 252(1–3):118–123. doi: 10.1016/j.foreco.2007.06.037
- EN ISO 14688-1:2002. Geotechnical investigation and testing – Identification and classification of soil – Part 1: Identification and description (ISO 14688-1:2002). 14 pp. https://www.iso.org/standard/25260.html
- EN ISO 14688-2:2004. Geotechnical investigation and testing. Identification and classification of soil. Part 2: Principles for a classification (ISO 14688-2:2004). 15 pp. https://www.iso.org/standard/34082.html
- Forest Act 1093/1996. Available from: https://www.finlex.fi/en/laki/kaannokset/1996/en19961093_20140567.pdf
- Freitag DR. 1987. A proposed strength classification test for fine-grained soils. J Terramech. 24(1):25–39. doi: 10.1016/0022-4898(87)90057-7
- Friberg G. 2014. En analysmetod för att optimera skotning mot minimerad körsträcka och minimerad påverkan på mark och vatten [A method to optimize forwarding towards minimized driving distance and minimized effect on soil and water.] Examensarbete Nr 138, SLU, Institutionen för skogens produkter, Uppsala. 52 pp. (in Swedish with English abstract). Available from: https://stud.epsilon.slu.se/6956/1/Friberg_G_20140630.pdf
- Friberg G, Bergkvist I. 2016. Så påverkar arbetsrutiner och markfuktighetskartor körskador i skogsbruket. [How operational procedures and depth-to-water maps can reduce damage on soil and water and rutting in the Swedish forestry.] Skogforsk, Arbetsrapport nr. 904–2016. 30 pp. (in Swedish with English summary). Available from: https://www.skogforsk.se/contentassets/f70c51e0a98047779c7db9659486d309/sa-paverkar-arbetsrutiner-och-markfuktighetskartor-korskador-i-skogsbruket-arbetsrapport-904-2016.pdf
- Gerasimov Y, Katarov V. 2010. Effect of Bogie track and slash reinforcement on sinkage and soil compaction in soft terrains. Croat J For Eng. 31(1):35–45. Available from: http://www.crojfe.com/r/i/04-gerasimov_35-45.pdf
- Han HS, Page-Dumroese DS, Han SK, Tirocke J. 2006. Effect of slash, machine passes, and soil moisture on penetration resistance in a cut-to-length harvesting. Int J For Eng. 17(2):11–24. doi: 10.1080/14942119.2006.10702532
- Högnäs T, Kumpare T, Kärhä K. 2011. Turvemaaharvennusten korjuukelpoisuusluokitus. [Trafficability classification for peatland thinnings.] Metsätehon tulossarja 3/2011. 10 pp. (in Finnish). Available from: http://www.metsateho.fi/turvemaaharvennusten-korjuukelpoisuusluokitus/
- Hyvän metsänhoidon suositukset. 2006. [Forestry recommendations.] Metsätalouden kehittämiskeskus Tapio. 100 pp. (in Finnish).
- Hyvönen E, Pänttäjä M, Sutinen ML, Sutinen R. 2003. Assessing site suitability for Scots pine using airborne and terrestrial gamma-ray measurements in Finnish Lapland. Can J For Res. 33(5):796–806. doi: 10.1139/x03-005
- Ilmatieteen laitoksen sääasemien arkisto [Archive of Finnish Meteorological Institute]. n.d. https://suja.kapsi.fi/fmi-tilastot.php
- Jakobsen BF, Greacen EL. 1985. Compaction of sandy forest soils by forwarder operations. Soil Tillage Res. 5(1):55–70. Available from: https://ac.els-cdn.com/S0167198785800167/1-s2.0-S0167198785800167-main.pdf?_tid=0f43d997-e8b0-4b9c-a478-ea05de45a603&acdnat=1522845080_933e5f994cb3741ed23fcf0fd4af44a1 doi: 10.1016/S0167-1987(85)80016-7
- Jansson KJ, Johansson J. 1998. Soil changes after traffic with a tracked and a wheeled forest machine: a case study on a silt loam in Sweden. Forestry 71(1):57–66. doi: 10.1093/forestry/71.1.57
- Jones MF, Arp PA. 2017. Relating cone penetration and rutting resistance to variations in forest soil properties and daily moisture fluctuations. Open J Soil Sci. 7:149–171. doi: 10.4236/ojss.2017.77012
- Kärhä K, Poikela A, Keskinen S. 2010. Korpikuusikon korjuu sulan maan aikana. [Harvesting of peatland Norway spruce stand in unfrozen soil.] Metsätehon tuloskalvosarja 5/2010. 46 p. Available from: http://metsate1.asiakkaat.sigmatic.fi/wp-content/uploads/2015/02/Tuloskalvosarja_2010_05_Korpikuusikon_harvennus_kk.pdf
- Korjuujälki harvennushakkuussa. 2003. [Harvesting trace in thinnings.] Metsätehon opas. 36 pp. ISBN: 951-673-183-X. (in Finnish). Available from: http://www.metsateho.fi/korjuujalki-harvennushakkuussa/
- Labelle ER, Jaeger D, Poltorak BJ. 2015. Assessing the ability of hardwood and softwood brush mats to distribute applied loads. Croat J For Eng. 36(2):227–242. Available from: http://www.crojfe.com/r/i/crojfe_37-1_2016/Labelle.pdf
- Luoma V. 2017 Feb 17. Staattisen maastomallin käyttökelpoisuus maastomittausten valossa. [Feasibility of static terrain model.]. MEOLO/ Asiantuntijaryhmän kokous. University of Helsinki.
- Lüscher P, Frutig F, Sciacca S, Spjevak S, Thees O. 2010. Physikalischer Bodenschutz im Wald. [Physical soil protection in forest.] Bodenschutz beim Einsatz von Forstmaschinen. Merkbl. Prax. 45: 2. Aufl. 12 pp. (in German).
- Malmberg CA. 1981. Terrängmaskinen. Del 2 [The off-road vehicle. Volume 2.] 461 p. (in Swedish).
- Marra E, Cambi M, Fernandez-Lacruz R, Giannetti F, Marchi E, Nordfjell T. 2018. Photogrammetric estimation of wheel rut dimensions and soil compaction after increasing numbers of forwarder passes. Scand J For Res. 33(6):613–620. doi: 10.1080/02827581.2018.1427789
- Marx B, Randel AC, Schilli C, Hoeborn G, Helmus M, Rinklebe J. 2013. Ressourcen-schutzpotenzial bei Baumaßnahmen bezüglich Boden. [Soil protection in harvesting.] Endbericht des Forschungsprogramms „Zukunft Bau“ des Bundesministeriums für Verkehr, Bau und Stadtentwicklung. 130 pp. (in German).
- McDonald TP, Seixas F. 1997. Effect of slash on forwarder soil compaction. Int J For Eng. 8(2):15–26. doi: 10.1080/08435243.1997.10702700
- McNabb D, Startsev A, Nguyen H. 2001. Soil wetness and traffic level effects on bulk density and air-filled porosity of compacted boreal forest soils. Soil Sci Soc Am J. 65:1238–1247. doi: 10.2136/sssaj2001.6541238x
- Mohtashami S, Eliasson L, Jansson G, Sonesson J. 2017. Influence of soil type, cartographic depth-to-water, road reinforcement and traffic intensity on rut formation in logging operations: a survey study in Sweden. Silva Fenn. 51(5):14. doi: 10.14214/sf.2018
- Murphy PNC, Ogilvie J, Connor K, Arp PA. 2007. Mapping wetlands: a comparison of two different approaches for New Brunswick, Canada. Wetlands 27(4):846–854. doi: 10.1672/0277-5212(2007)27[846:MWACOT]2.0.CO;2
- Närhi P, Middleton M, Gustavsson N, Hyvönen E, Sutinen ML, Sutinen R. 2011. Importance of soil calcium for composition of understory vegetation in boreal forests of Finnish Lapland. Biogeochemistry 102: 239–249. doi: 10.1007/s10533-010-9437-2
- Niemi MT, Vastaranta M, Vauhkonen J, Melkas T, Holopainen M. 2017. Airborne LiDAR-derived elevation data in terrain trafficability mapping. Scand J For Res. 32(8):762–773. doi: 10.1080/02827581.2017.1296181
- Nugent C, Kanali C, Owende PMO, Nieuwenhuis M, Ward S. 2003. Characteristic site disturbance due to harvesting and extraction machinery traffic on sensitive forest sites with peat soils. For Ecol Manag. 180(1–3):85–98. doi: 10.1016/S0378-1127(02)00628-X
- Peuhkurinen J. 2017 Feb 17. Staattinen maastomalli – päivitetyn version ominaisuudet ja implementointi käytäntöön. [Static terrain model – characteristics and implementation.] MEOLO/ Asiantuntijaryhmän kokous. Arbonaut.
- Pierzchała M, Talbot B, Astrup R. 2016. Measuring wheel ruts with close-range photogrammetry. Forestry 89(4): 383–391. doi: 10.1093/forestry/cpw009
- Poltorak B.J, Labelle E.R, Jaeger D. 2018. Soil displacement during ground-based mechanized forest operations using mixed-wood brush mats. Soil Tillage Res. 179:96–104. doi: 10.1016/j.still.2018.02.005
- Rubio B.P. 2015. The bearing capacity of Nordic soil. Master of Science Thesis MMK 2015:47 MKN 134 KTH Industrial Engineering and Management Machine Design SE-100 44 STOCKHOLM. 71 p. Available from: http://www.diva-portal.org/smash/get/diva2:864173/FULLTEXT01.pdf
- Saarilahti M. 2002. Soil interaction model. Department of Forest Resource Management, University of Helsinki. [Internet]. [cited 2016 Mar 31]. Available from: http://ethesis.helsinki.fi/julkaisut/maa/mvaro/publications/31/soilinte.pdf
- Sakai H, Nordfjell T, Suadicani K, Talbot B, Bollehuus E. 2008. Soil compaction on forest soils from different kinds of tires and tracks and possibility of accurate estimate. Croat J For Eng. 29(1):15–27.
- Salmi M, Räsänen T, Hämäläinen J. 2013. Kosteusindeksi puunkorjuun olosuhteiden ennakoinnisssa. Kosteusindeksin laskennan kuvaus ja pilottitutkimuksen tulokset. [The use of topographic wetness index in prediction of harvesting conditions.] Metsätehon raportti 229. 20.12.2013. ISSN1996-2374 (verkkojulkaisu). Metsäteho Oy. 32 pp. (in Finnish). Available from: http://www.metsateho.fi/kosteusindeksi-puunkorjuun-olosuhteiden-ennakoinnissa/
- Salmivaara A, Launiainen S, Ala-Ilomäki J, Kulju S, Laurén A, Sirén M, Tuominen S, Finér L, Uusitalo J, Nevalainen P, et al. 2017. Dynamic forest trafficability prediction by fusion of open data, hydrologic forecasts and harvester-measured data. Poster. 1 p.
- Salmivaara A, Miettinen M, Finér L, Launiainen S, Korpunen H, Tuominen S, Heikkonen J, Nevalainen P, Sirén M, Ala-Ilomäki J, et al. 2018. Wheel rut measurements by forest machine mounted LiDAR sensor – Accuracy and potential for operational applications. Int J For Eng. 29(1):41–52. doi: 10.1080/14942119.2018.1419677
- Sirén M, Ala-Ilomäki J, Mäkinen H, Lamminen S, Mikkola T. 2013. Harvesting damage caused by thinning of Norway spruce in unfrozen soil. Int J For Eng. 24(1):60–75. doi: 10.1080/19132220.2013.792155
- Sirén M, Hytönen J, Ala-Ilomäki J, Neuvonen T, Takalo T, Salo E, Aaltio H, Lehtonen M. 2013. Integroitu aines- ja energiapuun korjuu turvemaalla sulan maan aikana – korjuujälki ja ravinnetalous. [Integrated harvesting of industrial and energy wood on peatlands under unfrozen period.] Working Papers of the Finnish Forest Research Institute 256. 24 pp. Available from: http://www.metla.fi/julkaisut/workingpapers/2013/mwp256.pdf
- Susnjar M, Horvat D, Seselj J. 2006. Soil compaction in timber skidding in winter conditions. Croat J For Eng. 27(1):3–15. Available from: https://hrcak.srce.hr/index.php?show=clanak&id_clanak_jezik=6550
- Sutinen R. 1992. Glacial deposits, their electrical properties and surveying by image interpretation and ground penetrating radar. Geol Surv Finl Bull. 359:123. Available from: http://tupa.gtk.fi/julkaisu/bulletin/bt_359.pdf
- Sutinen R, Teirilä A, Pänttäjä M, Sutinen ML. 2002. Distribution and diversity of tree species with respect to soil electrical characteristics in Finnish Lapland. Can J For Res. 32(7):1158–1170. doi: 10.1139/x02-076
- Tamminen P. 1991. Kangasmaan ravinnetunnusten ilmaiseminen ja viljavuuden alueellinen vaihtelu. [Expression of soil nutrient status and regional variation in soil fertility of forested sites in Southern Finland.] Folia Forestalia 777. 40 p. (In Finnish with English summary). Available from: http://urn.fi/URN:ISBN:951-40-1170-8
- Toivio J, Helmisaari HS, Palviainen M, Lindeman H, Ala-Ilomäki J, Sirén M, Uusitalo J. 2017. Impacts of timber forwarding on physical properties of forest soils in southern Finland. For Ecol Manag. 405:22–30. doi: 10.1016/j.foreco.2017.09.022
- Topp GC, Davis JL, Annan AP. 1980. Electromagnetic determination of soil water content: measurements in coaxial transmission lines. Water Resour Res. 16(3):574–582. doi: 10.1029/WR016i003p00574
- Uusitalo J, Ala-Ilomäki J. 2013. The significance of above-ground biomass, moisture content and mechanical properties of peat layer on the bearing capacity of ditched pine bogs. Silva Fenn. 47(3):1–18. doi: 10.14214/sf.993
- Uusitalo J, Ala-Ilomäki J, Lindeman H, Toivio J, Sirén M. 2018. Modeling soil moisture – soil strength relationship of fine-grained mineral soils in Finland (submitted manuscript). 27 pp.
- Uusitalo J, Salomäki M, Ala-Ilomäki J. 2015. The effect of wider logging trails on rut formations in the harvesting of peatland forests. Croat J For Eng 36(1):125–130. Available from: http://www.crojfe.com/r/i/crojfe_36-1_2015/uusitalo.pdf
- Väätäinen K, Lamminen S, Ala-Ilomäki J, Sirén M, Asikainen A. 2012. More efficiency with intelligent operator tutoring systems in wood harvesting. In: Special issue. Abstracts for international conferences organized by LSFRI Silava in cooperation with SNS and IUFRO. Mezzinatne 25(58):125–126.
- Väätäinen K, Lamminen S, Ala-Ilomäki J, Sirén M, Asikainen A. 2013. Kuljettajaa opastavat järjestelmät koneellisessa puunkorjuussa – kooste hankkeen avaintuloksista. [Operator assistance systems in merchanized harvesting.] Working Papers of the Finnish Forest Research Institute 279. 24 pp. (in Finnish). Available from: http://www.metla.fi/julkaisut/workingpapers/2013/mwp279.htm
- Valtioneuvoston asetus metsien kestävästä hoidosta ja käytöstä. 2013. [Government decree on sustainable management and use of forests 1038/2013.] Available from: http://finlex.fi/fi/laki/ajantasa/2013/20131308
- Vega-Nieva DJ, Murphy PNC, Castonguay M, Ogilvie J, Arp PA. 2009. A modular terrain model for daily variations in machine-specific forest soil trafficability. Can J Soil Sci. 89:93–109. doi: 10.4141/CJSS06033
- Wästerlund I. 1989. Strength components in the forest floor restricting maximum tolerable machine forces. J Terramech. 26(2):177–182. doi: 10.1016/0022-4898(89)90005-0
- Westman CJ. 1990. Soil physical and physico-chemical properties of Finnish upland forest sites. Silva Fenn. 24(1):41–158. (In Finnish with English summary). doi: 10.14214/sf.a15568
- Willén E, Friberg G, Flisberg P, Andersson G. 2017. Bestway – beslutstöd för förslag till huvudbasvägar för skotare – Demonstrationsrapport BillerudKorsnäs-Mellanskog. [Bestway – Decision support tool for proposing main base roads for forwarders. Demonstration report for BillerudKorsnäs and Mellanskog.] Skogforsk. Arbetsrapport 955. 27 pp. (in Swedish with English summary). Available from: https://www.skogforsk.se/contentassets/60d1a46520644987bfce2624db7fabc2/arbetsrapport-955-2017.pdf
- Wronski EB, Stodart TM, Humpreys N. 1990. Trafficability assessment as an aid to planning logging operations. Appita 43(1):18–22.
- Zeleke G, Owende PMO, Kanali CL, Ward SM. 2007. Predicting the pressure-sinkage characteristics of two forest sites in Ireland using in situ soil mechanical properties. Biosyst Eng. 97(2):267–281. doi: 10.1016/j.biosystemseng.2007.03.007