
ABSTRACT
This paper presents an economic assessment of two different policies – both implying an increased demand for forest ecosystem services – and how these could affect the competition for forest raw materials. A forest sector trade model is updated to a new base year (2016), and then employed to analyze the consequences of a more intense use of bioenergy and increased forest conservation in Sweden. These scenarios are assessed individually and in combination. A particularly interesting market impact is that bioenergy promotion and forest conservation tend to have opposite effects on forest industry by-product prices. Moreover, combining the two policies mitigates the forest industry by-product price increase compared to the case where only the bioenergy-promoting policy is implemented. Namely, the energy using sector (heat and power) is less negatively affected in terms of increased feedstock prices if bioenergy demand targets are accompanied by increased forest conservation. This effect is due to increasing pulpwood prices, which reduces pulp, paper and board production, and in turn mitigates the competition for the associated by-products. Overall, the paper illustrates the complexity of the forest raw material market, and the importance of considering demand and supply responses within and between sectors in energy and forest policy decision-making.
Introduction
This paper addresses the question of how two different policies – both implying an increased demand for forest ecosystem services – may affect the competition in terms of price impacts and resource allocation of forest raw materials. The focus is on policies promoting forest conservation on the one hand, and those inducing an increase in the use of forest-based bioenergy use on the other. It should be clear that implementing these two policies at the same time could involve difficult trade-offs and potential goal conflicts; i.e. an increased ambition for one policy may make it more difficult to pursue the other. Specifically, the costs of increasing the demand for forest-based biofuels could well be higher in the presence of more stringent forest conservation policies. In this paper, we investigate the market interactions between the various sectors supplying and relying on forest raw materials in the presence of the two overall policies. This is achieved in the empirical context of the Swedish forest raw material market.
Goal conflicts exist in all policy areas, not the least in the environmental domain (Henkens and van Keulen Citation2001; Henle et al. Citation2008; Geijer et al. Citation2011). Due to the many values and biological functions of forests, it should be of no surprise that various policies affecting the use of forest raw materials include contrapositions. However, theoretically, if conservation is increased in a geographical area where there is no economic desire to manage the forest, there should be no conflict. While that is true, it is well known that in Sweden there is an ongoing intense debate between forest owners and advocates for forest conservation in Sweden (e.g. Pedroli et al. Citation2013; Lindahl et al. Citation2017), thus suggesting that the “normal situation” is characterized by difficult trade-offs between conservation and development. Ambjornsson et al. (Citation2016) conclude that the lack of legal clarity and the double aim towards production and protection, have in many ways fueled this conflict. Some of the other forest related conflicts concern: desired wolf population (von Essen and Hansen Citation2015; Duit and Lof Citation2018), Sami land rights vs. native predators, forestry, industries, and renewable energy extraction (Hobbs et al. Citation2012; Sandström et al. Citation2016; Ostmo and Law Citation2018), and forest wildfire management (Eckerberg and Buizer Citation2017). All of these conflicts, except for forest wildfire management, can be boiled down to “more conversation” vs. “more commercial use” of the forest. Forest wildfires can have a significant influence on the supply of wood, but the impact of a specific forest management strategy in Sweden is nevertheless likely to be limited. In future scenarios in which climate change leads to more frequent and widespread wildfires, or other natural hazards, the importance of forest management strategies will increase and could potentially lead to conflicts of interest between forest owners, environmental impacts and/or interest groups. As of today, one of the most apparent policy conflicts likely to significantly affect the forest raw material market in Sweden is that of bioenergy use versus forest conservation.
Whereas forest bioenergy contributes to reduced greenhouse gas (GHG) emissions from fossil fuels and improved security of energy supply, a standing forest supplies biodiversity, carbon sequestration and other significant ecosystem services. With an increasing global interest for bioenergy as well as a growing recognition that biodiversity is very important for global well-being, the debate about the optimal use of forest resources has intensified, not least in countries where forestry constitutes a central part of the domestic economy. Several studies have illuminated this increasingly conflict-ridden policy area (e.g. Kline et al. Citation2015; Kroger and Raitio Citation2017; Wuestemann et al. Citation2017), and various environmental evaluations of bioenergy in the context of climate change mitigation have been conducted (e.g. Carmenza et al. Citation2017; Gasparatos et al. Citation2017). For an overview of conflicting areas regarding the “more and less harvest” issue, see e.g. Felton et al. (Citation2020), Simonsson et al. (Citation2015), and van der Voorn et al. (Citation2020). For studies focusing on specific aspects relating to this, e.g. geographical areas, forest types, and logging procedures, see e.g. Hallberg-Sramek et al. (Citation2020), Kleinschmit et al. (Citation2014), and Sjölander Lindqvist and Sandstrom (Citation2019). However, the market effects of policy mixes aiming at both increasing forest conservation and biomass extraction for bioenergy purposes have been less studied.
A few studies have addressed the market effects from both increasing forest conservation and more bioenergy, but typically with a focus on the environmental outcomes from heat and power bioenergy derived from non-forest biomass. Dixon et al. (Citation2013) found that the combination of two EU directives, one promoting bioenergy and the other one promoting forest conservation, would lead to increased food prices in economically vulnerable countries due to increased land prices. Geijer et al. (Citation2011) found that increasing forest conservation, according to the Swedish policy Sustainable Forests, lead to increased GHG emissions in Sweden due to feedstock substitution from forest biomass to oil in the HP sector – a result in direct conflict with Sweden’s climate policy targets. Both of these above studies illustrate the importance of studying feedstock price formation, and its consequences for resource allocation under conflicting polices.
Bioenergy conversion is closely interlinked with forest industries via the market for forest raw materials in which both types of sectors compete for the feedstock. The objective of this paper is to take these interlinkages into account, and investigate forest raw material price formation and resource allocation in a domestic forest biomass market in the presence of increased bioenergy HP demand as well as decreased forest raw material supplies following the implementation of forest conservation policies. The nuances of choosing and implementing policies promoting biodiversity, cleaner energy or other environmental benefits, are complex, and these are beyond the scope of this paper. By compressing the goal conflict to its core, more bioenergy use versus more forest conservation, we make room for investigating the market complexity of combining these goals.
The analysis builds on the use of a partial equilibrium model of the Swedish forest raw materials market. In this model, forest owners supply raw materials (e.g. sawlogs), and consumers demand final use products (e.g. sawnwood and energy) (Carlsson Citation2011). The forest industries, such as pulp and paper industries and sawmills, and the HP sector demand feedstock, produce forest products and convert biomass to energy, respectively. The prices for the raw materials, including any by-products (e.g. sawdust, harvesting residues) from the forest industries, will be affected by the underlying demand.
Within this model, three types of scenarios are analyzed: (a) increased demand for forest bioenergy in the HP sector; (b) reduced supply of forest raw materials due to increased forest conservation initiatives; and (c) a combination of (a) and (b). This research focus is motivated by the following reasons: (a) it indicates whether resources tend to be drawn away from the bioenergy-using HP sector under increased forest conservation; (b) it reveals how altered raw material prices affect the forest industries’ production patterns; and (c) it gives insights to how by-product supplies are affected and, in turn, how this could influence the allocation of the feedstock across sectors. Unlike the lion’s share of previous studies, this study focuses entirely on the market aspects of the underlying goal conflict, in turn permitting an in-depth economic analysis of a disaggregated forest raw material market. Unlike life-cycle or techno-economic models, this study allows for the assessment of price formation of biomass feedstocks and products. Changes in prices will lead to altered forest raw material resource allocations between sectors and industries. Such an assessment should shed light on the magnitudes of at least some of the difficult trade-offs in society’s use of forest resources, and assist in supporting key decision-making processes in the field.Footnote1
Sweden is an interesting case to study in the context of conflicting forest policies. With its land area consisting of 57% productive forest land, a well-developed forest industry sector, and a mature HP bioenergy sector, the country possesses many of the prerequisites for further expanding the use of bioenergy, both in the HP sector and in new fuels for transport (Mustapha et al. Citation2017). Such expansion is in line with the European Union’s ambitious renewable energy targets (Citation2009/Citation28/EC), and its bioeconomy strategy (EC Citation2012). Meanwhile, though, Sweden has also adopted ambitious forest biodiversity targets, which promotes forest conservation (SEPA Citation2012; Government Bill Citation2013/Citation14:Citation141) (for an overview of the debate, see Bryngemark Citation2019a). In the past few years, a debate regarding the use of the Swedish forests has emerged, and here strong differences of opinion have been expressed. The two sides can be summarized into two main positions: “More forest conservation” and “More bioenergy based energy” (see further Bryngemark Citation2019a). This study moves beyond specific arguments or postures presented in the debate, and instead, investigates the market effects from such policies, implemented individually and in combination.
The remainder of the paper is organized as follows. Section 2 provides a background to Swedish forest policy, as well as to the development of bioenergy use in the HP sectors, and its drivers. Section 3 presents the modeling approach, the calibration procedure with updated data, modeling assumptions and limitations, and the scenarios to be investigated. The modeling results are presented in Section 4, followed by a discussion in Section 5. Finally, conclusions and some avenues for future studies are presented in Section 6.
Background
Protected and harvested forests in Sweden
Approximately 11% of Sweden’s land area is protected land. Since 1998, the protected land area in the country has increased by 50% (SCB Citation2018a). In addition to state protected forests, forest owners are also expected to voluntary set aside forest land. The total voluntarily conserved forest in Sweden in 2016 has been estimated to around 1.2 million hectares, which equals around 5% of all productive forest area in Sweden (SFA Citation2017). For a discussion of the driving forces, the debate and implementation of forest policies concerning forest conservation in Sweden, see Simonsson et al. (Citation2015).
Since the 1960s, both the total volume of forest harvested and the standing forest volume have increased in Sweden (SLU Citation2018). This simultaneous increase can be explained by increased productivity in the sector, e.g. more efficient logging operations, transport and manufacturing, and increased forest growth (KSLA Citation2015). From the late 1990s until today, natural reforestation has decreased and plantations have increased (SFA Citation2018b). Still, hectares of old forest are increasing (e.g. a 38% increase between 1985 and 2012). This can be explained by the increase in protected forest land (SLU Citation2018). In summary, more forest land is currently protected, but the forest land available for logging is also used more intensively.
In order to protect biodiversity, Sweden has adopted the Environmental quality objectives for 2020, which include several objectives, “A rich diversity of plant and animal life”, “Thriving wetlands”, “Natural acidification only”, “Reduced climate impact” and, for this study, the most crucial “Sustainable forests” (SEPA Citation2012). As for the latest evaluation of these objectives, these targets were not met. The Swedish Environmental Protection Agency (SEPA) concludes that “many species and habitat types risk disappearing and ecosystems being depleted in forests and on agricultural land as well as in mountains, lakes, wetlands and the sea.” (SEPA Citation2018). To avoid such development, it is argued, more forest land has to be conserved. Still, the amount of forest that has to be conserved is debated, and there is no strong scientific consensus on how to define “sustainable harvest”, and which conservation measures are considered good practice (de Jonga et al. Citation2017; Mansuy et al. Citation2018; Hammar et al. Citation2019; de Bikuna et al. Citation2020).
Nevertheless, the Swedish government has stated the following conservation targets to be met by the year 2020 (compared to 2010 levels) (Government Bill Citation2013/Citation14:Citation141): 1). Voluntary set-aside productive forest for conservation purposes has to increase by at least 0.2 million hectares, which equals a little more than 0.8% of all productive forest land; 2) State-protected forest land has to increase by 0.15 million hectares in particularly biologically sensitive areas, which equals slightly more than 0.6% of all productive forest; and 3) at least 5% of Sweden’s FSC certified productive forest shall be conserved for forest conservation purposes. About 65% of all productive forest is FSC certified in Sweden, making the third target equaling about 3.3% of all productive forest. Lastly, in addition to the forest specific conservation targets 1–3, 4) 0.8 million hectare of land close to biologically sensitive wetlands, marina, and lakes, shall be conserved (Government Bill Citation2013/Citation14:Citation141). Targets 1–3 sum up to 4.7% of all productive forest land in Sweden. It is unknown how much of the 0.8 million hectares presented in (4) that is productive forest. Assuming a low percentage such as 0.5% would imply an additional 0.17% productive forest to be conserved. Given these calculations, the conservation targets stated in the government bill sums up to approximately 5% of all productive forest. However, The Swedish Environmental Protection Agency (SEPA) has suggested that a 20% increase in forest conservation is needed to reach the environmental quality objective “Sustainable forests” by the year 2020 (SEPA Citation2020).
To reflect these “policies”, this study will investigate the forest raw material market effects of two conservation scenarios: one low-conservation scenario in which roundwood harvest is reduced by 5%, and one high-conservation scenario in which such harvest is reduced by 20% (both compared to the 2016 level).
Demand for forest biomass in the Swedish energy sector
Since the 1970s, the use of biomass in the Swedish energy sector has increased significantly and forest biomass has become the main feedstock in the Swedish district heating sector. Biomass has also been increasingly used for power generation purposes. In 2016, total domestic bioenergy supply was estimated at 139 TWh, and it constituted 24% out of total energy supply in Sweden, whereof at least 80% originated from forest materials (SEA Citation2017, Citation2018c).
The development of biomass use in the energy sector has been supported by several policy measures aiming at reducing the reliance on fossil fuels. During the mid-1970s and the 1980s, the government subsidized heat demonstration plants that could burn solid fuels (Ericsson and Werner Citation2016), and the use of solid fuels was further promoted through the so-called Solid Fuel Act (SFS Citation1981:Citation599). One important reason for bioenergy’s growth is the Swedish energy tax, modified in 1991 to include the carbon dioxide tax. Neither of these taxes have been levied on sustainable biofuels (SFS Citation1990:Citation582; McCormick and Kaberger Citation2005; Swedish Government Citation2018). The energy tax was enhanced with investment grant program (during the periods 1991–1996 and 1997–2002) for biomass-based combined heat and power (CHP) plants (Ericsson and Werner Citation2016). Furthermore, the introduction of the renewable electricity certificate program in 2003 provided further economic incentives for the use of forest-based biomass in CHP plants. In 2017, Sweden adopted ambitious climate targets; not least that by 2045, the country should be carbon neutral (Government Bill Citation2008/Citation09:Citation162). Forest biomass is expected to play a key role in reaching this target (Swedish Government Citation2016; SEA Citation2018b).
The future demand for energy in the HP sector is uncertain. On the one hand, heat demand is expected to decrease in the future due to more energy efficient buildings (Ericsson and Werner Citation2016). On the other hand, CHP production can be an efficient solution during periods with low intermittent production and high electricity demand levels. Gustafsson et al. (Citation2018) investigate solutions including electricity demand reductions and converting electricity-based heating in buildings to district heating based on combined heat and power. They argue that choosing the “right” heating system is more important than reducing demand, and that it is possible to cover future electricity peak demand in Sweden by using CHP produced from forest biomass residues.
In an extensive review of future Swedish demand for forest biomass in the HP sector, industries and in the road transport, considering the techno-economic potential in the country, Börjesson et al. (Citation2017) conclude that this demand is expected to increase by 30 TWh until 2030 and by 35–40 TWh until 2050 (compared to 130 TWh in the year 2013). These authors find large differences in potentials and future demand depending on the assumptions made regarding future energy efficiency improvements as well as to what extent the electrification of the transport fleet has developed (Börjesson et al. Citation2017).
Clearly, it is possible that bioenergy use will also grow in other sectors, most likely the transport sector (see e.g. Bhutto et al. Citation2016; and Mustapha et al. Citation2017 for a market impact analysis). In addition to HP and transport fuels, forest biomass may also be in demand for the production of products such as green chemicals and plastics, in so-called advanced biorefinery concepts (Ulonska et al. Citation2018) – technologies which would also add to the competition for forest biomass. Due to several possible future outcomes for forest bioenergy use in Sweden, the present study investigates feedstock price formation and resource allocation under two scenarios of increased forest biomass use in the Swedish HP sector: 15 and 30 TWh in addition to the production of 92 TWh produced from forest biomass in the year 2016.
Methods and data
Market price formation and modeling points of departure
The HP sector and the forest industries are interconnected through the market for forest biomass. Some of the forest industries’ (e.g. sawmills), supply by-products (i.e. sawdust, bark, etc.), which the HP sector can use as inputs. Other forest industries, such as plywood production, compete with the HP sector for forest industry by-products. Moreover, the forest industries demand roundwood, something which causes a supply of harvesting residues, and these resources can also be used as inputs in the HP sector. This in turn reduces the competition for by-products. The price formation in the case of roundwood is dependent of the supply of roundwood (available quantities, harvesting costs, etc.), and the procurement competition for this feedstock. A by-product does not have a production cost (apart from costs for handling and transportation), but can be traded for the price determined by the demand in the market. Since by-product supply is constrained by the production of the main product, the marginal cost curve is expected to be flat for low levels of demand and increase sharply (exponentially) when supply is approaching the constraint set by the production level for the main product (Söderholm and Lundmark Citation2009).
Increased HP production from forest biomass is expected to increase the overall feedstock prices in the forest raw material market (see e.g. Carlsson Citation2011; and Schwarzbauer and Stern Citation2010). However, Lauri et al. (Citation2017) investigated bioenergy demand targets and found only moderate forest raw material feedstock price rises. They argue that increased returns on by-products can spur sawmills to produce more sawnwood, something that in turn generates an increased by-product supply and helps to reduce the overall feedstock price increase. In the present study, this by-product effect is expected to be non-existent or very small since sawnwood production cannot increase due to input restrictions on sawlogs; domestic sawlog harvest, as well as roundwood imports (see further Section 3.4), are restricted to 2016 levels (pulpwood cannot be used in sawnwood production). All three studies above find sawmills to benefit from increased by-product prices, and that the panel and paper industries would be worse off due to increased input prices; a result expected also in this study. However, the magnitude of these effects are not known. A decrease in the supply of roundwood implies a reduction in sawnwood production, and a proportional decrease in the supply of by-products, as well as decreased supply of harvesting residues in proportion to the decrease in roundwood harvest. Thus, reduced harvest will intensify the competition for forest raw materials. This can potentially lead to feedstock substitution in the HP sector where forest raw materials could be substituted with fossil fuels, as well as to structural transformations. Trømborg et al. (Citation2013) and Bryngemark (Citation2019b) both investigate the impact of increased demand for second generation biofuels on the existing HP bioenergy sector. Whereas Trømborg et al. (Citation2013) find that increased wood prices do lead to decreased use of forest biomass in the Norwegian HP sector, Bryngemark (Citation2019b) does not make the same observation for the Swedish HP sector (after using an extended version of the SFSTMII model used in this study). The main reason for this difference in results is believed to be Sweden’s considerably larger forest industry sector and forest biomass supply, in turn making Sweden less sensitive to increased demand compared to Norway (Bryngemark Citation2019b).
Kallio et al. (Citation2018) find that reduced harvest levels in the EU and Norway would lead to increased raw material prices in the global market. In this study, reduced harvest in Sweden is expected to increase feedstock prices in Sweden, but not in the world market. These price increases are in turn anticipated to affect the allocation of forest biomass across the various sectors using this resource. Forest conservation in Norway and Finland are shown to have low price impacts on roundwood prices in the case in which imports can substitute for domestic materials. In the case imports are restricted (e.g. due to increased forest conservation among trade partners), roundwood prices are affected more substantially. Sawmills are found to be worse off in the case of increased forest conversation whereas paper production is unaffected (Bolkesjo et al. Citation2005; Hanninen and Kallio Citation2007). In the present study, import possibilities are restricted, and price increases on roundwood can therefore be expected.
The SFSTMII model
This research is carried out using the so-called Swedish Forest Sector Trade Model (SFSTM)II, developed by Lestander (Citation2011) and extended by Carlsson (Citation2011). The modeling structure and general assumptions about supply and demand curves in the SFSTM are similar to those adopted in the Global Trade Model (GTM) family, developed at IIASA in the 1980s by Kallio et al. (Citation1987), later EFI-GTM (Kallio et al. Citation2004). SFSTMII is a static, one-period, national spatially explicit forest sector model, (i.e. a partial equilibrium model). In the model, Sweden is divided into four regions (see Bryngemark (Citation2019a) for a geographical representation). The theoretical framework underlying the modeling simulations relies on Samuelsson's (Citation1952) theory of perfectly competitive spatial price equilibriums.Footnote2 The four regions trade raw materials and forest industry products with each other as well as with a region representing the Rest of the World (ROW).Footnote3 ROW is incorporated as a trade partner in order to reflect the international competition for forest biomass and products. The transport costs of biomass are included to reflect the differences in distances between regions. Imports occur when a product is cheaper in another region (taking into account transportation costs). Thus, raw materials (e.g. sawlogs) and products (e.g. sawnwood) are assumed to be perfect substitutes across the various regions (i.e. homogenous goods).
The SFSTM II is not developed to handle intra-regional geographical restrictions; it only has four regions and this is not sufficient for targeting specific forests (e.g. in terms of type and exact geographical location), meaning that geographic specific conservation scenarios cannot be investigated in SFSTM II. This would be a disadvantage if the objective would be to study the impact of forest conservation on local economies, e.g. local employment rates. However, since all regions are connected through inter-regional trade, the geographical location of the initial price change is not expected to significantly affect the model results. Local price changes will instead smooth out through intra-regional trade, and it does not matter where within a region the price increase occurred.Footnote4 A spatial-explicit price model, such as Ouraich et al. (Citation2018), could in principle be used to determine local price impacts from reduced harvest in specific areas in Sweden. However, that kind of model does not include domestic trade, the forest industry market, or the bioenergy sector, which would leave out important information regarding the two policies’ impact on the forest raw material market.
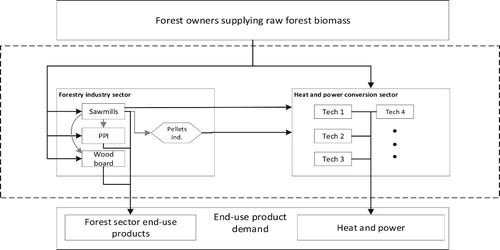
SFTSM II includes the forest owners’ raw material supply of roundwood and harvesting residues, the forest industries’ demand for feedstock, the forest industries’ and HP production technologies, as well as the supply of final products, intermediate products, and by-products. In this way, the model enables analyses of feedstock competition between the forest industries and the bioenergy use in the HP sector. provides a schematic illustration of the SFSTMII. The box at the top illustrates the supply of raw materials, the large box in the middle, the interconnections between the forest industries and the HP sector. Finally, the bottom box illustrates the demand for forest-based end-use products and biomass use in the HP sector. The model is implemented in the General Algebraic Modeling Language (GAMS, version 24.4.6).
Figure 1. Schematic illustration of the SFSTMII model. The abbreviation PPI stands for Pulp and Paper Industry.
Production is modeled based on input-output coefficient analysis. If a plant is producing at its maximum capacity and demand increases, new capacity is added subject to an investment cost.3FFootnote5 In order to produce HP using forest biomass, the model can choose the following feedstocks: wood chips, sawdust, bark, pellets (processed from wood chips, sawdust or bark), and harvesting residues. Unlike Carlsson (Citation2011), this study does not allow pulpwood to be used in the HP sector. This assumption is in line with the European Union’s waste hierarchy, established in the EU Directive 2008/98/EC and re-established in the REDII directive (EU 10308/Citation18, Citation2018).
The endogenous price formation represents the central signal to the agent. With price changes comes new resource allocations, which in turn lead to changes in the demand for inputs, capacity expansion, etc. This study investigates exogenous changes in harvest levels and the demand for bioenergy heat and power, respectively. These changes are incorporated using constraints: the conservation targets are implemented via upper limit constraints preventing the harvest function to exceed the harvest reference level and the subtracted conservation target. The biofuel targets are implemented through binding constraints that puts a cap on the HP bioenergy sector’s production function.
Using this model, the Swedish forest raw material market can be assessed under domestic as well as global (external) price changes. In this study, though, we focus on two domestic policies. The only exogenous changes to the model are the two policies assessed. Adding more exogenous changes while evaluating the policy impact would likely not be desirable as it would make it very hard to distinguish what is the policy impact, and what are the results of changes in other factors.
Model calibration
The latest version of the SFTSMII includes data from 2008. In this paper, all data have been updated and calibrated to the year 2016. A summary of the updated data is provided below, and it is presented in detail in Appendix in Bryngemark (Citation2019b). SFTSMII contains four categories of data for both the Swedish regions and the ROW:
Harvest levels (regional, three tree species, two roundwood types, harvesting residues);
Regional production (sawnwood, paper, HP bioenergy etc.) for a total of 30 end-use products and intermediate products for all regions;
Demand (use) for the products outlined in b) and for forest raw materials (feedstock in production); for a total of 140 different activities. Product demand can be satisfied with different activities in b), e.g. HP bioenergy can be produced from sawdust as well as bark, etc.
Prices of forest raw materials, products, and HP energy.
Data have been gathered mainly from the Swedish Forest Agency (SFA), the Swedish Forest Industries Federation (SFIF), Statistics Sweden (SCB), and FAOSTAT. Much of the available data concerning forest industry production has changed since 2008, and this is mainly due to the discontinuation of the Statistical Yearbook of Forestry produced by Statistics Sweden. For this reason, harvest data and data on production of sawnwood, pellets etc. have instead been obtained from several sources and processed to fit into the specific regional disaggregation presented in Bryngemark (Citation2019b). Moreover, the fossil fuel price for the energy sector is assumed to be equivalent to the price for heavy oil, which in 2016 equaled 70 EUR/MWh (SPBI Citation2018).
Modeling assumption and limitations
As mentioned in the introduction, other conflicting policies in regards to forest use, such as the size of a desirable wolf population and land conflicts, can be understood as specific conflicts under the umbrella conflict “more or less harvest”. In addition to the existing conflicts, there are also possible new conflicts that can emerge with the advent of climate change, e.g. forest management in the context of natural hazards, e.g. forest wildfires, which can have a significant impact on forest raw material supply, temporarily as well as in the long term. A forest wildfire initially lead to oversupplies in the wood markets as salvaged wood then is removed from the site. The oversupply leads to a price drop, which is followed by a price increase as the standing forest has become scarcer. The magnitude of these price swings will partly depend on the forest management approach. This is an interesting price dynamic to estimate in itself, but even more so in relation to other policies, e.g. bioenergy targets (which can utilize salvaged wood), and forest conservation (forest wildfires can work both for and against biodiversity). In this study, no scenarios including natural hazards are included and the reason for this is twofold. Firstly, analyzing price impacts from natural disasters require a time dimensions in the model. Our model is static (i.e. it has no time dimension), and therefore the investigation of dynamic price changes is not feasible in this study. Static optimization is used when the focus is on what the new equilibrium is for a given change (here both in supply and demand). Instead of focusing on the path to a new equilibrium, we compare the new equilibrium to the baseline scenario to learn about the policy’s impact on the forest raw material market. Secondly, we investigate eight scenarios (see next Section); adding an additional external event, such as a severe wildfire, would add additional complexity and possibly obstruct the understanding of the two policies’ impact on the forest raw material market.
SFSTM II (and similar models) assumes market characteristics such as rational agents, perfect information, unlimited access to capital, and no legal constraints, all of which relate to a perfectly competitive market. That means that if it is profitable to increase production for an industry, the agents are assumed to act accordingly. Although these assumptions are commonly used and accepted in economic model, the real world is likely to fail one or more of these assumptions, in turn causing a discrepancy between modeling output and real world output. Moreover, adding production capacity can be subject to several challenges, such as budget and legal planning, extended licensing procedures, construction work, and risk assessment. If implementation takes time, the subsequent chain of events would halt and lead to efficiency losses and sub-optimal resource allocation. Such outcomes are not addressed in this study, which also could let to a discrepancy between the simulated results and real world output. However, a model simulating non-efficient solutions due to subjectively chosen supply chain delays would generate large uncertainties and might not be helpful in understanding the impact of policies. One way to account for delays is to incorporate sensitivity analysis for an area known to vary and have considerable impact on the output.
Furthermore, in reality, there are no system boundaries, and for this reason, a delay in capacity expansion in one industry could lead to a shift to production in another industry. In the case of increased demand for bioenergy heat and power, and a forest industry that cannot supply enough by-products, a HP plant can sometime utilize other feedstocks e.g. municipality waste, excess heat from industry. This is not allowed in this model because we do want to know what happens when competition for forest biomass increases. Another outcome would be an unmet bioenergy target, which is also not considered as an outcome in the model.
Finally, it is important to acknowledge that the harvesting method and type of forest being harvested, are associated with different management costs as well as impacts on biodiversity. In this study, we use current harvest levels as a baseline, and from that level we reduce harvest to investigate the market impact from reduced harvest as a proxy for more forest conservation, similar to for instance Bolkesjo et al. (Citation2005). We are neither participating in the discussion on good practices, nor do we differentiate between forest types, harvesting techniques, or conservation methods. These are, however, important questions for future research.
When constructing a model like the one used here, there is always a trade-off between complexity and transparency (Pfenninger et al. Citation2014). The SFSTM II is a static model and solves equilibrium for Sweden and the region ROW. Another partial equilibrium model with the same optimizing structure, also built on the work of Kallio (1987), but which has a significantly higher level of complexity, is the GLOBIOM model. The GLOBIOM has both wider system boundaries and a time dimension. It is continuously enhanced by the GLOBIOM team at the International Institute for Applied Systems Analysis (IIASA), and continually provides important scenario analyses on, for instance, the impacts of global land use change (e.g. IIASA Citation2015; Lauri et al. Citation2017). This model’s drawback is however its complexity and the lack of transparency. With many things happening at the same time, discernment between a valid output and an output including an error somewhere in the model, becomes difficult. What GLOBIOM wins in accuracy from covering geographical area, it loses in country-level supply chain disaggregation. SFSTM II provides great disaggregation of the Swedish forest raw material market at the expense of, e.g. path assessments, which we argue is not the essence of this study.
Trømborg & Solberg (Citation1995) developed a national forest sector partial equilibrium model for Norway, also built on Kallio’s modeling structure from 1987, and is very similar to the SFSTM II. The Norwegian model has been improved in several stages, of which the latest version is called the NTM II and is highly sophisticated. See Bolkesjo et al. (Citation2005) for an application of reduced harvest for forest conservation purposes in Norway using the NTM II, and Trømborg et al. (Citation2013) for an application of second generation biofuels (the results of these studies are discussed in the light of our simulated results in Section 5). Even though they predict dynamic scenarios, the model is static in the regard to the optimization. It is a static but multi-periodic model, implying that the model is solved for one period and the solution for that period is used for updating data for the next period. Similar to the SFSTM II, there is no adjustment time within an optimization. This approach would be a natural next-step improvement for the SFSTM II in order to provide dynamic simulations for policy targets that are implemented over a period of time.
Furthermore, different policy designs (achieving the same underlying targets) may affect the markets in different ways. In this paper, no specific policy design has been assessed, rather exogenous interventions (targets). Nevertheless, the analysis in the paper, we argue, should provide a useful point of departure for such policy analyses.
Scenarios
The baseline scenario
The baseline scenario comprises simulated production, trade etc. for the year 2016, calibrated with 2016 data. The baseline scenario thus reflects the Swedish forest raw materials market when neither additional demand for bioenergy in the HP sector, nor any harvest restrictions have been implemented in the model.
Although the model does not describe the global markets for forest raw materials in any detail, it is necessary to briefly address how imports are addressed in the analysis. World demand for pellets and other forest fuels are increasing. Between 2012 and 2016, EU imports of wood pellets from non-EU countries increased by almost 80% (reaching almost 8 billion tons) (Eurostat Citation2018). With current policies, this development is expected to continue (Balan et al. Citation2013), and increased world competition is expected to drive up forest biomass feedstock prices (Johnston and van Kooten Citation2016; Jonsson and Rinaldi Citation2017). Thus, it is unrealistic to assume that all countries could satisfy an increased domestic demand for biomass feedstock with increased imports from other countries. For this reason, the import levels in all scenarios, including the baseline, are constrained to 2016 levels. In 2016, the observed net-import level of pellets in Sweden was 40 thousand tons, and imports of wood chips, particles and residues amounted to 1.8 million m3 (FAO Statistics Citation2018). Because neither pellets nor by-product imports are strictly monitored, the level of pellets imports is allowed to increase up to 50 thousand tons and the corresponding levels for wood chips, particles and residues up to 2 million m3 in the model runs.
All scenarios are investigated ceteris paribus, meaning that the only external changes included in the model (compared to the baseline) are the policy scenarios, i.e. we do not account for the probability of external events such as natural hazards, neither globally nor domestically.
Policy scenarios: bioenergy demand targets and harvest restrictions
In addition to the baseline scenario in which 92 TWh bioenergy HP is produced, eight scenarios are investigated. These are presented in . Scenarios 1.1–1.2 involve two HP bioenergy demand targets: 15 TWh and 30TWh above the baseline of 92 TWh, or 107 and 122 TWh respectively (and assuming harvest levels to be constant at the 2016 levels). Scenarios 2.1 and 3.1 address a 5% and a 20% reduction in roundwood harvest levels compared to 2016 levels (assuming 2016 HP bioenergy levels of 92TWh), while scenarios 2.2–2.3 and 3.2–3.3 address the presence of combined bioenergy demand targets (the additional 15 and 30 TWh) and reduced harvest levels (by 5 and 20%, respectively). For assessing increased forest conservation scenarios we use current harvest levels as a baseline. The approach is similar to, e.g. Bolkesjo et al. (Citation2005). It is not a perfect translation of reality and many nuances are missed regarding forest conservation (harvest techniques, etc.). As previously mentioned in Section 3.4, the reason for keeping the definition of conservation simple is to reduce the complexity enough to allow for a disaggregated analysis of the market.
Table 1. Overview of scenarios.
The share of reduced harvest is assumed to be equal across regions and tree species, thus implying higher absolute decreases in the forest-rich regions. In the model, regional demand for HP is estimated based on population density. However, since the exact location of future HP bioenergy demand is unknown, the assumed demand targets are implemented on a national scale. In other words, the conversion of forest raw materials in the HP sector may take place in any of the four domestic regions.
If conservation is increased in a geographical area where there is no economic desire to manage the forest, there should be no conflict. That is a possibility. However, as noted above, it is well known that there is an ongoing conflict between forest owners and advocates for biodiversity in Sweden (Pedroli et al. Citation2013; Lindahl et al. Citation2017), implying that the “normal situation” tends to involve a clear trade-off between conservation and production. Clearly, though, this does not imply that there is a conflict in all geographical contexts.
Simulation results
Bioenergy demand targets
Increased demand for bioenergy in the HP sector implies an increased use of eligible feedstock for such an increase, i.e. forest industry by-products (raw or processed to pellets) and/or harvesting residues. Prices of industry by-products, pellets and harvesting residues increased with additional HP bioenergy production, and more intensely so for the higher target (30 TWh). The relative price of sawdust increased the most, something which can be explained by a strong increase in the demand for sawdust (see further below).
The production of pellets tripled in the presence of 30 TWh additional HP bioenergy, and there was a significant increase in price. The price increase of pellets was however less sharp than that for the by-products. This is due to a relative high baseline price (world market price for pellets) and the diversification of feedstocks in pellet production. Sawdust (and a small amount of wood chips) is used to produce pellets in the baseline scenario. However, when pellet production increased and the sawdust price increased, the pellets industry shifted away from mainly using sawdust to wood chips and bark. Only very small amounts of bark were used in the baseline scenario, but this feedstock became competitive following the increase in the prices of sawdust and wood chips.
A similar feedstock shift was observed in the HP sector (). The total amount of energy production in the HP sector was constant across the various scenarios (i.e. based on the assumption of a fully own-price inelastic demand) and equals 100 TWh.4FFootnote6 Introducing demand targets for HP bioenergy therefore implied a decreased use of fossil fuels (gray bars to the left in ), and an increased use of forest biomass.
Figure 2. Feedstock composition in the HP sector (TWh). Baseline fossil fuel use is shown in dark gray, 15 TWh target in middle gray, and 30 TWh in light gray.
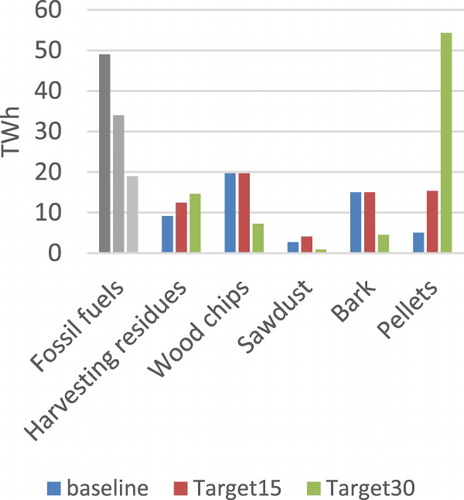
Our simulations showed that the HP bioenergy targets are mainly satisfied with an increased use of pellets but also harvesting residues. The declines in wood chips, sawdust and bark use that can be observed in do not represent actual declines in the use of forest raw materials; they rather indicate a re-allocation of forest raw materials from, for instance, sawdust to processed sawdust in the form of pellets. This can be explained by the efficiency gains from reduced transport costs; raw materials are bulky and have a lower calorific value compared to pellets. For increased HP bioenergy (which cannot be traded across region), transport distances are increasing and pellets increase in demand. The remaining simulation outputs for sub-sections 4.1–4.2 are discussed below but not shown with figures due to space limitations.
Our simulation results suggest that production of paper production decline by 8% in the presence of the 30 TWh target, and all board (i.e. fiberboard, particleboard and plywood board) production shut down already with the implementation of the 15 TWh target. With decreased production in the board industry, demand for pulpwood decreased, and therefore also the price of pulpwood.
Although harvest is restricted to 2016 levels, we observed a small (insignificant) increase in sawnwood production. This was made possible due to a small under-utilization of roundwood imports in the baseline scenario. However, if harvests were not restricted to 2016 levels, but could increase with increasing demand, sawnwood production is likely to have increased in response to increased profitability from supplying forest industry by-products. The sawnwood industries compete for the available sawlogs, and the price of sawlogs increased from 37 to 98 EUR/m3.
In conclusion, the simulated results suggest that increasing HP bioenergy causes an increased use of all forest biomass feedstocks available to the HP sector. The use of pellets (processed sawdust, wood chips and bark) increased the most, but there was also a modest increase in the use of harvesting residues. The competition for sawlogs increased, but decreased for pulpwood. The simulated results suggested that all board industries shut down in the presence of a 15 TWh increase in HP bioenergy. In other words, the study suggests that the increased competition for sawdust from the HP sector raises the price of this feedstock, in turn making board production unprofitable in Sweden.
Increased forest conservation
Increased forest conservation implies reduced harvest of roundwood, i.e. sawlogs, pulpwood and harvesting residues. This sub-section compares feedstock prices and feedstock composition for three scenarios: the baseline scenario, reduced harvest by 5% and reduced harvest by 20%. The demand for forest biomass in the HP sector is assumed to be constant at the 2016 levels.
We found that all by-product prices and forest residues decreased for a harvest reduction of 5%. The prices of wood chips and bark remained at the new lower levels also in the presence of a 20% decrease, the price of harvesting residues continued to fall, whereas the price of sawdust increased (but was still lower than in the baseline scenario). The price decrease for forest industry by-products and harvesting residues, respectively, appear unexpected since the competition for forest raw materials should become more intense with more forest conservation. We found that with reduced roundwood harvest, all forest industries decreased their production; sawnwood production decreased by 6%, the production of paper products by 4% and, not least, particleboard production by 43%. This is an expected result since sawnwood production has to decrease with reduced sawlog harvest levels and paper production has to decrease with reduced pulpwood harvest – paper is produced from mechanical and chemical pulp, which is produced mainly from pulpwood (and recovered paper).
The other feedstocks in pulp production are by-products (e.g. wood chips). With reduced pulp production, the demand for by-products decrease. This explains the, at first, unexpected price drop of by-product prices. The same logic goes for the board production; the board industry uses by-products as input, but also pulpwood. With increasing pulpwood prices, we found that the board industry reduced (and even halted) its production, and as a result sawdust was less in demand. Thus, decreasing production of pulp (intermediate product in paper production) and board products was shown to cause a price fall for by-products. The price of sawdust decreased for a 5% harvest reduction. The board production continued to decrease with increased forest conservation, but due to increased competition for available feedstock when also sawnwood production decreased, the price drop was less significant in the 20% harvest reduction scenario.
The harvest of forest residues decreased (proportionally to the decline in roundwood harvest) and the price of harvesting residues decreased. The price drop for harvesting residues is a response to the price drop for by-products; the HP sector prefers the industrial by-products over harvesting residues due to calorific values and conversion costs. For this reason, the lower prices of by-products make harvesting residues redundant, something which in turn caused the price of harvesting residues to drop. In the case of a 20% harvest reduction, the HP sector used a little less harvesting residues (1.35 TWh), the decrease was replaced by sawdust (0.95 TWh) and wood chips (0.40 TWh).
Bioenergy demand targets combined with forest conservation
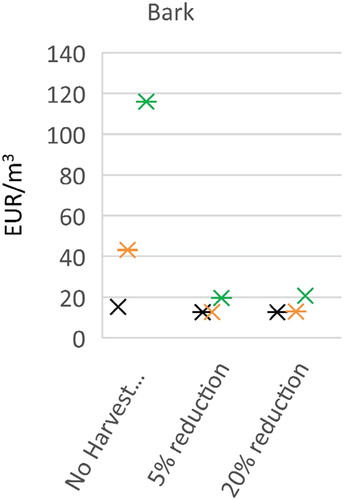
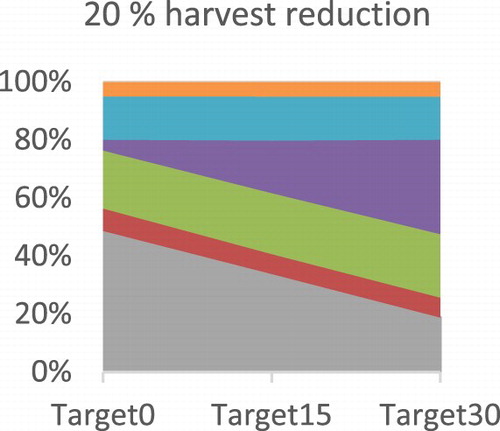
This sub-section investigates the forest raw material market effects from introducing bioenergy demand targets in combination with increased forest conservation. The simulated forest industry by-product prices are shown in . The colors refer to the additional bioenergy demand, and the x-axes represent the forest conservation in terms of reduced harvest levels. As discussed above, an increase in the demand for forest biomass in the HP sector caused sharp price increases for forest industry by-products, while solely reducing harvest levels instead generated moderate price decreases due to declined forest industry production. In the mixed scenarios in which HP bioenergy targets were introduced under harvest restrictions, the increases in by-product prices are more moderate compared to the scenario without any harvest restrictions. As shown in , the price of sawdust increased sharply for increased forest biomass in the HP sector under no harvest restriction (almost to 130 EUR/m3), but this increase is less sharp in the 5% and 20% harvest reduction cases (below 20 EUR/m3). Since by-products are substitutes in the HP sector (and to some extent also in the forest industries), the prices of by-products have similar price developments. The by-product price increases are dampened by the reduced competition for these feedstocks as the forest industries decrease their production due to reduced available roundwood and increases in the roundwood prices.
Figure 3. The price of sawdust (EUR/m3) in scenarios of increased HP bioenergy and reduced harvest.
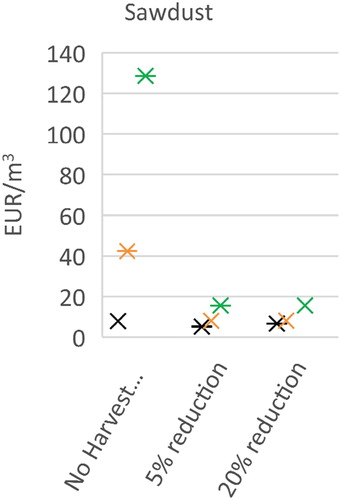
Figure 4. The price of wood chips (EUR/m3) in scenarios of increased HP bioenergy and reduced harvest.
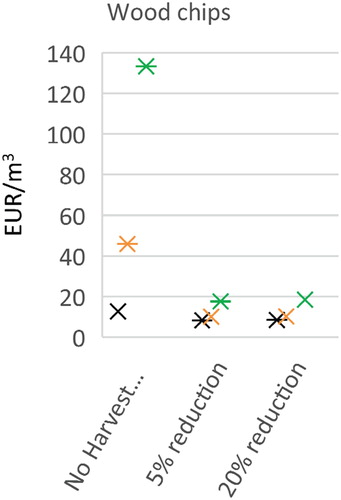
Figure 5. The price of bark (EUR/m3) in scenarios of increased HP bioenergy and reduced harvest.
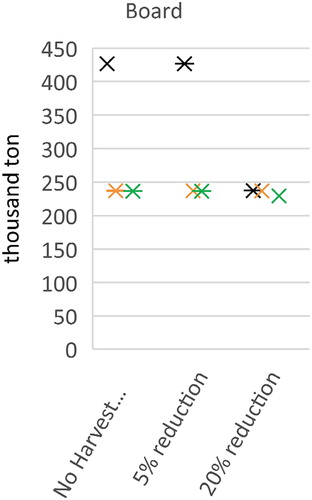
Simulated forest industry production levels are shown in . Whereas sawnwood production is pushed up in the increased HP bioenergy scenario for no harvest reduction5FFootnote7, sawnwood production decreased significantly when introducing HP bioenergy targets under reduced roundwood harvest, simply due to lack of inputs (decreased sawlog harvest). Paper production is in general decreasing under increased HP bioenergy production due to a tightened competition for by-products. Introducing the 5% harvest restriction does not affect this pattern. However, in the 20% harvest reduction scenario, more paper production is observed for all levels of HP bioenergy compared to the no harvest restriction and the 5% harvest reduction scenarios. These increases are at the expense of the board industry, which shrinked to low levels already for no additional HP bioenergy in the 20% harvest reduction scenario (shown in ).
Figure 6. Sawnwood production (million m3) in scenarios of increased HP bioenergy and reduced harvest.
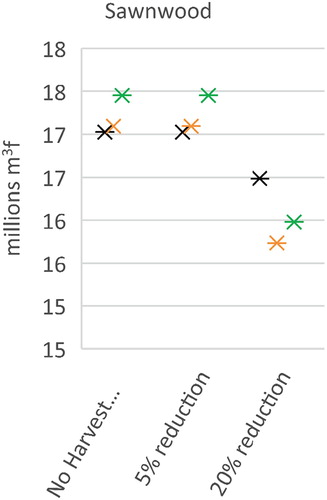
Figure 7. Paper production (million tons) in scenarios of in-creased HP bioenergy and reduced harvest.
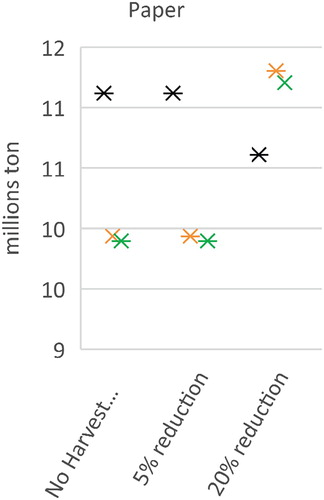
Figure 8. Board production, particle board, fiberboard and plywood aggregated, (thousand tons) in scenarios of increased HP bioenergy and reduced harvest.
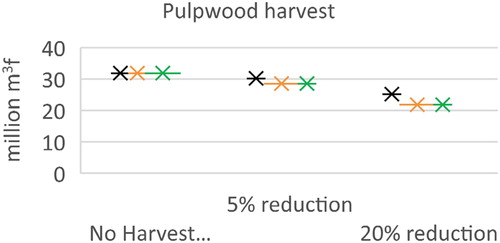
In addition to the imposed harvest restrictions, increasing HP bioenergy demand under increased forest conservation is in this study shown to cause additional reductions in harvest levels ( and ). When introducing the HP bioenergy demand targets, the required 5% harvest reduction leads to a 10% harvest reduction, and the 20% reduction leads to a corresponding 31% decrease. The additional reduction in roundwood harvest can be explained by a reduced demand for roundwood as a response to higher roundwood prices caused by the initial roundwood supply reduction.
Figure 9. Sawlog harvest (million m3f) in scenarios of increased HP bioenergy and reduced harvest.
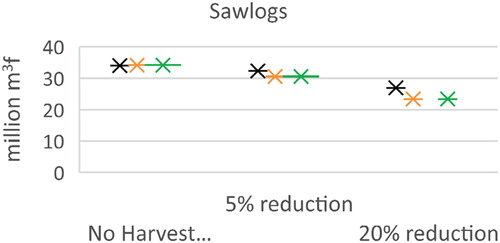
Figure 10. Pulpwood harvest (million m3f) in scen arios of increased HP bioenergy and reduced harvest.
The feedstock composition for increased bioenergy in the HP sector seems to differ substantially between the baseline scenario (), and the scenarios with harvest restrictions ( and ).
Figure 11. Feedstock composition in the HP sector under 2016 harvest levels.
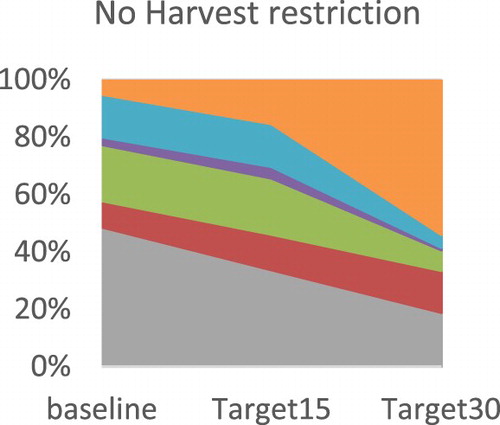
Figure 12. Feedstock composition in the HP sector under the minus 5% harvest scenario.
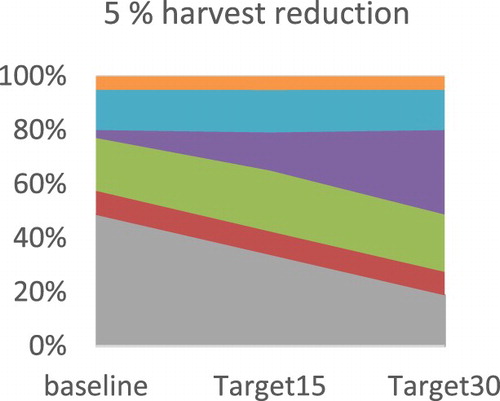
Figure 13. Feedstock composition in the HP sector under the minus 20% harvest scenario.
The use of sawdust increased significantly with increased HP bioenergy targets in the case where there are no harvest restrictions (), but it is constant in the scenarios with reduced harvest. In contrast, as more stringent forest conservation policies are implemented, the use of pellets instead increases substantially in the HP sector ( and ). However, sawdust is also the major input in producing pellets, and for this reason the feedstock composition is practically very similar across harvest levels. The key difference lies instead in whether the sawdust feedstock is processed to pellets or not. Pellets is generally cheaper to transport than sawdust due to its higher energy content per ton, but it does come with an intermediate production cost. When feedstock demand is being increased under harvest restrictions, feedstocks tend to be transported for longer distances, and this makes the processing of sawdust to pellets more economical.
The results suggest that increased bioenergy targets in the HP sector causes the use of harvesting residues to increase in the No Harvest reduction scenario due to a relative price decrease compared to forest industry by-products (). This effect is not equally present in the reduced harvest scenarios due to the decreased supply of harvesting residues, i.e. the decreased relative price difference found in the No harvest reduction scenario is canceled out in the scenarios with harvest reductions due to reduced supply of harvesting residues, and corresponding price increases.
Discussion
An increased demand for forest raw materials following the introduction of HP bioenergy targets is expected to lead to increased competition for forest raw materials and push up feedstock prices (Söderholm and Lundmark Citation2009); for empirical evidence, see e.g. Carlsson (Citation2011). Furthermore, the increase in forest industry by-product prices could spur sawmills to increase production due to increased returns on by-products, and therefore an expansion of bioenergy production is likely to create winners –sawmills due to increased return on by-products, and losers – pulp and paper industries due to increased input prices (Schwarzbauer and Stern Citation2010; Trømborg et al. Citation2013; Lauri et al. Citation2017). In the present paper, sawmills cannot increase their production due to implemented restrictions on harvest (and imports), and the synergy effects between sawmills and HP bioenergy production are absent, and thus higher by-product prices cannot be mitigated by increased by-product supply. Thus, considerable by-product price increases were expected, and the industries demanding these products were expected to be negatively affected.
This study confirms this course of events in the scenarios for which only HP bioenergy is increased, but for the scenarios in which the HP bioenergy increases are introduced in combination with reduced roundwood harvest, the results display a more complex course of events. The expected losing industries are indeed losing, yet they are losing so much that the by-product price increase is mitigated. Thus, the results in our study suggest that all forest industries are worse off in the case where bioenergy targets and forest conservation policies are introduced simultaneously, but the HP sector is actually better off due to reduced competition from forest industries. The structural transformations caused by HP bioenergy policies is found both in the scenario with current harvest levels and under reduced harvest. Thus, reducing forest harvest levels does not seem to fundamentally affect the outcome of the structural transformation caused by the HP bioenergy policy intervention.
In previous studies, increased forest conservation in Norway and Finland has been shown to lead to reduced sawnwood production (Bolkesjo et al. Citation2005; Hanninen and Kallio Citation2007); a finding which is confirmed also in this paper for Sweden. Similar to Bolkesjo et al. (Citation2005) and Hanninen and Kallio (Citation2007), the present paper observes increased pulpwood prices with increased forest conservation. However, unlike the present paper, Bolkesjo et al. (Citation2005) and Hanninen and Kallio (Citation2007) find that pulpwood price increases do not affect paper and board production; Bolkesjo et al. (Citation2005) find that most pulp and paper mills continue to produce on the capacity limit as a result of other factors in the production decision besides the input prices, e.g. price and income sensitivities, demand of forest products demand and current production capacities.
This outcome difference can be explained by differences in model assumptions, national factors and modeling design (e.g. domestic demand, elasticities, initial production levels, substitution possibilities, etc.). For instance, unlike Finland and Norway, Sweden does not produce paper and board products at its production limits in the baseline scenario. Rather, Sweden has experienced a continuous decrease in production in some of its forest industries during the past ten years, especially in the board industries due to increased feedstock competition with the HP sector. Moreover, whereas the present study adopts strict import restrictions, the Finnish study allows 30% of the decline in domestic harvests to be substituted with imports from other countries (Hanninen and Kallio Citation2007). The present study also adopts more aggressive conservation scenarios; at most, 20% of Sweden’s roundwood harvest is reduced; Bolkesjo et al. (Citation2005) assume at most a forest conservation of 12%, and Hanninen and Kallio (Citation2007) at most a 5% forest conservation for one particular region with old-grown forest in Finland. The differences between these studies regarding the simulated outcome of the national pulp and paper sectors shed light on the importance of considering countries’ different markets, as well as on the fact that caution is preferable when it comes to comparing the modeling outcomes across studies.
Dixon et al. (Citation2013) found that the combination of two EU policies, one promoting bioenergy and the other promoting forest conservation, would lead to increased food prices in economically vulnerable countries due to increased land prices. The present paper shows mitigated feedstock price increases in the scenario for which the policies are introduced simultaneously. The different results are due to several factors. First, Dixon et al. (Citation2013) assess an increased use of first generation biofuels for which food prices and bioenergy are linked via the competition for land. In the present paper, the land will only grow forest, but the biomass allocation may change due to changes in demand and price formation. Some industries were shown to disappear, which causes more modest price increases. However, food consumption cannot cease (assuming limited possibilities to import food in developing countries), and thus in the Dixon et al. case, prices therefore continue to be pushed upwards.
Furthermore, Dixon et al. (Citation2013) assess policies assumed to be implemented at the EU level, and therefore the policies could be expected to affect world market prices. The inclusion of several countries allows for assessments of the impact of changing world market prices. The present paper assesses one country’s market under nationally implemented policies. Alone, these policy interventions cannot be expected to affect world market prices. Nevertheless, in a scenario in which also other countries (e.g. the EU Member States) would implement similar bioenergy and forest conservation policies as assumed for Sweden in this paper, a different outcome would be expected. In the long run, increasing product prices could lead to structural transformation in which paper and board products are replaced by new materials, more advanced recycling or new technology – these are all possible developments that are difficult to fully capture in partial equilibrium modeling.
At a general level, the HP sector can choose between using fossil fuels and biomass. In the baseline scenario, forest biomass is cheaper than fossil fuels, and it is therefore the natural choice of feedstock. However, with increasing forest biomass prices caused by increased competition or reduced supply, the feedstock composition is not given. Geijer et al. (Citation2011) found that the forest conservation policy aiming at reducing GHG emissions in Sweden could actually lead to increased GHG emissions, this due to a substitution away from forest biomass to fossil fuels in the HP sector. The present paper shows that reducing harvest levels by 20% (and no targets for bioenergy demand) does not affect the shares of fossil fuel and biomass use in the HP sector. This can be explained by the larger price difference between fossil fuels and biomass in Sweden compared to Norway, due to Sweden’s higher carbon dioxide tax. Accompanied by, for instance, Geijer et al. (Citation2011), this paper sheds light on the forest raw material market’s complexity under policy interventions.
As discussed in Section 3.4, complex policies are boiled down to its core assessed through demand and supply constraints, meaning that there is no policy design assessed (e.g. a tax, subsidy, quota). The choice of policy design can create unforeseeable incentives in the market that are not assessed in this study, and therefore complementing studies would have to be carried out to fully understand the implications from implementing these two policies. Moreover, it is also important to bear in mind that the forest conservation scenarios in this study are based on total estimates of necessary harvest reductions to reach the national biodiversity targets; it does not distinguish between forest locations, harvesting techniques etc. For instance, forest closer to populated areas are often given a higher recreation value. An assessment of conserving that forest could lead to increased transport costs of raw materials, which in that case could have added to price increases, suggesting that the current simulated results would be biased downwards. On the other hand, this study allows only forest biomass to satisfy the bioenergy targets, although HP bioenergy facilitates could potentially use other feedstocks. If other feedstocks such as short-rotation forest, switchgrass, or various waste products, would have been allowed in the simulations, the upward price pressure on forest biomass would most likely have been mitigated, suggesting that the current simulated results would be biased upwards.
The policy interventions assessed in this paper are built upon policies motivated by market failures (i.e. lack of a market price for biodiversity, the external cost of carbon emissions from the use of fossil fuels, etc.). The results in this paper display that the assessed policy targets lead to an increased competition for forest raw materials, and eventually even shut-downs in the board industries. Increased competition following an internalization of market failures is not in itself a result of inefficient markets, and thus something that motivates further policy interventions. Still, for an efficient policy implementation in the case of climate change and forest conservation, the policy targets have to be well adapted to the underlying market failures. The question of whether the existing policies achieve this, is beyond the scope of this paper, but it constitutes an important issue for future research.
Conclusions and avenues for future research
The present paper has assessed the forest raw material market impacts of a possible continuation of the so-called “more of everything” forest management strategy in Sweden. Specifically, the paper has addressed the question of how two different policies – both implying an increased demand for forest ecosystem services – may affect the competition for various types of forest raw materials.
We find that promoting bioenergy and forest conservation tends to have partly opposite effects on forest industry by-product prices. Moreover, the study finds that combining the two policies reduces the forest industry by-product price increases, this compared to the case where only the bioenergy-promoting policy is implemented. For this reason, our study suggests that, the HP sector could be less negatively affected in terms of increased feedstock prices if bioenergy demand targets are accompanied by increased forest conservation. This is due to increasing pulpwood prices, which reduce pulp, paper and board production, in turn partly mitigating the competition for forest industry by-products. Notably, the study also predicts a shutdown of the domestic board industry, due to the increased by-product prices. Overall, the paper illustrates the complexity of the forest raw material market, and the importance of considering demand and supply responses within and between sectors when designing and implementing future energy and forest policies.
Future developments, including demand for forest industry products (pulp and paper or green chemicals), demand for energy (development of smart building, transport fuels, etc.), and needs for forest conservation, are all uncertain variables. Also, with climate change, the supply of forest raw material is expected to become more uncertain. In addition to the increasing prevalence and severity of forest wildfires, also droughts and bark beetle damages are predicted to increase in the future. Such events’ impact on the forest raw material market are interesting to study in itself, but perhaps even more so in relation to climate mitigating policies, e.g. bioenergy targets (which can utilize salvaged wood), and forest conservation (forest wildfires can work both for and against biodiversity). Due to the multiple price phases after a natural hazard, such analysis would be greatly helped by a time dimension in the model. We encourage this kind of future research, both to incorporate a time dimension into a model such as the SFSTM II, as well as to study scenarios of natural hazards in combination with policy goals. A time dimension would also allow for policy assessments of policies implemented over time, while considering different scenarios for, for instance, the oil price development.
At a general level, this paper has highlighted the importance of considering price formation in forest biomass markets when developing forest policies. Depending on the policy design, and the combination of policies, competition for raw materials can lead to different outcomes including synergy effects and structural changes. Future research should therefore devote increased attention to the issue of policy design, and how various designs affect the forest raw materials markets given their complex interactions.
Acknowledgments
The work has been carried out under the auspices of Forskarskola Energisystem, financed by the Swedish Energy Agency. The author thanks Patrik Söderholm at Luleå University of Technology and two anonymous reviewers, who all have provided insight and expertise that greatly assisted the research. Any remaining errors, though, reside solely with the author.
Disclosure statement
No potential conflict of interest was reported by the author(s).
Correction Statement
This article has been republished with minor changes. These changes do not impact the academic content of the article.
Additional information
Funding
Notes
1 It should however be emphasized that this study does not account for other types of ecosystem services, such as carbon storage in forest biomass.
2 Actors in the forest raw material market may possess some degree of market power, often pulp mills due to large sunk costs (Murray Citation1995). However, with increasing international trade, market power is expected to decrease, i.e., the law of one price will kick in. Indications of such developments are found in the global pulpwood market (Olmos and Siry Citation2015), and in the roundwood markets (Olmos and Siry Citation2018; Toivonen et al. Citation2002).
3 Our definition of ROW includes the EU Member States and Norway.
4 These types of price changes could be studied if the model had a sophisticated dynamic dimension; multiple static optimizations, as discussed later in Section 3.4, would not be sufficient as they identify a new equilibrium instantly.
5 This cost is annualized with a factor σ = 0.08, which is equivalent to a 5% interest rate and a production plant lifetime of 20 years. For a more in-depth explanation of the model’s equations, elasticities assumed, etc., see Carlsson (Citation2011).
6 The forest industries’ internal use of black liquor to produce electricity and heat is excluded from the analysis.
7 As noted above, this is possible due to a small under-utilization of roundwood imports in the baseline scenario.
References
- Ambjornsson E, Keskitalo ECH, Karlsson S. 2016. Forest discourses and the role of planning-related perspectives: the case of Sweden. Scand J Forest Res. 31(1):111–118. doi: 10.1080/02827581.2015.1070197
- Balan V, Chiaramonti D, Kumar S. 2013. Review of US and EU initiatives toward development, demonstration, and commercialization of lignocellulosic biofuels. Biofuel Bioprod Bior. 7:732–759. doi: 10.1002/bbb.1436
- Bhutto AW, Qureshi K, Abro R, Harijan K, Zhao Z, Bazmi AA, Abbas T, Yu G. 2016. Progress in the production of biomass-to-liquid biofuels to decarbonize the transport sector - prospects and challenges. RSC Adv. 6:32140–32170. doi: 10.1039/C5RA26459F
- Bolkesjo TF, Tromborg E, Solberg B. 2005. Increasing forest conservation in Norway: consequences for timber and forest products markets. Environ Resour Econ (Dordr). 31:95–115. doi: 10.1007/s10640-004-8248-0
- Börjesson P, Hansson J, Berndes G. 2017. Future demand for forest-based biomass for energy purposes in Sweden. For Ecol Manag. 383:17–26. doi: 10.1016/j.foreco.2016.09.018
- Bryngemark E. 2019a. The competition for forest raw materials in the presence of increased bioenergy demand: partial equilibrium analysis of the Swedish case. Licentiate thesis ISBN: 978-91-7790-299-7.
- Bryngemark E. 2019b. Second generation biofuels and the competition for forest raw materials: a partial equilibrium analysis of Sweden. Forest Policy Econ. 109(Article Number: 102022).
- Carlsson M. 2011. Bioenergy from the Swedish Forest Sector A Partial Equilibrium Analysis of Supply Costs and Implications for the Forest Product Markets. Swedish University of Agricultural Sciences, Department of Economics, Uppsala, Sweden, Working Paper Series 2012:03.
- Carmenza RA, Hans-Jörg A, Göran B, Simon B, Esteve C, Felix C, John GU, Anna G, S. GJ, Helmut H, et al. 2017. Bioenergy production and sustainable development: science base for policymaking remains limited. GCB Bioenerg. 9:541–556. doi: 10.1111/gcbb.12338
- de Bikuna KS, Garcia R, Dias AC, Freire F. 2020. Global warming implications from increased forest biomass utilization for bioenergy in a supply-constrained context. J Environ Manag. 263(Article Number: 110292).
- de Jonga J, Akselsson C, Egnell G, Löfgren S, Olsson BA. 2017. Realizing the energy potential of forest biomass in Sweden - how much is environmentally sustainable? For Ecol Manag. 383(SI):3–16. doi: 10.1016/j.foreco.2016.06.028
- Directive 2009/28/EC of the European Parliament and of the Council of 23 April 2009 on the promotion of the use of energy from renewable sources and amending and subsequently repealing Directives 2001/77/EC and 2003/30/EC. Brussels: European Union.
- Dixon P, Meijl HV, Rimmer M, Shutes L, Tabeau aA. 2013. RED vs. REDD: biofuel policy vs. forest conservation. Centre for European Policy Studies (CEPS), 1 Place du Congrès, 1000 Brussels, Belgium.
- Duit A, Lof A. 2018. Dealing with a wicked problem? A dark tale of carnivore management in Sweden 2007–2011. Adm Soc. 50(8):1072–1096. doi: 10.1177/0095399715595668
- EC. 2012. Innovating for sustainable growth a bioeconomy for Europe, European Commission.
- Eckerberg K, Buizer M. 2017. Promises and dilemmas in forest fire management decision-making: Exploring conditions for community engagement in Australia and Sweden. Forest Policy Econ. 80:133–140. doi: 10.1016/j.forpol.2017.03.020
- Ericsson K, Werner S. 2016. The introduction and expansion of biomass use in Swedish district heating systems. Biomass Bioenergy. 94:57–65. doi: 10.1016/j.biombioe.2016.08.011
- EU 10308/18. 2018. Proposal for a Directive of the European Parliament and of the Council on the promotion of the use of energy from renewable sources - Analysis of the final compromise text with a view to agreement, Council of the European Union, Brussels. http://data.consilium.europa.eu/doc/document/ST-10308-2018-INIT/en/pdf.
- Eurostat. 2018. Variable code group “for_basic”. http://appsso.eurostat.ec.europa.eu/nui/submitViewTableAction.do.
- FAO Statistics. 2018. The Food and Agriculture Organization (FAO). http://www.fao.org/faostat/en/.
- Felton A, Lofroth T, Angelstam P, Gustafsson L, Hjalten J,M, Simonsson P, Dahlberg A, Lindbladh M, Svensson J, Nilsson U, et al. 2020. Keeping pace with forestry: multi-scale conservation in a changing production forest matrix. AMBIO. 49(5):1050–1064. doi:10.1007/s13280-019-01248-0.
- Gasparatos A, Doll CNH, Esteban M, Ahmed A, Olang TA. 2017. Renewable energy and biodiversity: implications for transitioning to a green economy. Renewable Sustainable Energy Rev. 70:161–184. doi: 10.1016/j.rser.2016.08.030
- Geijer E, Bostedt G, Brännlund R. 2011. Damned if you do, damned if you do not—reduced climate impact vs. sustainable forests in Sweden. Resour Energy Econ. 33:94–106. doi: 10.1016/j.reseneeco.2010.01.004
- Government Bill 2008/09:162. 2008. En sammanhållen klimat- och energipolitik - Klimat (transl. An integrated climate and energy policy), Swedish Government.
- Government Bill 2013/14:141. En svensk strategi för biologisk mångfald och ekosystemtjänster (transl. A Swedish strategy for biodiversity and eco-system services), Swedish Government.
- Gustafsson MS, Myhren JA, Dotzauer E. 2018. Potential for district heating to lower peak electricity demand in a medium-size municipality in Sweden. J Cleaner Prod. 186:1–9. doi: 10.1016/j.jclepro.2018.03.038
- Hallberg-Sramek I, Bjärstig T, Nordin A. 2020. Framing woodland key habitats in the Swedish media – how has the framing changed over time? Scand J Forest Res. 35(3-4):198–209. https://doi.org/10.1080/02827581.2020.1761444.
- Hammar T, Stendahl J, Sundberg C, Holmström H, Hansson PA. 2019. Climate impact and energy efficiency of woody bioenergy systems from a landscape perspective. Biomass Bioenergy. 120:189–199. doi: 10.1016/j.biombioe.2018.11.026
- Hanninen R, Kallio AMI. 2007. Economic impacts on the forest sector of increasing forest biodiversity conservation in Finland. Silva Fenn. 41:507–523.
- Henkens P, van Keulen H. 2001. Mineral policy in the Netherlands and nitrate policy within the European Community. Neth J Agric Sci. 49:117–134.
- Henle K, Alard D, Clitherow J, Cobb P, Firbank L, Kull T, McCracken D, Moritz RFA, Niemelae J, Rebane M, Wascher D. 2008. Identifying and managing the conflicts between agriculture and biodiversity conservation in Europe - A review. Agric Ecosyst Environ. 124:60–71. doi: 10.1016/j.agee.2007.09.005
- Hobbs NT, Andren H, Persson J, Aronsson M, Chapron G. 2012. Native predators reduce harvest of reindeer by Sami Pastoralists. Ecol Appl. 22(5):1640–1654. doi: 10.1890/11-1309.1
- IIASA. 2015. The Land Use Change Impact of Biofuels Consumed in the EU Quantification of Area and Greenhouse Gas Impacts. https://ec.europa.eu/energy/sites/ener/files/documents/Final Report_GLOBIOM_publication.pdf.
- Johnston CMT, van Kooten GC. 2016. Global trade impacts of increasing Europe's bioenergy demand. J Forest Econ. 23:27–44. doi: 10.1016/j.jfe.2015.11.001
- Jonsson R, Rinaldi F. 2017. The impact on global wood-product markets of increasing consumption of wood pellets within the European Union. Energy. 133:864–878. doi: 10.1016/j.energy.2017.05.178
- Kallio M, Dykstra DP, Binkley CS. 1987. The global forest sector: an analytical perspective. New York, NY: John Wiley and Sons Inc.
- Kallio M, Moiseyev A, Solberg B. 2004. The Global Forest Sector Model – The Model Structure. http://www.efi.int/files/attachments/publications/ir_15.pdf.
- Kallio AMI, Solberg B, Käär L, Päivinen R. 2018. Economic impacts of setting reference levels for the forest carbon sinks in the EU on the European forest sector. Forest Policy Econ. 92:193–201. doi: 10.1016/j.forpol.2018.04.010
- Kleinschmit D, Lindstad BH, Thorsen BH, Toppinen A, Roos A, Baardsen S. 2014. Shades of green: a social scientific view on bioeconomy in the forest sector. Scand J Forest Res. 29(4):402–410. doi: 10.1080/02827581.2014.921722
- Kline KL, Martinelli FS, Mayer AL, Medeiros R, Oliveira COF, Sparovek G, Walter A, Venier LA. 2015. Bioenergy and biodiversity: key lessons from the Pan American Region. Environ Manag. 56:1377–1396. doi: 10.1007/s00267-015-0559-0
- Kroger M, Raitio K. 2017. Finnish forest policy in the era of bioeconomy: a pathway to sustainability? Forest Policy Econ. 77:6–15. doi: 10.1016/j.forpol.2016.12.003
- KSLA. 2015. Forests and Forestry in Sweden. The Royal Swedish Academy of Agriculture and Forestry (KSLA). https://www.skogsstyrelsen.se/globalassets/in-english/forests-and-forestry-in-sweden_2015.pdf.
- Lauri P, Forsell N, Korosuo A, Havlik P, Obersteiner M, Nordin A. 2017. Impact of the 2 degrees C target on global woody biomass use. Forest Policy Econ. 83:121–130. doi: 10.1016/j.forpol.2017.07.005
- Lestander D. 2011. Competition for forest fuels in Sweden - Exploring the possibilities of modeling forest fuel markets in a regional partial equilibrium framework Swedish University of Agricultural Sciences Faculty of Natural Resources and Agricultural Sciences Department of Economics, Uppsala.
- Lindahl KB, Sténs A, Sandström C, Johansson J, Lidskog R, Ranius T, Roberge J-M. 2017. The Swedish forestry model: more of everything? Forest Policy Econ. 77:44–55. doi: 10.1016/j.forpol.2015.10.012
- Mansuy N, Barrette, J., Laganière, J., Mabee, W., Paré, D., Gautam, S., Thiffault, E. and Ghafghazi, S. 2018. Salvage harvesting for bioenergy in Canada: from sustainableand integrated supply chain to climate change mitigation. Review. 7(5).
- McCormick K, Kaberger T. 2005. Exploring a pioneering bioenergy system: The case of Enkoping in Sweden. J Cleaner Prod. 13:1003–1014. doi: 10.1016/j.jclepro.2004.12.011
- Murray BC. 1995. Measuring oligopsony power with shadow prices - US markets for pulpwood and sawlogs. Rev Econ Stat. 77:486–498. doi: 10.2307/2109909
- Mustapha WF, Bolkesjø TF, Martinsen T, Trømborg E. 2017. Techno-economic comparison of promising biofuel conversion pathways in a Nordic context – effects of feedstock costs and technology learning. Energy Convers Manage. 149:368–380. doi: 10.1016/j.enconman.2017.07.004
- Olmos MV, Siry JP. 2018. The law of one price in global coniferous sawlog markets. Silva Fenn. 52.
- Olmos VM, Siry J. 2015. Global pulpwood markets and the law of one price. Math Comput For Nat-Resour Sci. 7:16–32.
- Ostmo L, Law J. 2018. Mis/translation, colonialism, and environmental conflict. Environ Humanit. 10(2):349–369. doi: 10.1215/22011919-7156782
- Ouraich I, Wetterlund E, Forsell N, Lundmark R. 2018. A spatial-explicit price impact analysis of increased biofuel production on forest feedstock markets: a scenario analysis for Sweden. Biomass Bioenergy. 119:364–380. doi: 10.1016/j.biombioe.2018.09.029
- Pedroli B, Elbersen B, Frederiksen P, Grandin U, Heikkilä R, Krogh PH, Izakovičová Z, Johansen A, Meiresonne L, Spijker J. 2013. Is energy cropping in Europe compatible with biodiversity? - Opportunities and threats to biodiversity from land-based production of biomass for bioenergy purposes. Biomass Bioenergy. 55:73–86. doi: 10.1016/j.biombioe.2012.09.054
- Pfenninger S, Hawkes A, Keirstead J. 2014. Energy systems modeling for twenty-first century energy challenges. Renewable Sustainable Energy Rev. 33:74–86. doi: 10.1016/j.rser.2014.02.003
- Samuelsson PA. 1952. patial price equilibrium and linear programming. Am Econ Rev. 42:283–303.
- Sandström C, Carlsson-Kanyama A, Lindahl KB, Sonnek KM, Mossing A, Nordin A, Nordstrom E-M, Raty R. 2016. Understanding consistencies and gaps between desired forest futures: An analysis of visions from stakeholder groups in Sweden. Ambio. 45:S100–S108. doi: 10.1007/s13280-015-0746-5
- SCB. 2018a. Skyddad landareal, ha efter skyddsform och år (transl. protected land by protection type and year), Statistics Sweden.
- Schwarzbauer P, Stern T. 2010. Energy vs. material: economic impacts of a “wood-for-energy scenario” on the forest-based sector in Austria — A simulation approach. Forest Policy Econ. 12:31–38. doi: 10.1016/j.forpol.2009.09.004
- SEA. 2017. Energiläget 2017 i siffror (Transl. The energy state in numbers), Swedish Energy Agency - Energimyndigheten.
- SEA. 2018b. Omvärldsbevakning - biodrivmedelsmarknaden Promemoria rörande biodrivmedelsmarknaden i Sverige och i världen (transl. world outlook - the biofuel market. A report regarding the biofuel market in Sweden and in the world). Swedish Energy Agency. http://www.energimyndigheten.se/globalassets/om-oss/lagesrapporter/biobransle/pm—omvarldsbevakning-biodrivmedelsmarknaden.pdf.
- SEA. 2018c. Total energitillförsel per energivara från och med (transl. total energy supply per source of energy from) 1970. TWh., Swedish Energy Agency - Energimyndigheten. http://www.energimyndigheten.se/en/facts-and-figures/statistics/.
- SEPA. 2012. Sweden's environmental objectives – an introduction, Swedish Environmental Protection Agency.
- SEPA. 2018. Will the Swedish environmental quality objectives be achieved? Summary and assessments from the annual evaluation 2018. The Swedish Environmental Protection Agency, Annual evaluation.
- SEPA. 2020. “https://www.Naturskyddsforeningen.Se/Faq-Om-Skogsbruk.” Hur tycker föreningen att vi bör hantera skogen så att vi tar till vara alla de värden som skogen har? https://www.naturskyddsforeningen.se/faq-om-skogsbruk.
- SFA. 2017. Avrapportering av regeringsuppdrag om frivilliga avsättningar (transl. report regarding volontary forest set-asides). The Swedish Forest Agency, Meddelande.
- SFA. 2018b. Swedish Forest Agency Statistical database, Swedish Forest Agency.
- SFS 1981:599. 1994. Act for design of heating plants for solid fuels (terminated in SFS 1994:793). Stockholm: Swedish Parliament.
- SFS 1990:582. 1990. Lag (1990:582) om koldioxidskatt (transl. carbon tax law). Stockholm: Swedish Government Ministry of Finance.
- Simonsson P, Gustafsson L, Ostlund L. 2015. Retention forestry in Sweden: driving forces, debate and implementation 1968-2003. Scand J Forest Res. 30:154–173. doi: 10.1080/02827581.2014.968201
- Sjölander Lindqvist A, Sandstrom C. 2019. Shaking Hands: Balancing Tensions in the Swedish Forested Landscape. Conserv Soc. 17(4):319–330. doi: 10.4103/cs.cs_18_112
- SLU. 2018. Riksskogstaxeringen Officiell statistik om de svenska skogarna (transl. officiell statistics of the Swedish forests), Swedish University of Agricultural Sciences. https://www.slu.se/riksskogstaxeringen.
- Söderholm P, Lundmark R. 2009. The development of forest-based biorefineries: implications for market behavior and policy. Forest Prod J. 59:6–16.
- SPBI - Svenska Petroleum och Biodrivmedel Institutet. 2018. https://spbi.se/statistik/priser/statistik-priser (transl.“statistics - prices”).
- Swedish Government. 2016. Ett klimatpolitiskt ramverk för Sverige Swedish Government, 2016/17:MJU24.
- Swedish Government. 2018. Sweden’s carbon tax. Government officies of Sweden https://www.government.se/government-policy/taxes-and-tariffs/swedens-carbon-tax/.
- Toivonen R, Toppinen A, Tilli T. 2002. Integration of roundwood markets in Austria, Finland and Sweden. Forest Policy Econ. 4:33–42. doi: 10.1016/S1389-9341(01)00071-5
- Trømborg E, Bolkesjø TF, Solberg B. 2013. Second-generation biofuels: impacts on bioheat production and forest products markets. Int J Energy Sect Manage. 7:383–402. doi: 10.1108/IJESM-03-2013-0001
- Trømborg E, Solberg B. 1995. “Beskrivelse av en partiell likevektsmodell anvendt i prosjektet ‘Modellanalyse av norsk skogsektor’” (“Description of a partial equilibrium model applied in the project ‘Modeling the Norwegian Forest Sector’”), Rapport fra Skogforsk 14/95, p. 34 (in Norwegian).
- Ulonska K, Koenig A, Klatt M, Mitsos A, Viell J. 2018. Optimization of multiproduct biorefinery processes under consideration of biomass supply chain management and market developments. Ind Eng Chem Res. 57:6980–6991. doi: 10.1021/acs.iecr.8b00245
- van der Voorn T, Svenfelt A, Bjornberg KE, Faure E, Milestad R. 2020. Envisioning carbon-free land use futures for Sweden: a scenario study on conflicts and synergies between environmental policy goals. Reg Environ Change. 20(2). doi:10.1007/s10113-020-01618-5.
- von Essen E, Hansen HP. 2015. How stakeholder co-management reproduces conservation conflicts: revealing rationality problems in Swedish wolf conservation. Conserv Soc. 13(4):332–344. doi: 10.4103/0972-4923.179881
- Wuestemann H, Bonn A, Albert C, Bertram C, Biber-Freudenberger L, Dehnhardt A, Doering R, Elsasser P, Hartje V, Mehl D, Kantelhardt J. 2017. Synergies and trade-offs between nature conservation and climate policy: insights from the “Natural Capital Germany - TEEB DE” study. Ecosyst Serv. 24:187–199. doi: 10.1016/j.ecoser.2017.02.008