
 ?Mathematical formulae have been encoded as MathML and are displayed in this HTML version using MathJax in order to improve their display. Uncheck the box to turn MathJax off. This feature requires Javascript. Click on a formula to zoom.
ABSTRACT
The aim of this study was to analyze and compare the performance of Norway spruce seed sources from Swedish stands of East European origin (SweEast) with material from Swedish (SweSO) and East European (EastSO) seed orchards, and with material from Swedish (SweS) and East European (EastS) unimproved stands. The seed sources were field tested at six locations in southern Sweden and assessed for growth and phenology. The assessment of growth traits indicated that trees from SweSO and EastSO had 9–15% greater growth with respect to tree height and diameter in comparison to trees from Swedish local unimproved stands (SweS). Trees from SweEast and EastS showed around 5–7% greater growth. With respect to phenological traits, the expected later bud burst for EastS and EastSO in comparison to SweS, SweSO and SweEast was verified. However, SweEast exhibited earlier bud burst compared to EastS than what could be explained by pollination by Swedish pollen. This was explained by early land race formation for that trait. A strong positive correlation was observed between bud burst and frost damage, which indicates that earlier bud burst does indeed increase the risk of damage from late spring frost at frost-prone sites.
Introduction
In several Nordic countries seed deployment using improved Norway spruce material is often a challenge due to the fact that seed production in seed orchards are sparse or can vary between years (Crain and Cregg Citation2018). To be able to meet the demand for improved material nonnative seeds are usually imported from other countries (Myking et al. Citation2016). In case this is not possible trees with lower performance have to be used which in turn yields lower growth and quality (Liziniewicz and Berlin Citation2019; Haapanen, Citation2020). The nonnative seeds can also be a potential source of nonnative pests, which needs to be considered when importing material from other countries (Franić et al. Citation2019). Another aspect of this is how the climate will change in the future where local trees will not be able to disperse, establish or adapt as fast as needed. To be able to adapt to climate changes assisted migration is needed, where trees with desirable properties are transferred from one place to another (Williams and Dumroese Citation2013; Koralewski et al. Citation2015). For example, Norway spruce seeds from southern regions are moved northward for improved growth rhythm adaptation and performance (Kroon and Rosvall Citation2004).
In Sweden, 348 million seedlings are planted each year (average 2001–2017), and of these, 199 million are Norway spruce (Skogsstyrelsen Citation2019). Genetically improved Norway spruce trees can be deployed to achieve an expected higher performance (genetic gain) in growth and quality compared to unimproved trees. During recent decades seed orchards established before 1990 have been used and give around 10-15% higher genetic gain in growth, but now plant material with higher genetic gain (up to 25%) is starting to become available (Rosvall et al. Citation2001; Remröd et al. Citation2003). For several years there has been a shortage of improved Norway spruce seeds (Almqvist Citation2014) due to poor or no crop production because of irregular flowering by the species (Lindgren et al. Citation1977; Crain and Cregg Citation2018), as well as damage to the seed orchard crops by pests (Almqvist and Rosenberg Citation2016; Capador et al. Citation2018). Historically, in order to counteract the shortage and maintain a high and robust productivity, seeds from different European sources have been imported. Seed sources from eastern Europe have been considered a good alternative in southern Sweden due to their superior performance compared to seed of other provenances (Langlet Citation1960; Persson and Persson Citation1992; Danusevicius and Persson Citation1998). Since 2001, an average of 54% of the seedlings originate from Swedish seed orchards, 21% from foreign stands, 17% from Swedish stands, 6% from foreign seed orchards, whilst the origin of 2% is not specified (Skogsstyrelsen Citation2019). The imported Norway spruce seeds are mostly from Belarus, Poland, Lithuania, Finland, Latvia and Norway (more than 100kg seeds between 2004 and 2018) (Skogsstyrelsen Citation2020). Provenances from the Baltic regions and Belarus have later bud burst which in turn results in less damage due to spring frost events. This is important because climate change will result in warmer and longer growing seasons, but also more temperature variability in the spring causing more spring frost events. These will cause severe damage to trees, especially Norway spruce in Scandinavia (Jönsson and Bärring Citation2004, Citation2011; Langvall Citation2011). Provenances from eastern Europe also have later bud set, which results in a longer vegetation period and thus increased growth. This can increase the risk of autumn frost events affecting the trees, but in the southern part of Sweden the risk of frost in the autumn is low (Langlet Citation1960; Skrøppa and Magnussen Citation1993). The recommendation today for deployment of Norway spruce in the north of Sweden is that a latitudinal transfer often delivers a strong positive effect, with seeds moved to the north compared to their origin. This transfer yields a higher survival and growth (Rosvall Citation1982; Kroon and Rosvall Citation2004). In southern Sweden seeds from Eastern Europe are commonly used and perform better due to the late bud flush and higher growth (Werner and Karlsson Citation1982; Persson and Persson Citation1992). Importing seeds from countries within EU is allowed (EU Citation2000, Citation2008) but seed import from Belarus was only allowed up to 31 December 2019 (EU Citation2015). Before that more than 4000 kg seeds were imported to Sweden from 2004 until 2018 (Skogsstyrelsen Citation2020). Thus, material from other sources needs to be tested in order to find out how it compares with Swedish stand material in terms of growth and vitality, and to determine whether the phenology differs with respect to the risk of spring frost damage. Across Sweden there are several stands that have documented East European origin, giving rise to the idea that this material could be used for seed production if the superior performance from the original provenance is preserved.
Some research suggests that the conditions under which the seeds develop have epigenetic effects, regardless of where the seeds are planted (Kvaalen and Johnsen Citation2008; Skrøppa et al. Citation2009). This would mean that the place where the seeds mature will affect the characteristics of the trees later, especially with respect to growth rhythm characteristics such as bud burst and bud set, for instance that seeds that mature in warmer temperatures exhibit later bud burst. Even after a single generation some clear differences are visible, with the offspring behaving more like the local trees than the parent trees (Skrøppa and Steffenrem Citation2016).
The aim of this report was to generate new information on the selection and deployment of reproductive material for Norway spruce in situations where import is not possible, and if it is an option to use second generation material, offspring from seed sources of desired provenances that already exist in the country. To do so, we compared material from second generation material with various contemporary seed sources to determine whether the former represent an appropriate alternative as forest reproductive material in case of a shortage of improved seed orchard material or as a result of a ban on importing eastern seed from outside the EU. We intended to generate information on the selection and deployment of Norway spruce reproductive material in southern Sweden. The results could be applicable also for southern Norway and Finland as both the imported material and climatic properties are similar.
This study had the following specific objectives:
To compare seeds from Swedish stands of documented East European origin (second generation material) with autochthonous stand seed and seed orchards from both Sweden and Eastern Europe, we investigated if they differed in (i) growth; (ii) survival; (iii) growth rhythm; (iv) frost damages, as these properties are important for the performance of Norway spruce.
We hypothesized that seeds from the second generation material would be a feasible choice with respect to growth and survival in case of seed shortage, but we expect differences with respect to phenological traits (Skrøppa and Steffenrem Citation2016).
To determine if the performance of seed sources from (i) are stable over the intended area of utilization we analyzed their performance between different locations in order to get an indication of genotype versus environment (G×E) interactions. Our expectation based on earlier studies was that GxE should be low but also that it is important to look at the phenological properties (Berlin et al. Citation2015; Chen et al. Citation2017).
Materials and methods
Seed sources
The plant material used in this study originated from 50 different seed sources, which were separated into five groups () according to the origin of the seed. For a detailed description of the different seed sources see appendix 1 .
Table 1. The groups of seed sources included in the study. A detailed description of the different seed sources is given in .
The seeds that comprised the 20 seed sources of SweEast were collected in the autumn of 1998 from mature fully stocked stands. Certain standards were followed while collecting the material - the stands from which the seeds were sourced were documented as having been planted with seedlings of Eastern European origin, and there was a sufficiently large number of trees bearing cones. In each stand, 7–10 representative trees with cones were cut down and the cones were collected as one seed source.
The other 30 commercial seed sources were obtained in the spring of the year 2000. The Eastern European seed orchards and local unimproved stand seeds were in Latvia, Lithuania, Belarus and Poland (only stand material).
Planting and trials
The seedlings were grown in the nursery at the Skogforsk research station Ekebo for two years (2000–2002). Field trials were established in the spring of the year 2002 at six different locations in both southern and central Sweden ().
Figure 1. Trial locations used in this study (1–6), the five different groups (EastS, EastSO, SweEast, SweS and SweSO) and the origin of the SweEast stand seeds (SweEast origin).
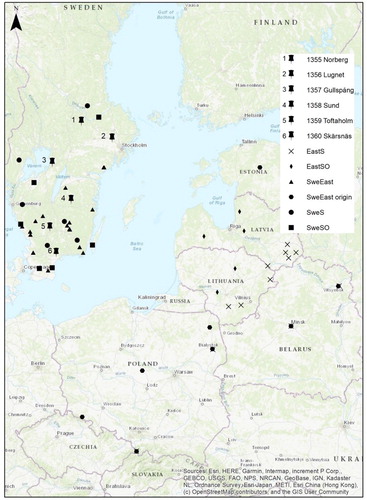
The trials were planted as single tree plots in a randomized block design with 25 replicates with the same set of seed sources in each. In trials 1355-57 (Norberg, Lugnet and Gullspång) the initial spacing was 2 × 2 m while it was 1.8 × 1.8 m in trials 1358-60 (Sund, Toftaholm and Skärsnäs).
Assessments
The trial series have been assessed four times: in the spring of 2004, late in the summer of 2005, autumn 2007 and autumn 2014. The growth traits measured were height at the plant age of seven (H7), and diameter at breast height at the plant age of 14 (DBH14). In order to examine growth rhythm, bud burst (BB) according to Krutzsch scale (Krutzsch Citation1973) and the top shoot was scored according to the proportion of lignification (L) (the percentage of top shot that was brown/lignified compared to the green active part) and in addition survival (alive/dead) at the plant age of four (S4), seven (S7) and 14 (S14) were assessed. Frost damage (F) observations were most commonly assessed at the plant age of four. presents the traits recorded.
Table 2. Description of measured and analyzed traits.
Statistical analysis
Prior to any other analysis all the class and binary variables (BB, F and L) were normal score transformed with mean zero and standard deviation one within each block to linearize the data (Gianola and Norton Citation1981).
Spatial analysis
To adjust the data for within-trial environmental effects a univariate single-site spatial analysis was performed using ASReml 4.1 (Gilmour et al. Citation2015), according to this model:
(1)
(1) Where y is the vector of individual tree observations, b is a vector of fixed effects (intercept), X is its design matrix, u is a vector of random effects (trial design parameters and family effects), Z is its design matrix and e is the vector of random residuals.
First, a model with only the experimental design features and independent error was used, to check the spatial distribution of the residuals; if the residuals were non-randomly distributed a second spatial model was used in which the residual variances are separated into an independent component and a two dimensional spatially auto-correlated component as:
(2)
(2) Where
is the spatial-dependent residual variance,
is the spatial-independent residual variance,
is the matrix Kronecker product of two matrices, and
and
are the first-order autoregressive correlation matrices in the column and row directions, respectively.
To detect design, treatment, local and extraneous effects different diagnostic tools, variograms and plots of spatial residuals were used in ASReml 4.1 (Gilmour et al. Citation2015). All the environmental effects were removed from the raw data by extracting the predicted design effects and spatial residuals from the ASReml output files (Dutkowski et al. Citation2002, Citation2006; Chen et al. Citation2017) for all the traits in each of the trials, and the spatially adjusted data were used for all other analysis.
Statistics
The statistical model used for single site analysis for each trial was:
(3)
(3) Where Yij is the value of tree ij, µ is the average of the trial, G is the effect of the group (i=1,2, … 5), FG is the effect of every seed source (j) in the group (i) and E is a random residual. All effects except the residual were considered to be fixed.
The statistical model used for multi-site analysis of all the trials was:
(4)
(4) Where Yijk is the value of tree ijk, µ is the average of the trial, G is the effect of the group (i), FG is the effect of every seed source (j) in the group (i), T is the effect of the trial (k), T*FG is the effect of every seed source (j) in the group (i) by environment (T), T*G is the effect of the group (i) by environment (T) and E is a random residual. G and FG were considered to be fixed, while the other variables were considered to be random.
SAS Proc Mixed (SAS Institute Inc. Citation2011) was used for the analysis, in which the group averages were obtained through least square means in the LSMEANS statement of Proc Mixed. TUKEY/Kramer (Proc Mixed, SAS Institute Inc. Citation2011) was used as for pairwise comparisons between the groups.
Results
For the multi-site analysis, the fixed variables were significant for all the traits and the covariance parameters for the random variables are seen in . The trees from SweSO were on average taller and wider than the rest, but no significant difference to EastSO for DBH14 and, EastSO and SweEast for H7 (). The smallest and thinnest trees on average were found in the SweS group. The seed sources from SweSO had 11-14.6% higher gain in growth for DBH14 and H7 respectively, compared to those from SweS. The gain for EastSO was 9%, EastS 6-7% and SweEast 5-7%. For spring frost damage, no significant differences were found between the groups but the SweS had most extensive frost damage on average ().
Table 3. Covariance parameter estimates for the random variables for the mixed model analysis.
Table 4. Least square average of the traits DBH14 and H7 and their standard errors (SE) with pairwise comparisons between all the groups.
Table 5. Least square averages on normal score data of the traits L, BB, F and S14 and their standard errors (SE) with pairwise comparisons between all the groups.
Bud flush scoring showed that the seed sources in the group SweS flushed significantly earlier than all other groups () with an average of bud flush score 5, followed by SweEast (4.7), SweSO (4.6), EastSO (3.6) and EastS (3.3). The relationship between the different groups is similar in all the trials with the highest bud flush score for SweS and the lowest for EastS and EastSO. Timing of bud flush was significantly different between the Eastern material compared to the Swedish material (). The growth cessation measured as lignification followed a similar pattern () with East European material significantly different from the Swedish material.
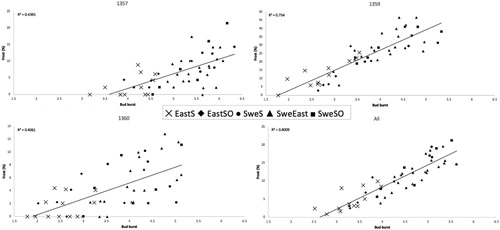
Correlating bud flush to frost damage () indicated that seed sources with earlier bud flush also suffer more from frost damage. Trial 1359 Toftaholm had the highest percentage of frost damage (23%); in addition, a high correlation between frost damage and bud flush could be seen (), with the Eastern European groups less damaged than the Swedish groups. This trend could also be seen in trials 1357 Gullspång (6% frost) and 1360 Skärsnäs (4% frost) but was less pronounced ().
Figure 2. Bud burst versus frost damage for trials 1357 Gullspång, 1359 Toftaholm, 1360 Skärsnäs and these three together (all).
In order to study the performance of the origins across sites, a ranking from the least square means was performed on the single site analysis (). For diameter at breast height at the age of 14 (, ), SweSO was widest on average in all the trials, while SweS was thinnest. For the height at age 7 (, ), SweSO was highest on average in all trials except for trial 1357 where EastSO was highest, and SweS was shortest on average. For frost damage (, ), SweS had on average most damage in all the trials while EastS had least damage. EastS had latest bud burst and shortest lignification in almost all the trials (, and A6), while SweS had earliest bud burst and longest lignification. For survival at age of 14 (, ), SweS had significant highest survival while EastS had lowest survival ().
To visualize the variation of performance within the different groups, the seed sources were ranked to see how the seed sources in the groups behave in the different trials (Appendix 2). Overall the different seed sources show similar behaviour in the same group, but some seeds sources stand out with higher or lower rank compared to other seed sources in the same group.
The majority of the recorded mortality occurred soon after establishment, and after the year 2 field assessment, the survival rate was stable. The same trend could be seen in all the trials (1.7–5.6% loss) and all the groups (2.5–3.8% loss). The lowest survival percentage, based on growing site, was in trials 1358 Sund and 1359 Toftaholm, with around 65%, while trial 1357 Gullspång and 1360 Skärsnäs had the highest survival of 88%. For the different provenances, group SweS had the highest survival with 85.8% alive after 2 years and 81.8% alive after 12 years, while SweSO had the lowest survival with 72% of the trees alive after 12 years.
Discussion
According to the current study, the seed-producing Swedish stands of documented East European origin (SweEast) may constitute a feasible choice in case of a shortage of seeds. The observed higher growth of SweEast and EastS as compared to SweS could be explained by the fact that they are more adapted to the sites. The fact that we found the bud burst in SweEast to be so much earlier than EastS () suggests that not only pollination from Swedish stands can explain the difference. If the SweS pollen had contributed 100% to the offspring, the SweEast group mean should have been closer to the EastS material. In addition, it is not likely that the pollen cloud came only from external sources. The fact that height in SweEast and EastS were approximately equal indicates that most of the pollination was from within the stand. Thus, even after one generation, the environment of the area where the seeds are planted has a great influence on the performance of the next generation. This was also reported by Skrøppa and Steffenrem (Citation2016). Another explanation for the results could be that the individual trees that have not adapted to the new site will die. However, mortality was low in the SweEast stands, suggesting that this effect should have been low. Naturally regenerated seedlings from the surrounding indigenous stands could have been another explanation but they should have been smaller and removed by thinning or died by competition. Influence of natural regeneration in the final stand increases if the mortality is high and, in our case the mortality for the deployed material was low. Even if the SweEast group is only partly the same as the East European material (), both materials are expected to have similar bud burst. The result, therefore, indicates a formation of land race, where trees from SweEast have adapted to the Swedish climate.
It is important to note the SweEast material behaves more like Swedish origin than East European origin material when considering phenological traits, especially bud burst. Therefore, SweEast has a higher risk of damage from spring frosts compared to seed sources originating from Eastern Europe.
The best performance was found in trees grown from seed orchard sources, with the Swedish orchards slightly better than the Eastern European ones (). It is interesting to note that SweEast seed sources differ more from SweS with respect to growth traits than phenology, indicating that the possible landrace formation did not affect those traits as much. This is as expected since reports about epigenetic effects most often highlight adaptive traits such as bud burst and growth termination (Skrøppa et al. Citation2007). In our study, both the ranking of the best group as well as the level of gain in growth were as expected based on Liziniewicz and Berlin Citation2019; Liziniewicz et al. Citation2019 and Haapanen, Citation2020. In locations with a high risk of spring frost damage, trees with later bud flush are to be preferred, thus East European material is a good choice as well as the Swedish seed orchards that exhibit later bud flushing.
The overall performance of different groups in different trials is similar and only small variances within the groups could be seen. These variances suggesting that seed sources may behave differently in different locations (Appendix 2). For example, the seed sources 137 (Hallaryd) was ranked much higher for H7 in the southern sites and lower in the northern sites (), indicating that trees from 137 was taller in the southern sites. This is probably due to the fact that the northern sites and southern sites are in different seed zones and some sites are frost prone sites (Berlin et al. Citation2015). When selecting material for deployment, it is not only important to select from the right group, it is also important to select the right kind of seed source. Thus, it is important to consider seed sources x site interaction when selecting material for deployment and adapt it to the site you have, especially regarding growth rhythm.
The low GxE in this study indicate a high plasticity of Norway spruce but with climate change and higher temperature in the future it will be harder for the trees to adapt. For Norway spruce it is the growth rhythm that is important. Especially how the connection between bud burst and the risk of spring frost damage is affected by the climate change (Langvall Citation2011; Svystun et al. Citation2020). This in turn will create a need for transfers of trees with desirable properties, assisted migration (Williams and Dumroese Citation2013; Koralewski et al. Citation2015).
Bud burst was strongly correlated with frost damage (), indicating that seed sources with earlier bud burst are more severely damaged. This has been shown in several other studies (Prescher Citation1982; Werner and Karlsson Citation1982; Hannerz Citation1994; Jönsson and Bärring Citation2004) and it supports the hypothesis that trees with later bud burst are more frost hardy in the spring.
When moving seeds from one country to another it is important to think about the aspect with introducing nonnative pests (Franić et al. Citation2019). However, the biggest risks are associated with transport of alive plants and moving plants from one continent to another (Santini et al. Citation2012). In our study Norway spruce seeds are only moved from Eastern Europe to Sweden, therefore the risk of nonnative pests should be low.
The majority of the recorded mortality occurred soon after establishment, and after 2 years in the field it levelled off and stabilized. We suspect that the early mortality is mainly due to fungal infection in the nursery. Many plants were affected, and plants that grew more rapidly were more affected due to higher plant density. During trial establishment plants with decreased vitality were observed by the planters. This may explain why seed sources with taller trees had the highest mortality at the beginning. To support this, it is clear that tree mortality was very low and similar for all the groups at all assessments after 2 years in the field. We therefore believe that this result should not be generalized to support the conclusion that the best growing trees will have lower survival in the forest.
Conclusions
In several Nordic countries there are seed shortage of improved Norway spruce seeds but in many of these countries there exist native seed sources of desired provenances like second generation material. In our study the second generation material have a growth rhythm similar to autochthonous Swedish material, indicating the development of a land race with respect to phenological traits. Seeds from Swedish seed orchards (SweSO) exhibited the highest growth, with seeds from Eastern European seed orchards (EastSO) close after, then seeds from Eastern European stands (EastS) and seeds from second generation material (SweEast), and finally, with the lowest growth, seeds from Swedish stands (SweS). There is variation within the different groups which indicate that it is important not only to select one group but also to select the right seed source within the selected group.
In locations where spring frost damage was recorded, a strong relationship between late bud flush and reduced damage could be seen which is in line with previous studies.
Although GxE was generally low in this study, indicating high plasticity of Norway spruce, global warming can result in very fast changes of climatic conditions, highlighting the need for assisted migration.
Acknowledgements
The authors wish to thank all staff involved in plant production, establishment, maintenance and assessment of the trials. The study is a contribution to the Research School of Forest Genetics, Biotechnology and Breeding.
Disclosure statement
No potential conflict of interest was reported by the author(s).
Data availability statement
All raw data are archived in DATAPLAN®.
Additional information
Funding
References
- Almqvist C. 2014. Nytt rekord i förädlade plantor. Skogforsk.se/Nr 39-2014 (Swedish).
- Almqvist C, Rosenberg O. 2016. Bekämpning av grankotterost (Thekopsora areolata) med fungicider – Försök utförda 2014 och 2015, Skogforsk. Arbetsrapport 894 (Swedish).
- Berlin M, Jansson G, Högberg K-A. 2015. Genotype by environment interaction in the southern Swedish breeding population of Picea abies using new climatic indices. Scand J For Res. 30(2):112–121.
- Capador H, Samils B, Olson Å. 2018. Development of microsatellite markers for Thekopsora areolata, the causal agent of cherry spruce rust. For Pathol. 48:3.
- Chen Z-Q, Karlsson B, Wu HX. 2017. Patterns of additive genotype-by environment interaction in tree height of Norway spruce in southern and central Sweden. Tree Genet Genom. 13:25.
- Crain BA, Cregg BM. 2018. Regulation and management of cone induction in temperate conifers. For Sci. 64(1):82–101.
- Danusevicius D, Persson B. 1998. Phenology of natural Swedish populations of Picea abies as compared with introduced seed sources. For Genet. 5:211–220.
- Dutkowski GW, Costa e Silva J, Gilmour AR, Lopez AR. 2002. Spatial analysis methods for forest genetic trials. Can J For Res. 32:2201–2214.
- Dutkowski GW, Costa e Silva J, Gilmour AR, Wellendorf H, Aguiar A. 2006. Spatial analysis enhances modelling of a wide variety of traits in forest genetic trials. Can J For Res. 36:1851–1870.
- EU. 2000. Council directive 1999/105/EC of 22 December 1999 on the marketing of forest reproductive material, § 1999/105/EC.
- EU. 2008. Council directive of 16 December 2008 on the equivalence of forest reproductive material produced in third countries, § 2008/971/EC.
- EU. 2015. Commission implementing decision 2015/321 of 26 February 2015 amending decision 2008/989/EC authorising member states, in accordance with Council Directive 1999/105/EC, to take decisions on the equivalence of the guarantees afforded by forest reproductive material to be imported from certain third countries (notified under document C(2015) 1045), § 2015/32.
- Franić I, Prospero S, Hartmann M, Allan E, Auger-Rozenberg M-A, Grünwald NJ, Kenis M, Roques A, Schneider S, Sniezko R, et al. 2019. Are traded forest tree seeds a potential source of nonnative pests? Ecol Appl. 29:7.
- Gianola D, Norton HW. 1981. Scaling threshold characters. Genetics. 99(2):357–364.
- Gilmour AR, Gogel BJ, Cullis BR, Welham SJ, Thompson R. 2015. ASReml user guide release 4.1 structural specification. Hemmel Hempstead: VSN International Ltd.
- Haapanen M. 2020. Performance of genetically improved Norway spruce in one-third rotation-aged progeny trials in southern Finland. Scand J For Res. 35(5-6):221–226.
- Hannerz M. 1994. Predicting the risk of frost occurrence after budburst of Norway spruce. Silva Fenn. 28(4):243–249.
- Jönsson AM, Bärring L. 2004. Climate change and the effect of temperature backlashes causing frost damage in Picea abies. Glob Planet Change. 44:195–207.
- Jönsson AM, Bärring L. 2011. Ensemble analysis of frost damage on vegetation caused by spring backlashes in a warmer Europe. Nat Haz Earth Syst Sci. 11:401–411.
- Koralewski TE, Wang H-H, Grant WE, Byram TD. 2015. Plants on the move: assisted migration of forest trees in the face of climate change. For Ecol Manag. 344:30–37.
- Kroon J, Rosvall O. 2004. Optimal produktion vid nordförflyttning av gran i norra Sverige. Skogforsk, Redogörelse nr 5, 24 (Swedish).
- Krutzsch P. 1973. Norway spruce development of buds. IUFRO S2.02.11. Vienna: International Union of Forest Research Organization.
- Kvaalen H, Johnsen Ø. 2008. Timing of bud set in Picea abies is regulated by a memory of temperature during zygotic and somatic embryogenesis. New Phytol. 177(1):49–59.
- Langlet O. 1960. Mellaneuropeiska granprovenienser i svenskt skogsbruk (Vol. 80). Uppsatser: Statens skogsforskningsinstitut (Swedish).
- Langvall O. 2011. Impact of climate change, seedling type and provenance on the risk of damage to Norway spruce (Picea abies (L.) Karst.) seedlings in Sweden due to early summer frosts. Scand J For Res. 26(Suppl. 11):56–63.
- Lindgren K, Ekberg I, Eriksson G. 1977. External factors influencing female flowering in Picea abies (L.) Karst. Stockholm, Sveriges lantbruksuniversitet. Stud For Suec. 142:1–53.
- Liziniewicz M, Berlin M. 2019. Differences in growth and areal production between Norway spruce (Picea abies L. Karst) regeneration material representing different levels of genetic improvement. For Ecol Manag. 435:158–169.
- Liziniewicz M, Karlsson B, Helmersson A. 2019. Improved varieties perform well in realized genetic gain trials with Norway spruce seed sources in southern Sweden. Scand J Forest Res. 34:409–441.
- Myking T, Rusanen M, Steffenrem A, Kjær ED, Jansson G. 2016. Historic transfer of forest reproductive material in the Nordic region: drivers, scale and implications. Forestry. 0:1–13.
- Persson A, Persson B. 1992. Survival, growth and quality of Norway spruce (Picea abies (L.) Karst.) provenances at the three Swedish sites of the IUFRO 1964/68 provenance experiment. Report 29. Department of Forest Yield Research. The Swedish University of Agricultural Sciences, 67 p.
- Prescher F. 1982. Growth rhythm and growth ability in Norway spruce provenances. Report 10. Department of Forest Yield Research. The Swedish University of Agricultural Sciences, 58 p (Swedish with English summary).
- Remröd J, Lundell S, Pettersson W, Rosvall O. 2003. Svenska Skogsfröplantager 2020 - Nationell plan för den 3:e omgången fröplantager i Sverige. Skogforsk. Arbetsrapport 548 (Swedish).
- Rosvall O. 1982. Förflyttningseffekter i norrländska granproveniensförsök. information 1983/84, Vol. 4 (p. 4). Uppsala: Institutet för skogsförbättring. (Swedish).
- Rosvall O, Jansson G, Andersson B, Ericsson T, Karlsson B, Sonesson J, Stener L-G. 2001. Genetic gain from present and future seed orchards and clone mixes. Skogforsk Redogörelse. 1. 41 pp. (Swedish).
- Santini A, Ghelardini L, De Pace C, Desprez-Loustau ML, Capretti P, Chandelier A, Cech T, Chira D, Diamandis S, Gaitniekis T, et al. 2012. Biogeographical patterns and determinants of invasion by forest pathogens in Europe. New Phytol. 1:238–250.
- SAS Institute Inc. 2011. SAS/STAT User’s guide 9.3. Cary, NC: SAS Institute, Inc.
- Skogsstyrelsen. 2019. Statistikdatabas. http://pxweb.skogsstyrelsen.se/pxweb/en/Skogsstyrelsens%20statistikdatabas/?rxid=b1322833-b746-4270-9998-75a95ec08571, Skogsstyrelsen.
- Skogsstyrelsen. 2020. Levererade skogsplantor 2019. Sveriges officiella statistik JO0313 SM 2001.
- Skrøppa T, Kohmann K, Johnsen Ø, Steffenrem A, Edvardsen ØM. 2007. Field performance and early test results of offspring from two Norway spruce seed orchards containing clones transferred to warmer climates. Can J For Res. 37(3):515–522.
- Skrøppa T, Magnussen S. 1993. Provenance variation in shoot growth components of Norway spruce. Silvae Genet. 42(2/3):111–120.
- Skrøppa T, Steffenrem A. 2016. Selection in a provenance trial of Norway spruce (Picea abies L. Karst) produced a land race with desirable properties. Scand J For Res. 31(5):439–449.
- Skrøppa T, Tollefsrud MM, Sperisen C, Johnsen Ø. 2009. Rapid change in adaptive performance from one generation to the next in Picea abies – central European trees in a Nordic environment. Tree Genet Genom. 6(1):93–99.
- Svystun T, Lundströmer J, Berlin M, Westin J, Jönsson AM. 2020. Model analysis of temperature impact on the Norway spruce provenance specific bud burst and risk of frost damage. Submitted.
- Werner M, Karlsson B. 1982. Resultat från 1969 års granproveniensserie i Syd- och Mellansverige. [Results from a series of Norway spruce provenance trials within southern and central Sweden, established in 1969]. Föreningen skogsträdsförädling, Institutet för skogsförbättring. Årsbok 1982, 90–158.
- Williams M, Dumroese RK. 2013. Preparing for climate change: Forestry and assisted migration. J For. 111(4):287–297.