
 ?Mathematical formulae have been encoded as MathML and are displayed in this HTML version using MathJax in order to improve their display. Uncheck the box to turn MathJax off. This feature requires Javascript. Click on a formula to zoom.
ABSTRACT
Admixtures of birch in Norway spruce plantations are being promoted as a means to increase habitat and species diversity. The implications of this mixture were analysed with regional survey data from southern Sweden. Permanent sample plots from the Swedish National Forest Inventory (NFI), with Norway spruce and admixture of birch, were used to describe the temporal trends in the admixture, regarding species composition and competitive strength. Observations from thinned plots show a higher harvest removal in birch (35%) than for Norway spruce (19%). Observations without thinnings in the period before measurement showed that individual birch tree growth was lower compared to Norway spruce and it decreased even more with increasing stand age and competition. In addition, a complementary field survey, with multiple distributed sample plots in each stand, was used to detect within-stand variation of species composition and density. Although within-stand heterogeneity was larger in mixed stands in terms of species composition, it was not different from Norway spruce monocultures in terms of stand density. These two surveys show that the admixture of birch, for several reasons, decreases over stand age and although birch increases tree species diversity, it does not necessary imply a change in density.
Introduction
Sustainable production of wood for fibre and construction is an important driver of the Swedish economy. The management of production forest lands is regulated, in terms of both harvest restrictions and regeneration obligations. Most of the productive forest land is managed by rotation forestry systems with soil scarification and planting as primary measures to secure new forest growth. Thirty years ago, a new forest act was implemented which emphasized the need to balance multiple objectives for forest lands (Gustafsson and Perhans Citation2010). Mixed forest of planted conifers and naturally regenerated broadleaves are suggested as a measure to combine both a sustainable wood supply and a high level of biodiversity conservation (Bergquist et al. Citation2016; Felton et al. Citation2010; Felton et al. Citation2016) and in Fennoscandia, mixed-forests represent less than 20% of forest land area (Huuskonen et al. Citation2021). The definition of what counts as a mixture versus a monoculture varies across studies (Bravo-Oviedo et al. Citation2014). For example, the Swedish national forest inventory (NFI) sets the limits as a tree species composition for which no more than 65% of the basal area is dominated by one species (Drössler Citation2010; Nilsson Citation2013), whereas other studies use a threshold of 70% (Felton et al. Citation2016). The retention of at least some broadleaf trees throughout a stand’s rotation (5–10% of basal area) is also a requirement of some certification standards (FSC Citation2010).
Surveys, with spatial and/or temporal distribution of sample plots, can be used to describe the status of the forest structure within or between sample plots. Variation, in terms of tree species diversity or stand density, provides insights into the function of managed mixtures as forest habitats (Hedwall et al. Citation2019). Furthermore, comparisons of tree growth rates in mixtures across gradients of stand density and/or inter vs, intraspecific competition (Brunner and Forrester Citation2020; Manso et al. Citation2015), or stand age, will contribute to the understanding of how to continue manage mixtures over the full rotation, in order to retain tree species composition and habitat quality. Likewise, survey plots have been important for the understanding of the interaction effects of tree size inequality, stand density, resource availability and resource use efficiency on stand growth (Forrester Citation2019).
Norway spruce (Picea abies (L.) Karst) is the most commonly planted tree species in southern Sweden (Bergquist et al. Citation2017) and most of the associated clearcuts are soil scarified prior to planting with methods that also provide for the natural regeneration of birch spp. (Betula pendula Roth, Betula pubescens Ehrh) (Holmström et al. Citation2016a; Holmström et al. Citation2017; Nilsson et al. Citation2010). The combination of high survival rates of the planted Norway spruce seedlings and sometimes a high density of naturally regenerated birch (Holmström et al. Citation2019) has led to the manual pre-commercial thinning (PCT) of young stands to select and favour the future crop trees. This is the development stage at which time the land owner decides whether or not to keep and maintain a mixture in the future stand (Agestam et al. Citation2006; Felton et al. Citation2016; Holmström et al. Citation2015). Among the many decisions taken during PCT is not only the choice and proportion of tree species to retain, but also the magnitude of competitive release provided by selecting the size and stem density of the retained tree species (Fahlvik et al. Citation2015; Holmström et al. Citation2016b). Forest experiments with the specific aim to evaluate the growth of spruce–birch mixtures provide strong evidence that density of the stand, after PCT and the height relation between the tree species, will affect the possibility to keep both species in the mixture over a full stand rotation (Fahlvik et al. Citation2005; Fahlvik et al. Citation2011; Fahlvik et al. Citation2015; Holmström et al. Citation2015). However, very few experiments are available for this specific forest mixture type in later stages, after the first commercial thinning until final harvest. Instead survey data of existing stands are at the present time one of the best sources of information regarding how these stands behave in older stages. The Swedish national forest inventory (NFI) has repeatedly measured temporary sample plots across the country for almost a century, from which regional and national estimates of standing volume and periodic growth can be obtained (Fridman et al. Citation2014; Nilsson Citation2012). In addition, permanent sample plots with a re-measurement frequency of 5–7 years were added to the NFI in 1983.
The main objective of this study was to use forest inventory data to describe the current status of Norway spruce production forests in which birch occurs and how these stands tend to develop. The following forest conditions in southern Sweden were investigated using two surveys, one with temporally – and the other with spatially – repeated measurements. Two questions were addressed using permanent sample plots of the NFI and based on the change in management and growth between repeated measurements over time: (1) Is the thinning intensity the same in both tree species, indicating a preservation in mixed species composition after thinning? (2) How is the growth performance of birch compared to Norway spruce when stand age and competition increase? A third question was addressed using a field survey with replicated sample plots within stands: Is there a correlation between stand variation in the proportion of Norway spruce and variation in basal area, indicating differences in growth rate, management or site differences in monocultures of Norway spruce compared to admixtures with birch? For both surveys, the selected interval for a sample plot to be defined as “mixture”, the species proportion of birch was defined as at least one birch in the sample plot and at most 70% of the basal area. This definition was used specifically for the purpose of addressing the questions raised above, for which mixed forest response per se was not the key issue, but rather how forest practices interact with tree – and forest growth.
Material and methods
NFI, survey selection
The study area was confined to Götaland, an administrative region in southern Sweden which is also used as the geographical delineation for the southern sampling design within the Swedish NFI (). Not included in the study was the southernmost county (Skåne), where Norway spruce is only partly native, and Kalmar County, which also has relatively low proportion Norway spruce forests historically (Lindbladh et al. Citation2014). The forest in the study area is predominantly coniferous forests, and most of the commercial forests are managed with a clearcutting system regenerated with either Norway spruce or Scots pine. The climate is in the border of the boreal region with annual mean temperature 5–8°C and average annual precipitation ranging between 500 and 1000 mm year−1 (SMHI Citation2015).
Figure 1. Location of NFI sample plots and the stand survey, framed within the shaded study area in southern Sweden.
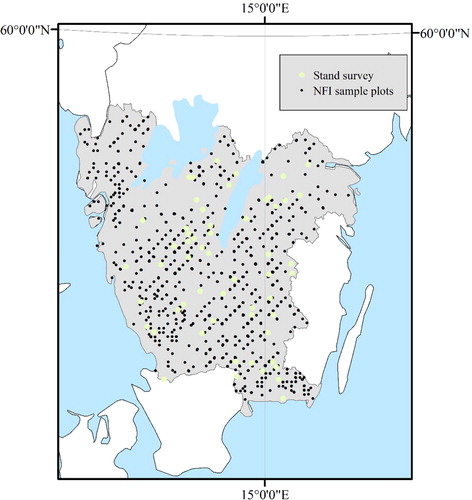
We evaluated all permanent NFI sample plots from the study area, if measured between 1983 and 2016 and providing two or more repeated measurements. Every repeated measurement is defined as a “revision” and the number of revisions varied between plots (2–6), depending on when they were established. The time period between revisions varied from five to seven years, depending on the inventory scheme at the time (Fridman et al. Citation2014). We restricted our analysis to plots with at least one revision in which there was a living birch tree in the plot and for which birch and Norway spruce trees together accounted for more than 90% of basal area. In addition, we removed sample plots in which birch exceeded 70% of the basal area. From here on, we refer to this final selection as the NFI survey, which consisted of 717 permanent sample plots in total (). This sample corresponded to 52% of the sample plots from the study region that were dominated by Norway spruce.
NFI, measurements and data retrieval
NFI measurements involve all trees within the radius of 10 m from plot centre being registered and measured. For the repeated measurements, trees are first identified from earlier inventories so that individual tree changes can be calculated or registered (e.g. mortality, growth or harvest). Trees with a diameter at breast height (dbh) exceeding 100 mm were measured on the whole sample plot, whereas trees with dbh between 40 and 100 mm were measured on a smaller plot with an area of 38.5–78.5 m2 depending on the year of inventory. Trees growing into the tree population in subsequent inventories are registered as new sample trees. In this study, basal area per hectare (G) was calculated as the sum of all trees’ basal area weighted with the sample plot area and individual tree and sample plot basal area growth was calculated based on the difference in between two measurements. In order to adjust for the unknown prior basal area of the new sample trees, the dbh in the previous inventories (dbht1-1) were derived as a linear function of time between measurements, age and the next measured dbh where dbh and species were derived from the NFI database for the individual trees and age was derived from the sample plot estimated age.
Tree height is only measured for a low proportion of trees in every sample plot (approximately 1–2 trees per sample plot), but individual tree height is provided in the NFI database using Söderbergs height functions (Söderberg Citation1986) with corrections from the sample plot height measurements (Fridman et al. Citation2014).
Stand survey, survey selection
The second survey was initiated as a stand survey database for investigations of Spruce–birch mixtures, including habitat – and species diversity-studies (Hedwall et al. Citation2019). The same study area as for the NFI selection was delineated and within this geographic range forest stand information from the Swedish state company Sveaskog and from the forest owner association Södra skogsägarna, was compiled (). The information contained a shape file with the geographic position and stand borders for every stand and a few stand descriptive values such as tree species proportion, stand age, density and estimated basal area. Age, density and species proportion were supplemented and corrected with field observations. Only stands with ≥90% of Norway spruce and birch combined were used in the survey. Other criteria for inclusion were based on age ≤ 60 years, stand size ≥ 2 hectares, and stand form, whereby the majority of the stand must be wider than 100 m, in order to minimize edge effects from surrounding stands. In an attempt to ensure a balance in the number of stands included in the survey, the stand database was stratified into three categories of species proportion according to the stand data base; birch dominated (B.dom) = Birch dominated ≥ 80% birch, Spruce dominated (S.dom) < 20% birch, and in between Admixture with birch (Mix), and four age categories: 20–29 years, 30–39 years, 40–49 years and 50–59 years, resulting in a total of 12 strata. A random priority was assigned to all stands within each strata and the inventory was then made in the priority-order until five stands in each strata were measured. The minimum distance between two selected stands was 1 km. Stands were first assessed using orthophotos, and a GIS layer for the stand borders. This was necessary because of uncertainties regarding actual tree species proportions, and broadleaf species identifications, as listed in the stand database. If it was clear from the orthophotos that the broadleaf species were not birch (e.g. large heritage oaks) the stand was excluded. All selected stands were visited and measured with a grid of 10 m radius sample plots, 5 per stand. The distribution of the sample plots was made prior to the field visit, distributed systematically over the stand but centralized to reduce edge effects. The stand attributes provided by the data base were predominantly consistent with field assessed descriptions: The stands were located on medium to fertile sites, and consistent in terms of their stem density, which decreased with age and thinnings. Most stands had signs of thinnings (stumps and strip roads), with the exception of 15 stands. The lack of thinning in these stands understandably affected resultant stem density and standing volume (). Of the unthinned stands, 10 were in the youngest age class, and were predominantly classified as birch dominated stand types in the database. The other unthinned stands were stands occurred among stand type mixtures in age class 30–39 years, which had a higher average stem number compared to the other stand types in the same age category (). As the birch dominated stands had a high proportion of birch (on average 70% of the basal area), there was difficulty to find “typical birch monocultures with the purpose of wood production” in older age classes and therefore the comparison with the other stand types in terms of heterogeneity was not further explored.
Table 1. Stand mean and standard deviation of stem density and standing volume for age categories and stand types (n = 5).
Table 2. Summary statistics of the NFI sample plots between revisions. Basal area (m2 ha−1) corresponds to the total sample plot basal area and birch proportion is the percentage birch basal area in the sample plot.
Stand survey, measurements and data retrieval
All trees within the sample plot were cross calipered for dbh and included if the dbh exceeded 40 mm. The tree species, observed damage, and mortality were recorded. Heights were measured for the two trees with the largest dbh, as well as for one random tree of the dominant tree species. If the sample plot included more than one tree species, up to three random trees were measured in height. Stand age was assessed and compared with the stand database by counting branch whorls on Norway spruce (one year per whorl), and tree ring counting some of the height measured trees using cores at breast height.
Site variables were taken at every sample plot using the classifications according to Lundmark (Citation1974). If the stand had stumps from thinning operations, the time since thinning was estimated as 1, 3, or 5 years, using the decay stage of the stumps and retained twigs as indicators. The mixtures were classified using descriptive measures of mixed structure: Composition structure was either stem-by stem mixture or grouped tree species mixture. The canopy structure was categorized as involving either the two tree species coexisting in the same canopy layer or segregated in distinct sub-layers. The succession structure of the stand was categorized according to whether the stand was regenerated at the same time, as opposed to two distinct regeneration periods within the stand. The descriptors were assigned from the centre of every sample plot, subjectively assessed based on the surrounding view. Stand heterogeneity was also evaluated using the coefficients of variation for basal area and species proportion of the basal area between plots. The species proportions were assessed and based on the Norway spruce percentage of the total sample plot basal area. Heterogeneity was tested by Anova two-way statistical tests using the stand age and stand type categories.
For all calipered trees an estimated height was calculated using a standard method for height functions H = DBHx/(a + bDBH)x + 1.3, where H = tree height (m), DBH = diameter at breast height, a and b are coefficients, and x has the value of 2 for birch and 3 for Norway spruce with separate functions per stand and tree species (Holmström et al. Citation2015; Naslund Citation1947). This was possible to do when the number of height-measured trees exceeded 10 per stand. For cases in which the presence of tree species other than Norway spruce and birch, the Söderberg height functions was used (Söderberg Citation1986), which is also the standard for height estimations used by the Swedish NFI.
Both surveys, data management and statistical design
In both surveys the individual tree volume and standing volume per hectare (the sum of the tree volumes in the sample plot weighted on plot area) were calculated using species-specific volume functions for southern Sweden (Brandel Citation1990). Quadratic mean diameter (QMD) was also calculated, as a species-specific measure and as based on all stems in the sample plot. Thereafter the ratio of QMD for birch vs. Norway spruce was calculated for each sample plot.
Periodic annual basal area growth (ABA) (m2 year −1) for individual trees was estimated from the NFI data using the difference in DBH between two periods. A linear mixed model was used for the analysis of growth difference, as well as for ABA of Norway spruce and birch trees, with i replicates of measurements nested within j sample plots (Plot) as random effect, using R statistics software package lme4 (R Core Team Citation2013):
(1)
(1) where
is the model intercept and the fixed effects included in the initial model were initial and squared DBH of the tree (DBH, DBH2), sample plot basal area (G) and estimated stand age of the sample plot (Age). Tree species (TS) was implemented as a dummy variable in the model for either birch (B) or Norway spruce (NS). The survey material used in the statistical test was reduced to only include sample plots with birch proportion less than 70% of the basal area but still possessing at least one birch tree, within a minimum of one of the revisions. Furthermore, only those revisions were included that were without documented thinnings since last measurement, with stand age below 150 years and basal area corresponding to between 10 and 40 m2 ha−1 and testing only trees with DBH between 10 and 40 cm. The reduction in observations was made to ensure a sound proportion of sample trees of both species and reduce outliers which could be large measuring errors, (542 sample plots used in the model). To reduce heteroscedacity of the data, the response variable was transformed prior to model fit by a reciprocal square root transformation. All fixed effects and interactions with tree species (TS) were initially kept but removed if proved non-significant, using a p-level p > 0.05 in combination with reduction of AIC.
Results
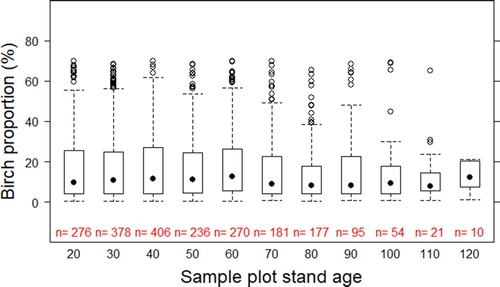
For all revisions the mean birch proportion in terms of basal area and stem density was 18 and 19%, respectively, while median birch proportion of the stem density was 11 and 13%, respectively, () (). Although the variation between plots was high, the inventory remained constant over the revision years, in regard to basal area and birch proportion.
Figure 2. Box and whisker plot of the birch proportion in basal area (%) in each sample plot, grouped by stand age at the time of the revision. The number of observations is stated (with n = j) in red above the stand age presented in black, in age classes of 10 years where “20” corresponds to age 16–25, etc.
Thinning intensity
Thinning operations were made in the period between two revisions in 295 sample plots, resulting in 360 thinning events in total, due to repeated thinnings in some plots. The species-specific thinning intensity was for Norway spruce on average 19% and for birch 35% of the basal area. Of the thinning events, 69 occurred in sample plots with one birch, which was removed in 33% of the events.
Species growth rate
The individual tree annual basal area growth (ABA) was evaluated for all sample plots and revisions without thinning, in between the two measurements. The dummy variable TS for tree species was significant for all fixed effects except for basal area (G), and the model was reduced accordingly, ending up with species-specific coefficients for stand age (Age) and DBH. Birch ABA was significantly lower compared to Norway spruce and the difference increased with stand age and with the sample plot basal area (). Based on the model prediction, birch tree ABA was 69% of Norway spruce at sample plot basal area 10 m2, and 55% in plots with a basal area of 30 m2, given the median-sized dbh 15.3 cm and median sample plot stand age of 40 years. The same tendency of decline in birch tree size compared to Norway spruce was also visible in the ratio of quadratic mean diameter for birch vs. Norway spruce ().
Figure 3. Box and whisker plot of the ratio of birch vs Norway spruce quadratic mean diameter in each sample plot, grouped by stand age at the time of the revision. The number of observations is stated (with n = j) in red above the stand age presented in black, in age classes of 10 years where “20” corresponds to age 16–25, etc.
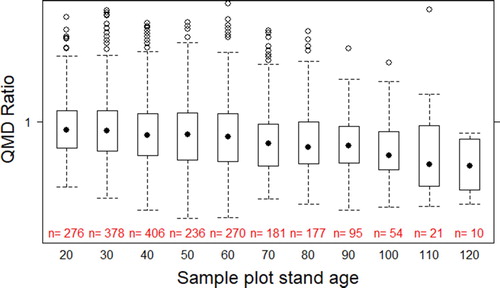
Table 3. Statistical characteristics of Equation (1).
Within stand variation
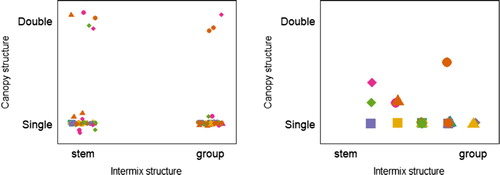
In the stand type Mixture all, except 8 sample plots, had a single layer in the canopy structure of the species mixture, but the composition structure, however, was equally stem wise and group wise categorized in sample plots and stands ().
Figure 4. Visualization of the composition and the canopy structure in plots (left panel) and as mean values over stands (right panel). The combination of colour and symbol is representing a unique stand.
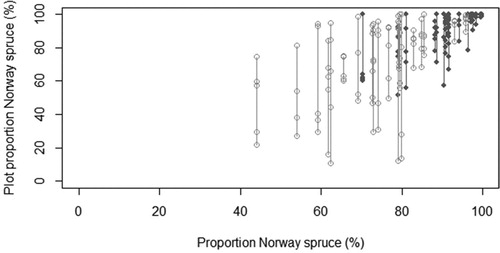
Basal area variation between sample plots within stands was high; 23 and 19% for the mixed and Norway spruce dominated stand types, respectively although the coefficient of variation for basal area within the stands was not significantly different between stand types (). However, the coefficient of variation for proportion of the Norway spruce basal area within stands was significantly higher in the mixed stands (30%) compared to the Norway spruce monocultures (9%), (p < 0.05) (). The stand age had no effect on either of the two coefficients of variation.
Figure 5. Top panel: Sample plot basal area vs the mean basal area for the five sample plots. Each line corresponds to the min and max value from each stand. Lower panel: Coefficient of variance of basal area between sample plots in the same stand. Dark grey and light grey symbols correspond to Norway spruce monoculture and birch stand, respectivley.
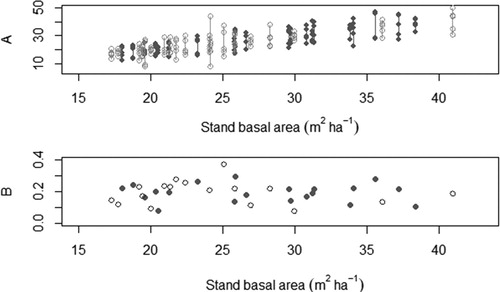
Figure 6. The basal area proportion (%) of Norway spruce in sample plots vs the stand mean value. Lines correspond to the stand max and min value. Dark grey and light grey symbols correspond to Norway spruce monoculture and birch stand, respectively.
Discussion
The presence of a birch stem in the Norway spruce forest seems to be as common as absence, considering the proportion of Norway spruce sample plots with birch presence sometime during the rotation was 50%. Data from the NFI showed that some Norway spruce forests with intermixed birch remain in the southern Swedish forestry even after commercial thinnings. The high frequency of thinnings confirms the assumptions that such mixed forest stands in mid-rotation age (40–80 years) in southern Sweden are managed to a similar intensity as the Norway spruce production stands with little or no birch retained. However, based on the NFI findings, there are indications of a reduced birch admixture in production stands later in the rotation. Firstly, the proportion of birch is more intensively harvested in thinnings compared to Norway spruce. Secondly, the growth rate of the individual trees is slower than that of the surrounding Norway spruce. These findings indicate that the birch proportion in mixtures demands active management in order to retain the mixture over the full rotation, which is a finding likewise supported by independent results from experiments and scenario analysis (Fahlvik et al. Citation2015; Holmström et al. Citation2015; Holmström et al. Citation2016b; Huuskonen et al. Citation2021). Active management to preserve spruce–birch mixtures may involve heavier thinning in Norway spruce stands, reducing the overall competitive pressures in the stand. Many deciduous species like birch require wider spacing than Norway spruce to maintain vitality and growth capacity in a stand, and to avoid self-thinning (Hynynen et al. Citation2010; Maleki and Kiviste Citation2016; Vanhellemont et al. Citation2016). The apparent decrease in competitive strength of birch over the rotation needs to be taken into consideration during future management if an admixture of birch is to be maintained over the full stand rotation.
The results from the field survey and specifically, the replication of sample plots within the same forest stand make it possible to further elaborate on the ways by which mixed forest also can increase heterogeneity. Forest diversity, in terms of tree species mixture, is currently used as a measure to combine multiple objectives in plantations. In other words, using an increase in forest tree species composition to correspondingly increase forest structure and function, might theoretically be a way forward for forest plantations managed to provide for a wider variety of species habitat requirements and ecosystem services (Felton et al. Citation2016; Felton et al. Citation2020). Results from the field survey showed that heterogeneity, described as variation within the stand, clearly increased with the mixture if measured as tree species proportion. We suggest this is probably an artefact of the stand’s origin, as many of these mixtures are not intentionally created but have occurred due to variation in birch regeneration throughout the stand, and as a result of the patchy success in Norway spruce regeneration.
Importantly however, within-stand heterogeneity did not increase if measured solely as basal area. In this regard there was no significant difference in basal area variation between Norway spruce monocultures and Spruce–birch mixtures. This is in line with other studies where conventional stand characteristics, such as density, show low to moderate correlation with indices of structural heterogeneity (Keren et al. Citation2020). The implications of this may be that for some forest taxa the addition of another tree species will not be sufficient as habitat improvement, if these additional benefits are not sufficient to override the habitat limitations imposed by high stand densities (Hedwall et al. Citation2019). If the objective with growing the Norway spruce stand together with admixture of broadleaves is to increase nature conservation values, then this issue needs to be considered from the outset of the thinning regime. Simulations of thinning approach in mixtures demonstrate positive effects of maintaining clustering tree structures for maintained or increasing within-stand heterogeneity (Cannon et al. Citation2019) as well as a general increase of species richness with increasing forest heterogeneity (Felton et al. Citation2016; Latif et al. Citation2020).
Conclusions
Due to the lack of established experiments and empirical data on growth performance in older Norway spruce–birch mixtures, we exploited NFI data and targeted field surveys to fill important remaining knowledge gaps. The permanent sample plots from the NFI, with repeated measurements on the same trees, made it possible to both quantify and provide statistical support for theoretical expectations that birch would decrease in percentage within Norway spruce plantations with time and over the course of the rotation. Birch in these forests tends to have more difficulties to maintain its proportion over the length of the rotation in southern Sweden and this regardless of thinnings or no thinning occurring. Furthermore, the repeated measurements of our field survey made it possible to disentangle the contradictory results regarding forest diversity. Specifically, although mixed stands have a high variation in tree species composition, this did not translate into a corresponding increased variation in stand density. Whereas experiments conducted in younger stands have repeatedly demonstrated the reduced growth rate of birch compared to Norway spruce (Fahlvik et al. Citation2011; Holmström et al. Citation2015), our efforts emphasize the importance of also considering the trajectory of birch decline later in the rotation.
Acknowledgements
Sveaskog and Södra forest owner association, has approved that information extracted from their forest properties can be published in anonymous summarized results, as managed in this manuscript. We are thankful for their data contribution. We are thankful to the Swedish National Forest Inventory, especially to Bertil Westerlund, who guided us with metadata and data delivery, and to all the forest technichians measuring the forest every summer.
Disclosure statement
No potential conflict of interest was reported by the author(s).
Data availability
Data from the national forest inventory (NFI) are open source and available from the SLU webpage: https://www.slu.se/en/Collaborative-Centres-and-Projects/the-swedish-national-forest-inventory/. Detailed information regarding exact coordinates of sample plots from both stand survey and NFI is not open source but may be retrieved after written agreements have been made with the original data supplier. The datasets generated during and/or analysed during the current study are available from the corresponding author on reasonable request (excluding exact location of the plots).
Additional information
Funding
References
- Agestam E, Karlsson M, Nilsson U. 2006. Mixed forests as a part of sustainable forestry in southern Sweden. J Sustain Forest. 21:101–117. doi:10.1300/J091v21n02_07.
- Bergquist J, Edlund S, Fries C, Gunnarsson S, Hazell P, Karlsson L, Lomander A, Näslund B, Rosell S, Stendahl J. 2016. Knowledge platform for forest production/Kunskapsplattform för skogsproduktion Tillståndet i skogen, problem och tänkbara insatser och åtgärder. Jönköping: Skogsstyrelsen. p. 180.
- Bergquist J, Fries C, Svensson L. 2017. Skogsstyrelsens återväxtuppföljning Resultat från 1999–2016. Swedish Forest Agency. In Swedish.
- Brandel G. 1990. Volymfunktioner för enskilda träd: tall, gran och björk. [Volume functions for individual trees: Scots pine (Pinus sylvestris), Norway spruce (Picea abies) and birch (Betula pendula & Betula pubescens)]. In: Dept of For. Yield Res. Garpenberg: Swedish University of Agricultural Sciences; p. 183.
- Bravo-Oviedo A, Pretzsch H, Ammer C, Andenmatten E, Barbati A, Barreiro S, Brang P, Bravo F, Coll L, Coronal P. 2014. European mixed forests: Definition and research perspectives. Forest Systems. 23:518–533. doi:10.5424/fs/2014233-06256.
- Brunner A, Forrester DI. 2020. Tree species mixture effects on stem growth vary with stand density – an analysis based on individual tree responses. For Ecol Manag. 473:118334. doi:10.1016/j.foreco.2020.118334.
- Cannon JB, Tinkham WT, DeAngelis RK, Hill EM, Battaglia MA. 2019. Variability in mixed conifer spatial structure changes understory light environments. Forests. 10:1015. doi:10.3390/f10111015.
- Drössler L. 2010. Tree species mixtures – a common feature of southern Swedish forests. Forestry. 83:433–441. doi:10.1093/forestry/cpq025.
- Fahlvik N, Agestam E, Ekö PM, Linden M. 2011. Development of single-storied mixtures of Norway spruce and birch in southern Sweden. Scand J Forest Res. 26:36–45. doi:10.1080/02827581.2011.564388.
- Fahlvik N, Agestam E, Nilsson U, Nystrom K. 2005. Simulating the influence of initial stand structure on the development of young mixtures of Norway spruce and birch. For Ecol Manag. 213:297–311. doi:10.1016/j.foreco.2005.03.021.
- Fahlvik N, Eko PM, Petersson N. 2015. Effects of precommercial thinning strategies on stand structure and growth in a mixed even-aged stand of Scots pine, Norway spruce and birch in southern Sweden. Silva Fenn. 49:17. English.
- Felton A, Lindbladh M, Brunet J, Fritz Ö. 2010. Replacing coniferous monocultures with mixed-species production stands: an assessment of the potential benefits for forest biodiversity in Northern Europe. For Ecol Manag. 260:939–947. doi:10.1016/j.foreco.2010.06.011.
- Felton A, Löfroth T, Angelstam P, Gustafsson L, Hjältén J, Felton AM, Simonsson P, Dahlberg A, Lindbladh M, Svensson J, et al. 2020. Keeping pace with forestry: multi-scale conservation in a changing production forest matrix. Ambio. doi:10.1007/s13280-019-01248-0.
- Felton A, Nilsson U, Sonesson J, Felton A, Roberge J-M, Ranius T, Ahlström M, Bergh J, Björkman C, Boberg J. 2016. Replacing monocultures with mixed-species stands: ecosystem service implications of two production forest alternatives in Sweden. Ambio. 45:124–139. doi:10.1007/s13280-015-0749-2.
- Forrester DI. 2019. Linking forest growth with stand structure: tree size inequality, tree growth or resource partitioning and the asymmetry of competition. For Ecol Manag. 447:139–157. doi:10.1016/j.foreco.2019.05.053.
- Fridman J, Holm S, Nilsson M, Nilsson P, Ringvall A, Ståhl G. 2014. Adapting National Forest Inventories to changing requirements – the case of the Swedish National Forest Inventory at the turn of the 20th century.
- FSC. 2010. Swedish FSC standard for forest cerification including SLIMF indicators. Forest Stewardship Council, p. 95.
- Gustafsson L, Perhans K. 2010. Biodiversity conservation in Swedish forests: ways forward for a 30-year-old multi-scaled approach. Ambio. 39:546–554. doi:10.1007/s13280-010-0071-y.
- Hedwall P-O, Holmström E, Lindbladh M, Felton A. 2019. Concealed by darkness: How stand density can override the biodiversity benefits of mixed forests. Ecosphere. 10:e02835. doi:10.1002/ecs2.2835.
- Holmström E, Ekö PM, Hjelm K, Karlsson M, Nilsson U. 2016a. Natural regeneration on planted clearcuts – the easy way to mixed forest? Open Journal of Forestry. 6:281–294. doi:10.4236/ojf.2016.64023.
- Holmström E, Gålnander H, Petersson M. 2019. Within-site variation in seedling survival in Norway spruce plantations. Forests. 10. doi:10.3390/f10020181.
- Holmström E, Hjelm K, Johansson U, Karlsson M, Valkonen S, Nilsson U. 2015. Pre-commercial thinning, birch admixture and sprout management in planted Norway spruce stands in South Sweden. Scand J Forest Res. 1–10. doi:10.1080/02827581.2015.1055792.
- Holmström E, Hjelm K, Karlsson M, Nilsson U. 2016b. Scenario analysis of planting density and pre-commercial thinning: will the mixed forest have a chance? Eur J For Res. 1–11. doi:10.1007/s10342-016-0981-8.
- Holmström E, Karlsson M, Nilsson U. 2017. Modeling birch seed supply and seedling establishment during forest regeneration. Ecol Modell. 352:31–39. doi:10.1016/j.ecolmodel.2017.02.027.
- Huuskonen S, Domisch T, Finér L, Hantula J, Hynynen J, Matala J, Miina J, Neuvonen S, Nevalainen S, Niemistö P. 2021. What is the potential for replacing monocultures with mixed-species stands to enhance ecosystem services in boreal forests in Fennoscandia? For Ecol Manag. 479:118558. doi:10.1016/j.foreco.2020.118558.
- Hynynen J, Niemisto P, Vihera-Aarnio A, Brunner A, Hein S, Velling P. 2010. Silviculture of birch (Betula pendula Roth and Betula pubescens Ehrh) northern Europe. Forestry. 83:103–119. doi:10.1093/forestry/cpp035.
- Keren S, Svoboda M, Janda P, Nagel TA. 2020. Modeling tree species count data in the understory and canopy layer of two mixed old-growth forests in the dinaric region. Forests. 11:531. doi:10.3390/f11010004.
- Latif QS, Truex RL, Sparks RA, Pavlacky DC. 2020. Dry conifer forest restoration benefits colorado front range avian communities. Ecol Appl. doi:10.1002/eap.2142.
- Lindbladh M, Axelsson A-L, Hultberg T, Brunet J, Felton A. 2014. From broadleaves to spruce – the borealization of southern Sweden. Scand J Forest Res. 29:686–696. doi:10.1080/02827581.2014.960893.
- Lundmark JE. 1974. Use of site properties for assessing site index in stands of Scots Pine and Norway Spruce. Rapporter och Uppsatser, Institutionen for Vaxtekologi och Marklara, pp. 298. In Swedish.
- Maleki K, Kiviste A. 2016. Individual tree mortality of silver birch (Betula pendula Roth) in Estonia. iForest – Biogeosciences and Forestry. 9:643–651. doi:10.3832/ifor1672-008.
- Manso R, Morneau F, Ningre F, Fortin M. 2015. Effect of climate and intra- and inter-specific competition on diameter increment in beech and oak stands. Forestry Int J Forest Res. 88:540–551. doi:10.1093/forestry/cpv020.
- Naslund M. 1947. [Empirical formulae and tables for determining the volume of standing trees: Scots Pine, Norway Spruce and Birch in southern Sweden and in the whole of the country]. Meddelanden fran Statens Skogsforskningsinstitut 36, pp. 81. Swedish.
- Nilsson P. 2012. Skogsdata: aktuella uppgifter om de svenska skogarna från Riksskogstaxeringen. 2012, Tema: Skogsodling, skogsvård och avverkning. Umeå: Institutionen för skoglig resurshushållning, Sveriges lantbruksuniversitet.
- Nilsson P. 2013. Skogsdata: aktuella uppgifter om de svenska skogarna från Riksskogstaxeringen. 2013, Tema: Olika mått på skogens ålder och trädslagssammansättning Institutionen för skoglig resurshushållning. Umeå: Sveriges lantbruksuniversitet.
- Nilsson U, Luoranen J, Kolstrom T, Orlander G, Puttonen P. 2010. Reforestation with planting in Northern Europe. Scand J Forest Res. 25:283–294. doi:10.1080/02827581.2010.498384.
- R Core Team. 2013. R: A language and environment for statistical computing. Vienna: R Foundation for Statistical Computing.
- SMHI. 2015. Swedish Meteorological and Hydrological Institute In.
- Söderberg U. 1986. Funktioner för skogliga produktionsprognoser: tillväxt och formhöjd för enskilda träd av inhemska trädslag i Sverige = Functions for forecasting of timber yields: increment and form height for individual trees of native species in Sweden. Uppsala: Functions for forecasting of timber yields. SLU.
- Vanhellemont M, Van Acker J, Verheyen K. 2016. Exploring life growth patterns in birch (Betula pendula). Scand J Forest Res. 31:561–567. doi:10.1080/02827581.2016.1141978.