
 ?Mathematical formulae have been encoded as MathML and are displayed in this HTML version using MathJax in order to improve their display. Uncheck the box to turn MathJax off. This feature requires Javascript. Click on a formula to zoom.
ABSTRACT
According to protection targets of EU Biodiversity Strategy 2030, 30% of EU’s land and sea area should be legally protected by 2030. While the actual targets and even terms are still to be defined, the strategy’s possible impacts can be simulated for policy support purposes. The strategy aims to increase protection by setting aside forests and extending closer-to-nature forest management practices. We simulated Finland’s forest resources with the European Forestry Dynamics Model (EFDM) considering the protection targets. According to our simulations, the total growing stock and net present value will be lower with the additional protection than by carrying on the business-as-usual management. The additional protection resulted in intensified harvesting in the remaining forest area available for wood supply with the current harvest level. This may weaken the positive ecological impacts of protection. Reducing the harvest level from the current level is not a likely alternative either, because the demand for biomass is predicted to increase in the future, while the supply is insufficient, and EU policies aim to avoid shifting the negative impacts of resource extraction outside the EU. The feasibility of the additional protection depends on the actual implementation and definitions.
Introduction
The New EU forest strategy for 2030 emphasizes the sustainable use of forests in a way which on one hand creates a competitive basis for the bio-based economy and on the other ensures various other forest functions and ecosystem services (European Commission Citation2021). Recent research has therefore sought to estimate the actual amount of forest biomass available for wood supply and further strives to link it to forest owners’ willingness and costs to mobilize additional biomass from their forests (Jonsson et al. Citation2018; Lawrence Citation2018; Vauhkonen et al. Citation2019; Verkerk et al. Citation2019; Alberdi et al. Citation2020). In any case, increasing biomass production and extraction from forests seem a likely progression (European Commission Citation2018; Material Economics Citation2021).
EU Biodiversity Strategy for 2030 in turn sets targets to protect nature and reverse the degradation of ecosystems (European Commission Citation2015; European Commission Citation2020; DG ENV Citation2021). One target set in the strategy is to legally protect at least 30% of the EU’s land area. One third of the protection (=10%) should be strict protection. Currently, 26% of the EU’s land area is protected through Natura 2000 or national protection schemes, but only 3% is strictly protected. Additional protection is therefore needed to fulfill the strategy’s target at EU level. According to the strategy, as part of strict protection, it will be crucial to define, map, monitor, and strictly protect all the EU’s remaining primary and old-growth forests. Significant areas of other carbon-rich ecosystems such as undrained peatlands should also be strictly protected. The importance of different habitats for contributing to the target varies from one country to another.
In countries with large forest resources like Finland, the targets set for increasing protection focus mainly on forests. Because of the large economic importance of the forest sector for Finland, the targets have an influence on the entire society at different scales. Its economic impact would be on the national economy and employment through the forest industry sector. In addition, forests carry social, welfare, and cultural values (e.g. Bratman et al. Citation2019; Dodev et al. Citation2020; Weinbrenner et al. Citation2021). Forests are thus exposed to environmental, economic, and social pressures whose study is complex.
Balancing the seemingly contradictory targets and understanding the consequences of actions in the long term have been a lively research topic in recent decades (e.g. Mönkkönen et al. Citation2011; Nordström et al. Citation2013; Mönkkönen et al. Citation2014; Eyvindson et al. Citation2018; Eggers et al. Citation2019). Furthermore, there is a need to develop holistic ways to evaluate challenges related to wood production, biodiversity and land scarcity (compare Fischer et al. Citation2014). Scenario analysis has been shown to be a powerful tool for studying dependences in complex situations (Hoogstra-Klein et al. Citation2017). In many studies (e.g. Biber et al. Citation2020; Verboom et al. Citation2007), stratification or extrapolation has been used to produce estimates on the development of forest biodiversity or ecosystem services at European level. For example, in Biber et al. (Citation2020), the analyzes have been based on the country-specific simulation models and the simulations have been made for case study areas. These model outputs for small number of case study areas have been extended to the whole country and further to other comparable biogeographic circumstances outside the target country.
Therefore, there is a need for more harmonized method for evaluating the long-term effects of EU policies on wood production, biodiversity, and different ecosystem services in different European countries. To fill this gap, a general assessment method is needed that can be applied in different countries.
Verkerk et al. (Citation2014) applied a large-scale forest scenario model, EFISCEN (Mohren Citation2003; Schelhaas et al. Citation2007), to assess impacts of intensified protection on ecosystem services provided by European forests. However, to our knowledge, no previous studies have been published to analyze forest protection and management in accordance with the new EU Biodiversity Strategy for 2030 as we do in this study. We conduct a scenario analysis with the European Forestry Dynamics Model (EFDM) (Packalen et al. Citation2014; Sallnäs et al. Citation2015), which shares the same methodology as EFISCEN, but the models differ in respect to, for example, implementation and data needs. First, we examine what are the economic and ecological impacts of the protection if the current harvest level is maintained. Then, we search for maximum sustained harvest levels with the set protection targets.
Scenario analysis
Study area and forest data
Finland is in the boreal vegetation zone of Northern Europe (). The main tree species in Finland are Scots pine (Pinus sylvestris) and Norway spruce (Picea abies), which comprise 50% and 30% of total growing stock, respectively. The remaining 20% are broadleaves, of which 17% are birch (Betula pendula, Betula pubescens). Most of the forests are managed even-aged, but continuous cover regimes are foreseen to increase in the future (e.g. Juutinen et al. Citation2020).
Figure 1. Map of Finland divided into vegetation zones: lightest shade – boreonemoral and southern boreal; middle shade – middle boreal; and darkest shade – northern boreal from south to north [Bio-geographical regions / Source: Finnish Environment Institute].
![Figure 1. Map of Finland divided into vegetation zones: lightest shade – boreonemoral and southern boreal; middle shade – middle boreal; and darkest shade – northern boreal from south to north [Bio-geographical regions / Source: Finnish Environment Institute].](/cms/asset/c55f9969-178f-4d2a-b401-7b8a11048a2b/sfor_a_2229732_f0001_oc.jpg)
Forest land cover 67% of land area including fresh water hereafter referred to as “land area” (Korhonen et al. Citation2021), and 12.6% of forest land is currently protected (Natural Resources Institute Finland Citation2019). The protection of forest land equals to 8.9% of land area. However, the current protection is not spatially evenly distributed: While in the northern boreal vegetation zone, 33.5% of forest land is protected, in the middle boreal, and boreonemoral and southern boreal vegetation zones (hereafter referred to as the “southern boreal zone”), the proportions are only 6.4% and 3.5% respectively.
National forest classification further subdivides forest land into productive (increment at least 1 m3/ha/year) and poorly productive forests (increment 0.1-1 m3/ha/year) in proportions 89% and 11%, respectively. Because harvests and forest management activities are implemented in the productive forest, and current protection would be the same in all scenarios, we limited scenario analysis to the current productive forest area available for wood supply (FAWS). This equated to an area of about 18 million hectares, 81% of forest land, and 54% of land area. Nevertheless, when determining shares of management regimes in scenarios, particularly protection, the entire forest land was considered.
We used the Finnish National Forest Inventory (NFI) field data collected between years 2014 and 2018 (Korhonen et al. Citation2021) which refers to the forest state at year 2016 as the main data source for the estimation of EFDM model components including forest state. These empirical NFI data include several variables describing e.g. land-use, site fertility, forest resources, biodiversity, and forest management recorded at sample plots. A more detailed description of data uses is in Supplement 1.
EFDM model
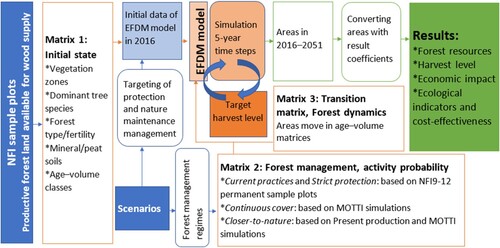
The European Forestry Dynamics Model (EFDM) (Packalen et al. Citation2014; Räty and Kuronen Citation2022) is an area-based matrix model in which forest areas move in predefined stratified matrices, i.e. forest strata. The model has four components to be defined by users (). First, forest areas estimated from NFI data are stratified for the initial state of simulation. In our case, the areas within each forest strata were further distributed into age and volume classes, i.e. matrix cells. Second, forest areas in the cells receive management activity at each simulation step according to activity probabilities which are forest strata and age-volume class specific. Third, forest areas change cells by simulation steps: The change depends on the activity applied as well as on the forest strata and cell in the beginning of the step. Fourth, so-called result coefficient matrices are used to convert stratified area distributions into other variables such as volume classes into growing stock volumes in cubic meters. These coefficients were estimated either using NFI data (deadwood, cutting removal) or simulated data (berry yields and coverages) or their combination (result coefficients in continuous cover forestry regime) by averaging and smoothing over model classes.
Figure 2. Simulation setup: area allocation and data (NFI sample plots, Scenarios, Targeting of protection and nature maintenance management, Initial data of EFDM model in 2016, Forest management regimes); components of the EFDM and simulation (EFDM model, Target harvest level, Matrices 1—3, Simulation 5-year time steps); and results (Areas in 2016—2051, Converting area with result coefficients and Results ).
There were four different forest management regimes for the forests in the EFDM:
Current practices corresponded to even-aged managed commercial forests under the current recommendations (Äijälä et al. Citation2019) according to the NFI.
Strict protection, where forests’ development corresponded to the protected forests measured in the NFI.
CCF (continuous cover forestry) with selective cuttings was first modeled by MOTTI forest stand simulator (Salminen et al. Citation2005; Hynynen et al. Citation2014; Hynynen et al. Citation2015) and then incorporated to the EFDM.
C2N (closer-to-nature), where forests were even-aged managed, but compared to current practices above broadleaves were promoted in the forest management, forests’ rotation was lengthened, and the amount of retention trees was increased.
Scenarios and simulation runs
We assumed in the simulations that the protection targets of EU Biodiversity Strategy for 2030 are implemented by countries as such, each country separately would aim at protecting 10/30% of land area. The protection spreads over all land use classes, not only forests, but the allocations at the EU level or national level have not yet been decided by the time of this study (autumn 2022). Information on the protection in other land use classes was not available, but we assumed it to be in total about 5% of land area, which equates the current protection to 14% of land area. In addition, we combined to the scenarios the national target to increase protection of forest land in the southern and middle boreal zones. Further, we assumed that the protection in other land uses will double to 10% of land area leaving the rest 20% of the protection target for the forest land. Lastly, CCF and C2N managements were assumed to fulfill the requirements for the other legal protection category even though also this is yet to be defined.
These assumptions led to following three scenarios for the FAWS: In the reference scenario called BAU, wood production and protection remained at the current levels. In the two alternative scenarios, we increased protection by allocating parts of the forest area to strict protection and other protection, i.e. CCF and C2N regimes which emphasize biodiversity conservation aspects. In more detail:
BAU (Business-as-Usual, reference scenario): FAWS were managed according to the current practices regime. The strict protection of forest land remained at 9% of land area.
Double (Double strict protection in the South): New additional strict protection was targeted to the southern and middle boreal zones: it was doubled compared to the current protection in these two zones but remained the same in the northern boreal zone. The total strict protection on forest land rose to 11% of the land area. In addition, 2% and 7% of land area was managed according to CCF and C2N regimes, respectively, resulting in total protection of 20% of land area. The current practices regime was conducted on the remaining FAWS (equating to 47% of land area).
All (All forest land was protected): No current practices management regime was applied at all, 12% of the land area was strictly protected, and 10% and 42% of land area was managed according to CCF and C2N, respectively. The total protection increased up to 67% of land area. This is an extreme scenario and not realistic to actualize.
Figure 3. (a) Allocation of productive forests currently available for wood supply to different management regimes, and (b) initial age distribution of area in 2016 in scenarios BAU, Double, and All.
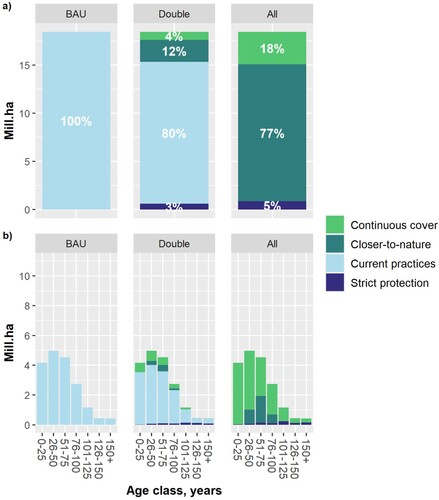
Table 1. Allocation of productive forest land available for wood supply to different forest management regimes in different management scenarios by boreal vegetation zones and total.
According to the last Red List of Finnish species, forests are a primary habitat for one third of endangered species in Finland (Hyvärinen et al. Citation2019). Herb-rich forests with broadleaved trees were the primary habitat for 45%, and old-growth coniferous forests for 40% of endangered species. In addition, one fourth of endangered peatland species grow on wooded peatlands. These forests are also target habitats in the EU Biodiversity Strategy for 2030 and include some priority habitat types of Annex I of the Habitats Directive (European Commission Citation2013). The additional strict protection in the scenarios was therefore chosen from three groups (): (1) Old-growth forests which were older than the threshold age of 100–220 years, depending on the vegetation zone and site type, and had been unmanaged for the last 30 years; (2) herb-rich forests, by favoring broadleaf dominating and/or stout stands; and (3) undrained peatlands that had been unmanaged for the last 30 years. These peatlands contain swamp forests and wooded mires, as well as bog woodland. Together with old-growth forests, these peatland habitats are of great importance for biodiversity, as well as carbon sequestration and storage. In addition, the protection was allocated primarily to the southern and middle boreal zones, where the current protection situation is worse, and the number of endangered species is greater than in the north ().
Table 2. Criteria for selecting strict protection in scenarios by vegetation zones and forest site types, defined either by age (AGE) or diameter at breast height (DBH).
First, these three scenarios were run at a harvest level of 72.4 million m3/year, of which 31.4 million m3/year were sawlogs. This was the average of roundwood removals between 2015 and 2019 (Natural Resources Institute Finland Citation2021a). This first alternative explores if the wood extraction could remain on the previous level and, in addition, how the biodiversity indicators develop at the same time. In other words, the relationship between economic and ecological indicators is explored. The simulation was run by 5-year timesteps for 35 years between 2016 and 2051 – a total of seven timesteps. The harvest level was used as a target in an optimization minimizing the difference between cutting removal and the harvest level. The parameters optimized were separately adjusting the final felling and thinnings. The optimization was made at each simulation time step.
Second, the scenario runs for all three scenario settings were repeated with different harvest levels by stepping up and down from the current harvest level to find the maximum sustained level. The sustained harvest level was defined to be the harvest level that was possible to maintain for at least a 100-year simulation period. However, the results are only presented for the 35-year period from 2016 to 2051. The different levels indicate the impacts of changes in protection the wood production and economics.
Result variables and comparisons
Scenarios were compared with respect to both ecological and economic aspects. Results were estimated to describe forest resources like growing stock volume and age distribution, cuttings like area of cuttings and volume of cutting removal, and ecosystem service-related indicators: volume of deadwood; and berry coverage and yield for bilberry (Vaccinium myrtillus) and cowberry (Vaccinium vitis-idaea). Gross harvest income was estimated as a sum of the harvest incomes for the 5-year timesteps for each scenario. The stumpage prices used to calculate the harvest incomes were mean values estimated from the statistics for 2004–2017 (Natural Resources Institute Finland Citation2021b, ).
Table 3. Stumpage prices of sawlogs and pulpwood (€/m3) linked to management activities.
The estimation of net present value (NPV) considered expenses linked to forest management activities. All income from harvests was stumpage sales, and only final felling activity in current practices and C2N regimes therefore led to costs, which enclosed regeneration, possible soil scarification and ditching, and cleaning of the sapling. These costs depended on vegetation zone, dominant tree species, and forest site type and spread over 0–20 years after the final felling.
NPV was estimated from net harvest incomes (NI), i.e. differences of gross harvest income (R) and silvicultural costs (C). The differences were placed in the middle of 5-year simulation steps and discounted to the year 2016, i.e. the simulation’s starting year:
(1)
(1) where r = interest rate (3, 4, or 5%), i is the simulation timestep, and
is the time in years from the beginning of the simulation to the middle of the ith simulation step.
The cost-effectiveness of protection was measured by an index, in which the indicator values, i.e. deadwood and berry variables, in the alternative scenarios were first compared to the corresponding value in BAU. This difference was then divided by the differences of NPV:
(2)
(2)
Results
Forest resources and cuttings
Current harvest level
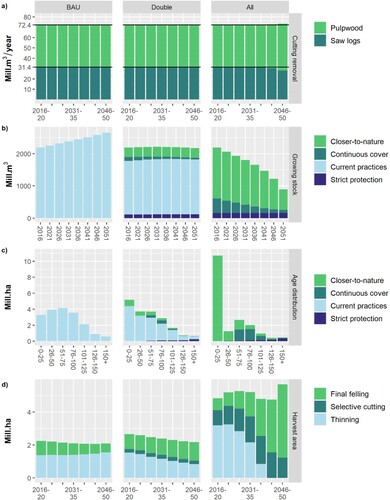
The current harvest level was the same for all scenarios: The total cutting removal was 72.4 million m3/year, of which 31.4 million m3/year were sawlogs (). The gross harvest income was about 2.6, 2.6, and 2.5 billion euros/year for the BAU, Double, and All scenarios respectively. The BAU and Double scenarios were able to maintain the current harvest level in all simulation steps, but the harvest level proved too high for the All scenario. During the last simulation steps, the cutting removal of sawlogs did not reach the target level, even though the harvest areas increased and were double those of the other scenarios. For the other two scenarios, the harvest areas decreased with the simulation steps. The total growing stock volume increased in BAU, stayed roughly constant in Double, and was less than half the initial amount at the end of the simulation in All. These results were aligned with the age distribution of forests by the end of the simulation period: In BAU, the forests aged; in Double, the area in the youngest age class increased, as well as balanced areas in forests more than 100 years old; and in All, the majority of forests were young, under 30 years old.
Figure 4. Results for current harvest level simulations: (a) volume of cutting removal; (b) total growing stock volume; (c) forests’ age distribution in 2051; and (d) area of treatments for scenarios: BAU (Business-as-Usual), Double (double the current strict protection in the South, extent of protection 20% of land area, but no changes in the northern boreal vegetation zone), and All (protection cover entire area) by five-year simulation steps.
Maximum sustained harvest level
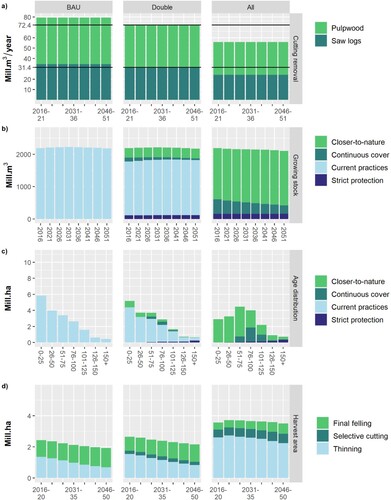
BAU had a higher (79.5 million m3/year), Double the same, and All a lower (55.9 million m3/year) maximum sustained harvest level than the current harvest level of 72.4 million m3/year (). The maximum sustained harvest levels for the scenarios differed by more than 20 million m3/year. The gross harvest income was about 2.9, 2.6, and 1.9 billion euros/year for the BAU, Double, and All scenarios respectively. As in the current harvest level simulation (Chapter 3.1.1) also here the different proportions of management regimes in the scenarios influenced on harvests especially: The distribution of cutting activities and the area managed during periods were largest in the All scenario, even though the cutting removal was the lowest for the same reason as at the current harvest level – selective cuttings. Age distributions at the end of the simulation showed how, on one hand, in the Double and All scenarios, the protected forests increased the forest area in the oldest age classes, and on other, the impact of different proportions of harvest types in scenarios on forests’ structure. It should be noted that the age in the CCF regime was not linked to the actual forests’ state and volume in this simulation setup. However, the growing stock volume decreased toward the end of simulation but remained close to the initial value in all scenarios.
Figure 5. Results for maximum sustained harvest level simulations: (a) volume of cutting removal; (b) total growing stock volume; (c) forests’ age distribution in 2051; and (d) area of treatments for scenarios: BAU (Business-As-Usual), Double (double the current strict protection, extent of protection 20% of land area, but no changes in northern boreal vegetation zone), and All (protection cover entire area) in five-year simulation steps.
NPVs, ecosystem indicators, and cost-effectiveness indices
The NPVs of scenarios were ranked in the same order, regardless of the interest rate and harvest level: BAU, Double, and All in descending order (). Biodiversity and ecosystem service indicators were estimated for the initial state of the scenario runs (in 2016), which was the same for all scenarios, and at the end of the runs in 2051 (). Compared to the initial values, the development of indicators was generally positive. The bilberry yield and coverage and cowberry coverage were smaller, but in contrast, cowberry yield was higher when moving from scenario BAU via Double to All at the current harvest level. At the maximum harvest level, the order was the opposite. This implies that the extent of clear cutting and thus forest structure have an impact on these indicators. Instead, the impacts on the amount of deadwood were minor. The largest relative change was observed in the amount of deadwood, which increased from an initial value of 4.3 m3/ha to 11.1 m3/ha in the All scenario.
Table 4. Net present value of scenarios with different interest rates and harvest levels in billions of euros.
Table 5. Values of ecosystem service indicators at the initial state in 2016 and in the end of the simulation in 2051, when scenarios were run at current or scenario-specific maximum sustained harvest levels.
The differences in the cost efficiency indices between scenarios were small and generally slightly positive at the maximum sustained harvest level (). At the current harvest level, the indices were larger: Cowberry yield and deadwood had positive cost-effectiveness values in contrast to the other indices.
Table 6. Cost-effectiveness indices (Indicator unit/billion euros) for ecosystem service at current and scenario-specific maximum sustained harvest levels with an interest rate of 3%.
Discussion and conclusions
In Finland, maintaining the current harvest level and increasing protection to the level suggested by EU Biodiversity Strategy for 2030 as a combination of strict and other protection could be feasible. The decrease of total growing stock and increase of young forests compared to the reference scenario (BAU) were the long-term impacts of these actions on the forest resources. This was due to the increased total area of final felling required to achieve the target harvest level. In contrast, the areas of old-growth forests were larger in the alternative scenarios than in BAU because of additional protection.
Deadwood and cowberry yield amounts increased, but the other studied ecosystem service indicators decreased as the protection was extended, keeping the current level of harvest at the same time. The increased final felling in alternative scenarios was better suited for cowberry than bilberry, explaining the different developments also observed by Eyvindson et al. (Citation2018) and Miina et al. (Citation2021). The concurrently increasing protection and total area of final felling were also reflected in the NPVs. Even if the target harvest level was set at the same level for all scenarios, the NPVs decreased as the extent of protection increased, indicating the need to harvest the sites with smaller cutting removal to achieve the target harvest level. The scenario with the largest protection (All) did not achieve the target harvest level during the last timesteps, and the opportunity cost of protection in terms of decreased NPV was therefore significantly higher in this scenario than in the less ambitious protection scenario (Double).
In our study, the maximum sustained harvest level was defined as the level at which the harvests could be carried out for a 100-year period. The current harvest level was also the maximum sustained level for the Double scenario, in which the area of protected forests increased to the level proposed by EU Biodiversity Strategy for 2030 for the EU’s entire land area. With the current forest management practices and forest protection level, the harvest level could be increased by 10%. The same level was previously simulated with the MELA model (Hirvelä et al. Citation2017; Natural Resources Institute Finland Citation2020). When we extended the protection to the whole forest land, the maximum sustained harvest level was reduced by 23% compared to the current harvest level. This means that the socioeconomic impacts of increasing the protection can be remarkable in Finland.
According to cost-effectiveness indices, the scenario with a protection limited to 20% of the land area (Double) was more cost-effective with regard to deadwood and cowberry yield than the scenario with 100% of protection (All) at the current harvest level (). However, the other cost-effective indices decreased, and the overall outcome of ecosystem services was thus twofold. As the protection was extended, the pressure to manage the remaining forest area left for wood production more intensively increased, resulting in biodiversity leakage because of decreasing forest age in the remaining production forests (compare Fischer et al. Citation2014). The possible positive ecological development thus gained in protected areas may be nullified in the other management regimes. Interestingly, the cost-effectiveness indices at the maximum sustained harvest level were considerably smaller than at the current harvest level, a reflection of the fact that the opportunity cost of protection increased considerably when the harvesting level was set to the level of the maximum sustained yield.
Our simulations had the following limitations, which at the same time address the directions for future research: (1) We did not analyze the effect of a decreasing area of commercial forests on the supply of timber. In other words, the harvesting level was set as constant, independent from the harvesting potential. In reality, the decreasing area of commercial forests (FAWS) may lead to increased timber prices and reduced demand for domestic wood and increased harvests in other countries to fulfill the raw material gap on the markets; (2) We did not consider any climate change effects like a possible increase in growth, pest, and forest damage risks or land use changes. In contrast, the forests were assumed to develop as in the last two decades. However, technically all these could be considered with the EFDM (Du et al. Citation2021; Räty and Kuronen Citation2022); (3) The berry models were not defined for peatlands, and the dynamics shown therefore concern only mineral soils (Miina et al. Citation2009; Turtiainen et al. Citation2013), and it is therefore better to compare the relative differences between scenarios than their absolute values; (4) In the allocation of protection the local land use (Pohjanmies et al. Citation2017) or different scale spatial aspects such as site connectivity (Halme et al. Citation2013) could not be considered, because the EFDM has no spatial components. However, the spatial allocation could be considered for both the initial state and the simulation results in a separate analysis in future studies; (5) More detailed analysis of the development of forests and their species composition within the protected area network and the effects of C2N and CCF on biodiversity are needed over a wider timespan than 35 years, preferably over a couple of rotation periods.
Further, our empirical data were insufficient for estimating the CCF regime in a similar manner as the other regimes. Instead, it was implemented by relying on models of just one possible CCF management alternative, and its diversity could therefore not be simulated. The decreasing productivity of continuous cover forests had an impact on our scenario results. In contrast to previous stand level optimization studies, where CCF has generally – depending on stand characteristics and economic factors such as interest rate level – been more profitable option than rotation forestry (e.g. Tahvonen and Rämö Citation2016), CCF resulted in lower NPV than rotation forestry in our study. However, we based the productivity on recent research in boreal vegetation zone (Hynynen et al. Citation2019; Bianchi, et al. Citation2020a) and similar implications have been reported from Sweden as well (Lundqvist et al. Citation2013). Proportion of CCF in the boreal vegetation zone is still marginal (Mason et al. Citation2022) and knowledge gaps both in respect to yield and biodiversity are evident (Ekholm et al. Citation2023), but CCF is being extensively researched. This is expected to provide data and models in the coming years to complement the current knowledge of, e.g. stand dynamics (Hynynen et al. Citation2019; Bianchi, et al. Citation2020b; Valkonen et al. Citation2020), biodiversity (Seedre et al. Citation2018; Savilaakso et al. Citation2021), and growing stock, biomass, and yield (Peura et al. Citation2018; Kellomäki et al. Citation2019; Kumpu et al. Citation2020; Juutinen et al. Citation2021). However, based on the current knowledge the best overall biodiversity impacts can be achieved with a mosaic of different forests and managements within landscapes (Savilaakso et al. Citation2021).
Still, the alternative scenarios including additional protection were too optimistic: Widescale protection cannot be implemented without compensation and incentives for the forest owners. Understanding the factors that drive forest owners’ decision making, their motivation to manage their forests, and how their behavior could be supported with incentives and guidance are fundamental for success (e.g. Deuffic et al. Citation2018; Juutinen et al. Citation2020; Koskela and Karppinen Citation2021; Mäntymaa et al. Citation2018; Miljand et al. Citation2021; Mostegl et al. Citation2019; Pynnönen et al. Citation2018; Takala et al. Citation2019). Furthermore, as the financial resources to support protection are limited, their most efficient targeting in respect of the impacts should be studied separately (Mönkkönen et al. Citation2011; Ranius et al. Citation2016; Manhães et al. Citation2018). A more comprehensive economic analysis would require the expansion of the impact assessment to the entire forest sector, from the global timber markets to the national forest industry production and employment (Laturi et al. Citation2016; Jonsson et al. Citation2016; Kallio et al. Citation2018), and to the regional level (Pohjola et al. Citation2018; Vauhkonen and Packalen Citation2019).
Our simulation shows that the EFDM offers a tool for scenario analysis with a large-scale approach for policy support. Due to its generic formulation, it is applicable to any country. The data sources and parametrization of the model can differ between countries maximizing the data utilization and model fit to the local conditions. It could therefore be used for a harmonized EU-wide impact assessment of EU Biodiversity Strategy for 2030 as it was previously used for biomass supply estimation (Vauhkonen et al. Citation2019). We performed our analysis, when the strategy and its implementation were, as they still are, finding their formulation. For example, the strategy lacks priorities and definitions. In public discussion even more radical suggestions for the national implementation of strategy, such as increasing the strict protection of forest land up to 10% by the provinces, have been made (Kotiaho et al. Citation2021). However, these analyzes can later be reformulated accordingly and rerun, despite the fact that the analyzes can be used when preparing and considering the strategy’s national implementation.
We conclude that the biodiversity goals outlined in the EU Biodiversity Strategy for 2030 could have a remarkable socioeconomic impact in Finland. The current harvesting level can be maintained, and forest protection extended from the current level at the same time. However, the EU biodiversity goals are merely area goals that do not ensure that the degradation of biodiversity can be halted. Our results showed some increase in ecological indicators due to the protection, but further research is needed to investigate this outcome in more detail, using a forest sector model describing the wood product markets, and how the potential biodiversity leakage could influence the effectiveness of additional protection. Our results also indicate that increasing the harvest from the current level to support bioeconomy development conflicts with increasing protection by decreasing the age of production forests. These results show that it is impossible to increase wood production and forest protection at the same time without conflict. Policymakers therefore need to prioritize their goals and ensure that policy instruments are implemented coherently.
Disclosure statement
No potential conflict of interest was reported by the author(s).
Data availability statement
The data that support the findings of this study are available from the corresponding author, M. R., upon reasonable request.
Additional information
Funding
References
- Äijälä O, Koistinen A, Sved J, Vanhatalo K, Väisänen P. 2019. Best practices in forest management [In Finnish: Metsänhoidon suositukset] [Internet]. Finland; [accessed 2021 Jun 30]. https://tapio.fi/wp-content/uploads/2020/09/Metsanhoidon_suositukset_Tapio_2019.pdf.
- Alberdi I, Bender S, Riedel T, Avitable V, Boriaud O, Bosela M, Camia A, Cañellas I, Castro Rego F, Fischer C, et al. 2020. Assessing forest availability for wood supply in Europe. Forest Policy Econ. 111:102032. doi:10.1016/j.forpol.2019.102032.
- Bianchi S, Huuskonen S, Siipilehto J, Hynynen J. 2020a. Differences in tree growth of Norway spruce under rotation forestry and continuous cover forestry. For Ecol Manag. 458: article id 117689. doi:10.1016/j.foreco.2019.117689.
- Bianchi S, Myllymäki M, Siipilehto J, Salminen H, Hynynen J, Valkonen S. 2020b. Comparison of spatially and nonspatially explicit nonlinear mixed effects models for Norway spruce individual tree growth under single-tree selection. Forests. 11(12):1338. doi:10.3390/f11121338.
- Biber P, Felton A, Nieuwenhuis M, Lindbladh M, Black K, Bahýl J, Bingöl Ö, Borges JG, Botequim B, Brukas V, et al. 2020. Forest biodiversity, carbon sequestration, and wood production: modeling synergies and trade-offs for Ten forest landscapes across Europe. Front Ecol Evol. 8:547696. doi:10.3389/fevo.2020.547696.
- Bratman GN, Anderson CB, Berman MG, Cochran B, de Vries S, Flanders J, Folke C, Frumkin H, Gross JJ, Hartig T, et al. 2019. Nature and mental health: An ecosystem service perspective. Sci Adv. 5(7):eaax0903. doi:10.1126/sciadv.aax0903.
- Deuffic P, Sotirov M, Arts B. 2018. “Your policy, my rationale”. How individual and structural drivers influence European forest owners’ decisions. Land Use Policy. 79:1024–1038. doi:10.1016/j.landusepol.2016.09.021.
- DG ENV. 2021. EU Biodiversity Strategy for 2030: bringing nature back into our lives [Internet]. LU: Publications Office of the European Union; [accessed 2021 Jul 20]. https://data.europa.eu/doi/10.2779677548.
- Dodev Y, Zhiyanski M, Glushkova M, Shin WS. 2020. Forest welfare services – the missing link between forest policy and management in the EU. Forest Policy Econ. 118:102249. doi:10.1016/j.forpol.2020.102249.
- Du X, Chen X, Zeng W, Meng J. 2021. A climate-sensitive transition matrix growth model for uneven-aged mixed-species oak forests in north China. Forestry: Int J For Res. 94(2):258–277. doi:10.1093/forestry/cpaa035.
- Eggers J, Holmgren S, Nordström E-M, Lämås T, Lind T, Öhman K. 2019. Balancing different forest values: evaluation of forest management scenarios in a multi-criteria decision analysis framework. For Policy Econ. 103:55–69. doi:10.1016/j.forpol.2017.07.002.
- Ekholm A, Lundqvist L, Petter Axelsson E, Egnell G, Hjältén J, Lundmark T, Sjögren J. 2023. Long-term yield and biodiversity in stands managed with the selection system and the rotation forestry system: A qualitative review. For Ecol Manag. 537:120920. doi:10.1016/j.foreco.2023.120920.
- European Commission. 2013. Interpretation manual of European Union habitats [internet]. Brussels: EUR28 European Commission DG Environment Nature ENV B.3. https://ec.europa.eu/environment/nature/legislation/habitatsdirective/docs/Int_Manual_EU28.pdf.
- European Commission. 2015. Report from the commission to the European parliament and the council: The mid-term review of the EU biodiversity strategy to 2020 [internet]. Brussels: European Commission; [accessed 2021 Jul 20]. https://eur-lex.europa.eu/legal-content/EN/TXT/?uri=CELEX%3A52015DC0478.
- European Commission. 2018. Communication from the Commission: A Clean Planet for all: A European strategic long-term vision for a prosperous, modern, competitive and climate neutral economy [Internet]. Brussels; [accessed 2021 Jul 21]. https://eur-lex.europa.eu/legal-content/EN/TXT/HTML/?uri=CELEX:52018DC0773&from=EN.
- European Commission. 2020. Communication from the commission to the European parliament, the council, the European economic and social committee and the committee of the regions: EU biodiversity strategy for 2030 - bringing nature back into our lives [internet]. Brussels; [accessed 2021 Jan 6]. https://ec.europa.eu/info/sites/default/files/communication-annex-eu-biodiversity-strategy-2030_en.pdf.
- European Commission. 2021. Communication from the commission to the European parliament, the council, the European economic and social committee and the committee of the region: New EU forest strategy for 2030 [internet]. Brussels; [accessed 2021 Jul 20]. https://ec.europa.eu/info/files/communication-new-eu-forest-strategy-2030_en.
- Eyvindson K, Repo A, Mönkkönen M. 2018. Mitigating forest biodiversity and ecosystem service losses in the era of bio-based economy. Forest Policy Econ. 92:119–127. doi:10.1016/j.forpol.2018.04.009.
- Fischer J, Abson DJ, Butsic V, Chappell MJ, Ekroos J, Hanspach J, Kuemmerle T, Smith HG, von Wehrden H. 2014. Land sparing versus land sharing: moving forward. Conserv Lett. 7(3):149–157. doi:10.1111/conl.12084.
- Halme P, Allen KA, Auniš A, Bradshaw RHW, Brumelis G, Čada V, Clear JL, Eriksson A-M, Hannon G, Hyvärinen E, et al. 2013. Challenges of ecological restoration: lessons from forests in Northern Europe. Biol Conserv. 167:248–256. doi:10.1016/j.biocon.2013.08.029.
- Hirvelä H, Härkönen K, Lempinen R, Salminen O. 2017. MELA2016: Reference Manual. Nat Resour Bioeconomy Stud 72017 [Internet]. [accessed 2021 Jun 7]. https://jukuri.luke.fi/handle/10024/538149.
- Hoogstra-Klein MA, Hengeveld GM, de Jong R. 2017. Analysing scenario approaches for forest management — One decade of experiences in Europe. Forest Policy Econ. 85(Part 2):222–234. doi:10.1016/j.forpol.2016.10.002.
- Hynynen J, Eerikäinen K, Mäkinen H, Valkonen S. 2019. Growth response to cuttings in Norway spruce stands under even-aged and uneven-aged management. For Ecol Manag. 437:314–323. doi:10.1016/j.foreco.2018.12.032.
- Hynynen J, Salminen H, Ahtikoski A, Huuskonen S, Ojansuu R, Siipilehto J, Lehtonen M, Eerikäinen K. 2015. Long-term impacts of forest management on biomass supply and forest resource development: a scenario analysis for Finland. Eur J For Res. 134(3):415–431. doi:10.1007/s10342-014-0860-0.
- Hynynen J, Salminen H, Ahtikoski A, Huuskonen S, Ojansuu R, Siipilehto J, Lehtonen M, Rummukainen A, Kojola S, Eerikäinen K. 2014. Scenario analysis for the biomass supply potential and the future development of Finnish forest resources [Internet]. [accessed 2021 Apr 29]. https://jukuri.luke.fi/handle/10024/536208.
- Hyvärinen E, Juslén A, Kemppainen E, Uddström A, Liukko U-M. 2019. The Red List of Finnish Species 2019 [In Finnish: Suomen lajien uhanalaisuus – Punainen kirja 2019] [Internet]. Finland: Ympäristöministeriö & Suomen ympäristökeskus. http://hdl.handle.net/10138/299501.
- Jonsson R, Blujdea VNB, Fiorese G, Pilli R, Rinaldi F, Baranzelli C, Camia A. 2018. Outlook of the European forest-based sector: forest growth, harvest demand, wood-product markets, and forest carbon dynamics implications. iForest – Biogeosci Forestry. 11(2):315-328. doi:10.3832/ifor2636-011.
- Jonsson R, Rinaldi F, Räty M, Sallnäs O. 2016. Integrating forest-based industry and forest resource modeling. iForest – Biogeosci Forestry. 9(5):743–750. doi:10.3832/ifor1961-009.
- Juutinen A, Shanin V, Ahtikoski A, Rämö J, Mäkipää R, Laiho R, Sarkkola S, Laurén A, Penttilä T, Hökkä H, Saarinen M. 2021. Profitability of continuous-cover forestry in Norway spruce dominated peatland forest and the role of water table. Can J For Res. 51(6):859–870. doi:10.1139/cjfr-2020-0305.
- Juutinen A, Tolvanen A, Koskela T. 2020. Forest owners’ future intentions for forest management. Forest Policy Econ. 118:102220. doi:10.1016/j.forpol.2020.102220.
- Kallio AMI, Solberg B, Käär L, Päivinen R. 2018. Economic impacts of setting reference levels for the forest carbon sinks in the EU on the European forest sector. Forest Policy Econ. 92:193–201. doi:10.1016/j.forpol.2018.04.010.
- Kellomäki S, Strandman H, Peltola H. 2019. Effects of even-aged and uneven-aged management on carbon dynamics and timber yield in boreal Norway spruce stands: a forest ecosystem model approach. Forestry: Int J Forest Res. 92(5):635–647. doi:10.1093/forestry/cpz040.
- Korhonen KT, Ahola A, Heikkinen J, Henttonen HM, Hotanen J-P, Ihalainen A, Melin M, Pitkänen J, Räty M, Sirviö M, Strandström M. 2021. Forests of Finland 2014–2018 and their development 1921–2018. Silva Fenn. 55(5):article id 897. doi:10.14214/sf.10662.
- Koskela T, Karppinen H. 2021. Forest owners’ willingness to implement measures to safeguard biodiversity: values, attitudes, ecological worldview and forest ownership objectives. Small-Scale Forestry. 20(1):11–37. doi:10.1007/s11842-020-09454-5.
- Kotiaho JS, Ahlvik L, Bäck J, Hohti J, Jokimäki J, Kallio KP, Ketola T, Kulmala L, Lakka H-K, Lehikoinen A, et al. 2021. Metsäluonnon turvaava suojelun kohdentaminen Suomessa. Suom Luontopaneelin Julk 42021 [Internet]. doi:10.17011/jyx/SLJ/2021/4.
- Kumpu A, Piispanen R, Berninger F, Saarinen J, Mäkelä A. 2020. Biomass and structure of Norway spruce trees grown in uneven-aged stands in southern Finland. Scand J For Res. 35(5–6):252–261. doi:10.1080/02827581.2020.1788138.
- Laturi J, Lintunen J, Uusivuori J. 2016. Modeling the economics of the reference levels for forest management emissions in the eu. Clim Change Econ. 07(03):1650006. doi:10.1142/S2010007816500068.
- Lawrence A. 2018. Do interventions to mobilize wood lead to wood mobilization? A critical review of the links between policy aims and private forest owners’ behaviour. Forestry: Int J Forest Res. 91(4):401–418. doi:10.1093/forestry/cpy017.
- Lundqvist L, Spreer S, Karlsson C. 2013. Volume production in different silvicultural systems for 85 years in a mixed picea abies–pinus sylvestris forest in central Sweden. Silva Fenn. 47(1):article id 897. doi:10.14214/sf.897.
- Manhães AP, Loyola R, Mazzochini GG, Ganade G, Oliveira-Filho AT, Carvalho AR. 2018. Low-cost strategies for protecting ecosystem services and biodiversity. Biol Conserv. 217:187–194. doi:10.1016/j.biocon.2017.11.009.
- Mäntymaa E, Juutinen A, Tyrväinen L, Karhu J, Kurttila M. 2018. Participation and compensation claims in voluntary forest landscape conservation: The case of the ruka-kuusamo tourism area, Finland. J Forest Econ. 33(1):14–24. doi:10.1016/j.jfe.2018.09.003.
- Mason WL, Diaci J, Carvalho J, Valkonen S. 2022. Continuous cover forestry in Europe: usage and the knowledge gaps and challenges to wider adoption. Forestry: Int J Forest Res. 95(1):1–12. doi:10.1093/forestry/cpab038.
- Material Economics. 2021. EU biomass use in a net-zero economy - A course correction for EU biomass [Internet]. Sweden. https://media.sitra.fi/2021/06/28151630/material-economics-eu-biomass-use-in-a-net-zero-economy.pdf.
- Miina J, Bohlin I, Lind T, Dahlgren J, Härkönen K, Packalen T, Tolvanen A. 2021. Lessons learned from assessing the cover and yield of bilberry and lingonberry using the national forest inventories in Finland and Sweden. Silva Fenn. 55(5):article id 10573. doi:10.14214/sf.10573.
- Miina J, Hotanen J-P, Salo K. 2009. Modelling the abundance and temporal variation in the production of bilberry (vaccinium myrtillus L.) in Finnish mineral soil forests. Silva Fenn. 43(4):577–593. doi:10.14214/sf.181.
- Miljand M, Bjärstig T, Eckerberg K, Primmer E, Sandström C. 2021. Voluntary agreements to protect private forests – A realist review. Forest Policy Econ. 128:102457. doi:10.1016/j.forpol.2021.102457.
- Mohren GMJ. 2003. Large-scale scenario analysis in forest ecology and forest management. Forest Policy Econ. 5(2):103–110. doi:10.1016/S1389-9341(03)00016-9.
- Mönkkönen M, Juutinen A, Mazziotta A, Miettinen K, Podkopaev D, Reunanen P, Salminen H, Tikkanen O-P. 2014. Spatially dynamic forest management to sustain biodiversity and economic returns. J Environ Manag. 134:80–89. doi:10.1016/j.jenvman.2013.12.021.
- Mönkkönen M, Reunanen P, Kotiaho JS, Juutinen A, Tikkanen O-P, Kouki J. 2011. Cost-effective strategies to conserve boreal forest biodiversity and long-term landscape-level maintenance of habitats. Eur J For Res. 130(5):717–727. doi:10.1007/s10342-010-0461-5.
- Mostegl NM, Pröbstl-Haider U, Jandl R, Haider W. 2019. Targeting climate change adaptation strategies to small-scale private forest owners. Forest Policy Econ. 99:83–99. doi:10.1016/j.forpol.2017.10.001.
- Natural Resources Institute Finland. 2019. Official statistics of Finland (OSF): Forest protection [web publication] [Internet]. Helsinki: Natural Resources Institute Finland; [accessed 2021 Oct 6]. https://stat.luke.fi/en/forest-protection.
- Natural Resources Institute Finland. 2020. Felling potential estimates [web publication] [Internet]. Helsinki: Natural Resources Institute Finland; [accessed 2021 Sep 29]. https://www.luke.fi/en/natural-resources/forest/forest-resources-and-forest-planning/felling-potential-estimates/.
- Natural resources institute Finland. 2021a. Official Statistics of Finland (OSF): Total roundwood removals and drain [web publication] [Internet]. Helsinki: Natural Resources Institute Finland; [accessed 2021 Sep 29]. https://statdb.luke.fi/PXWeb/pxweb/en/LUKE/.
- Natural Resources Institute Finland. 2021b. Official statistics of Finland (OSF): stumpage earnings [internet]. Helsinki: Natural Resources Institute Finland; [accessed 2021 Oct 20]. https://stat.luke.fi/en/stumpage-earnings.
- Nordström E-M, Holmström H, Öhman K. 2013. Evaluating continuous cover forestry based on the forest owner’s objectives by combining scenario analysis and multiple criteria decision analysis. Silva Fenn. 47(4) article id 1046. doi:10.14214/sf.1046.
- Packalen T, Sallnäs O, Sirkiä S, Korhonen KT, Salminen O, Vidal C, Robert N, Colin A, Belouard T, Schadauer K, et al. 2014. The European forestry dynamics model: concept, design and results of first case studies. EUR – Sci Tech Res Rep. doi:10.2788/153990.
- Peura M, Burgas D, Eyvindson K, Repo A, Mönkkönen M. 2018. Continuous cover forestry is a cost-efficient tool to increase multifunctionality of boreal production forests in fennoscandia. Biol Conserv. 217:104–112. doi:10.1016/j.biocon.2017.10.018.
- Pohjanmies T, Eyvindson K, Triviño M, Mönkkönen M. 2017. More is more? forest management allocation at different spatial scales to mitigate conflicts between ecosystem services. Landsc Ecol. 32(12):2337–2349. doi:10.1007/s10980-017-0572-1.
- Pohjola J, Laturi J, Lintunen J, Uusivuori J. 2018. Immediate and long-run impacts of a forest carbon policy – a market-level assessment with heterogeneous forest owners. J Forest Econ. 32(1):94–105. doi:10.1016/j.jfe.2018.03.001.
- Pynnönen S, Paloniemi R, Hujala T. 2018. Recognizing the interest of forest owners to combine nature-oriented and economic uses of forests. Small-Scale Forestry. 17(4):443–470. doi:10.1007/s11842-018-9397-2.
- Ranius T, Korosuo A, Roberge J-M, Juutinen A, Mönkkönen M, Schroeder M. 2016. Cost-efficient strategies to preserve dead wood-dependent species in a managed forest landscape. Biol Conserv. 204:197–204. doi:10.1016/j.biocon.2016.10.017.
- Räty M, Kuronen M. 2022. Efdm–An R package offering a scenario tool beyond forestry. PLoS One. 17(8):e0264380. doi:10.1371/journal.pone.0264380.
- R Core Team. 2021. R: A language and environment for statistical computing. R foundation for statistical computing [internet]. Vienna, Austria. https://www.r-project.org/.
- Sallnäs O, Berger A, Räty M, Trubins R. 2015. An area-based matrix model for uneven-aged forests. Forests. 6(5):1500–1515. doi:10.3390/f6051500.
- Salminen H, Lehtonen M, Hynynen J. 2005. Reusing legacy FORTRAN in the MOTTI growth and yield simulator. Comput Electron Agric. 49(1):103–113. doi:10.1016/j.compag.2005.02.005.
- Savilaakso S, Johansson A, Häkkilä M, Uusitalo A, Sandgren T, Mönkkönen M, Puttonen P. 2021. What are the effects of even-aged and uneven-aged forest management on boreal forest biodiversity in fennoscandia and European Russia? A systematic review. Environ Evidence. 10(1):1. doi:10.1186/s13750-020-00215-7.
- Schelhaas MJ, Eggers J, Lindner M, Nabuurs GJ, Pussinen A, Päivinen R, Schuck A, Verkerk PJ, van der Werf DC, Zudin S. 2007. Model documentation for the European Forest Information Scenario model (EFISCEN 3.1.3) [Internet]. Wageningen: Alterra; [accessed 2020 Nov 6]. https://edepot.wur.nl/31239.
- Seedre M, Felton A, Lindbladh M. 2018. What is the impact of continuous cover forestry compared to clearcut forestry on stand-level biodiversity in boreal and temperate forests? A systematic review protocol. Environ Evidence. 7(1):7–28. doi:10.1186/s13750-018-0138-y.
- Tahvonen O, Rämö J. 2016. Optimality of continuous cover vs. clear-cut regimes in managing forest resources. Can J For Res. 46(7):891–901. doi:10.1139/cjfr-2015-0474.
- Takala T, Hujala T, Tanskanen M, Tikkanen J. 2019. Competing discourses of the forest shape forest owners’ ideas about nature and biodiversity conservation. Biodivers Conserv. 28(13):3445–3464. doi:10.1007/s10531-019-01831-7.
- Turtiainen M, Miina J, Salo K, Hotanen J-P. 2013. Empirical prediction models for the coverage and yields of cowberry in Finland. Silva Fenn. 47(3):article id 1005. doi:10.14214/sf.1005.
- Valkonen S, Aulus Giacosa L, Heikkinen J. 2020. Tree mortality in the dynamics and management of uneven-aged Norway spruce stands in southern Finland. Eur J For Res. 139(6):989–998. doi:10.1007/s10342-020-01301-8.
- Vauhkonen J, Berger A, Gschwantner T, Schadauer K, Lejeune P, Perin J, Pitchugin M, Adolt R, Zeman M, Johannsen VK, et al. 2019. Harmonised projections of future forest resources in Europe. Ann For Sci. 76(3):79. doi:10.1007/s13595-019-0863-6.
- Vauhkonen J, Packalen T. 2019. Shifting from even-aged management to less intensive forestry in varying proportions of forest land in Finland: impacts on carbon storage, harvest removals, and harvesting costs. Eur J For Res. 138(2):219–238. doi:10.1007/s10342-019-01163-9.
- Verboom J, Alkemade R, Klijn J, Metzger MJ, Reijnen R. 2007. Combining biodiversity modeling with political and economic development scenarios for 25 EU countries. Ecol Econ. 62(2):267–276. doi:10.1016/j.ecolecon.2006.04.009.
- Verkerk PJ, Fitzgerald JB, Datta P, Dees M, Hengeveld GM, Lindner M, Zudin S. 2019. Spatial distribution of the potential forest biomass availability in Europe. Forest Ecosystems. 6(1):5. doi:10.1186/s40663-019-0163-5.
- Verkerk PJ, Mavsar R, Giergiczny M, Lindner M, Edwards D, Schelhaas MJ. 2014. Assessing impacts of intensified biomass production and biodiversity protection on ecosystem services provided by European forests. Ecosystem Serv. 9:155–165. doi:10.1016/j.ecoser.2014.06.004.
- Weinbrenner H, Breithut J, Hebermehl W, Kaufmann A, Klinger T, Palm T, Wirth K. 2021. “The forest Has become Our New living room” – The critical importance of urban forests during the COVID-19 pandemic. Front Forests Global Change. 4:672909. doi:10.3389/ffgc.2021.672909.