
ABSTRACT
Tree establishment on peatlands has various adverse effects on the environment, with one of the most significant being their transformation from carbon sinks to carbon sources. This transformation has largely been instigated by economic-driven ditching initiatives. In this study, 80 peat-rooted pine seedlings were subjected to hydrological scenarios corresponding to natural, ditched, and rewetted conditions to investigate how different management strategies affect tree growth and survival. The study was conducted in a greenhouse where all plants were exposed to identical conditions except for the water level, and focused on factors like stomatal conductance, plant survival, length, biomass, and radial tree growth. Wet conditions, specifically treatments rewetted and natural, resulted in consistently lower stomatal conductance compared to drier treatments. Plant survival was affected, with 15 deaths in the rewetted and 2 in natural groups. Moreover, length, biomass, radial growth, and cell formation were significantly lower for the groups exposed to wet conditions. Rewetting can therefore effectively control tree colonisations, and thereby preventing water consumption, litter fertilisation, and other positive feedback effects for the trees that might be negative for the carbon uptake and biodiversity in peatlands. This study thereby offers valuable insights for rewetting initiatives in tree colonised peatland ecosystems.
Introduction
Peatlands, which frequently is used as a collective term for wetlands with organic soils exceeding 30 cm in depth, occupy a mere fraction of Earth’s terrestrial surface accounting for less than 3%, but still house approximately 30% of the total soil carbon pool (Wieder and Vitt Citation2006; Yu Citation2012; Escobar et al. Citation2022). Peatlands are thus essential actors in the global carbon cycle (Gorham Citation1991; Hugelius et al. Citation2020). Over the past century, extensive ditching projects targeting peatlands and their surrounding areas have been systematically undertaken with the goals of expanding agricultural lands, enhancing forest productivity, and extracting peat (Montanarella et al. Citation2006; Laine et al. Citation2009). At present, about 30% of the peatlands in the Nordic and Baltic countries have been ditched (Laine et al. Citation2009), resulting in increased degradation of peat soils as well as emissions of greenhouse gases (GHGs) such as carbon dioxide CO2 and nitrous oxide N2O (Klemedtsson et al. Citation2005; Kasimir et al. Citation2018). However, changes in carbon storage are also dependent on the input of new carbon into the system through net primary production. We therefore see a need for further studies made in the context of causes of pine colonisation and its effects on peatland ecosystem sustainability.
During the past century, numerous ditching initiatives have been deliberately done to increase the forest productivity (Roulet and Moore Citation1995; Nuutinen et al. Citation2000). As a result, tree colonisation has unintentionally increased due to drier surface conditions on both ditched and undisturbed peatlands, with Scots pine (Pinus sylvestris L.) dominating the accelerated colonisation observed in numerous Boreal peatlands (Edvardsson et al. Citation2015; Ratcliffe et al. Citation2017; Lamentowicz et al. Citation2020). The tree colonisation may also be exaggerated by climate change and have significant effects on entire peatland ecosystems since the trees absorb large amounts of water, and shade native water-demanding peatland vegetation (Stelling et al. Citation2023). This causes a further decrease in water-table levels which, except from increasing GHG emission, also makes the peatlands more vulnerable to fires (Turetsky et al. Citation2011; Sutheimer et al. Citation2021). Moreover, tree colonisation may cause soil degradation since the root systems can disturb the structure of the peat soil and thereby accelerate the decomposition of organic matter (Boggie Citation1972; Jauhiainen et al. Citation2012) causing a release of GHGs into the atmosphere. Fine roots have therefore been suggested to play an important role in the post-drainage carbon balance of peat soils (Minkkinen and Laine Citation1998). Furthermore, peatlands support a unique variety of species adapted to open, wet, and acidic environments. Tree colonisation may therefore reduce the habitat suitability for species adapted for peatlands by altering the microclimate and nutrient availability leading to a loss of biodiversity. Laudon and Hasselquist (Citation2023), suggest that implementation of forest cover on ditched peatlands should be approached with caution and primarily done experimentally until more empirical studies have been done to close existing knowledge gaps and evaluate major risks.
Although steady progress has been made in the development of an integrated understanding of processes linking climate and land-use changes to hydrology and vegetation in peatland ecosystems (Turetsky and St. Louis Citation2006; Escobar et al. Citation2022), major uncertainties still exist (Laudon and Hasselquist Citation2023). Uncertainties such as links and feedbacks between hydrology, tree colonisation, and carbon balance in peatland ecosystems may prevent us from implementing correct management and restoration methods for ditched peatlands. The importance of continued efforts to reduce this knowledge gap should not be underestimated. In this experiment, we therefore studied growth and survival of peat-rooted pine seedlings exposed to changing hydrological conditions in a greenhouse. The pine seedlings were exposed to hydrological conditions corresponding to ditched, natural and rewetted peatlands while other factors were held fixed. In this way, we minimised any impact from external factors apart from the hydrology. Our overarching aims were to study (1) how peat moisture affects survival and growth in the early development of pine seedlings, and (2) how tree growth and biomass increase are linked to various hydrological conditions. These are important processes to understand since large areas in Scandinavia consist of peatlands, which, due to forestry, ditching, and climate change, are now being colonised by pine trees.
Materials and methods
Experimental setup
The experiment was conducted in a greenhouse located at the southern Swedish campus of the Swedish University of Agricultural Sciences in Alnarp (55.657968; 13.0840286). A total of 80 three-year-old bare-rooted Pinus sylvestris seedlings () sourced from Hultsfred were utilised in the study. These seedlings were obtained from field-grown stock during late autumn 2021 and retrieved from cold storage at a local nursery in early spring 2022. Prior to initiating the experiment, each seedling underwent measurements for total weight (mean = 37.51 g, sd = 11.66) and total length (mean = 24.03 cm, sd = 3.73). Additionally, the root weight (mean = 12.9 g, sd = 0.0064) was determined by submerging the roots in a water-filled bucket placed on a scale. No significant differences in length or weight were observed among the seedlings at the time of planting. Following these measurements, the seedlings were planted into 10 l plastic pot with a total height of 22 cm and equipped with drainage holes at the base ((b)). The root systems of the seedlings averaged approximately 15 cm in length, extending to the bottom third of the pots. The pots were filled with fresh Sphagnum peat extracted, milled, and stored to dry by a local peat company. The treatment ensured a natural yet uniform substrate for the study. Importantly, no additional soils or fertilisers were introduced into the peat, maintaining its purity and consistency throughout the experiment.
Figure 1. (a-b) In total 80 peat rooted pine seedling were subject to hydrological conditions corresponding to natural, ditched, and rewetted (plus a control group) conditions in a greenhouse located in Alnarp, Sweden. (c) The seedlings exposed to relatively dry conditions survived whereas (d) conditions corresponding to rewetted conditions caused stress and death for the plants.
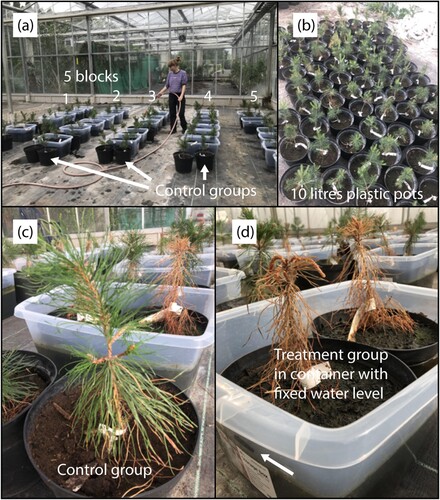
The plants were randomly separated into four groups; three of the groups were assigned a treatment and the fourth was used as a control group. The pots of both treatment- and control-assigned plants were organised in a complete randomised block design and were kept well-watered until the start of the experiment. The experiment consisted of five blocks with two individuals per treatment as well as two control plants ((a)). The main reason for the block design was to minimise influence of daily climatic variations on stomatal conductance-determinations, as well as the influence of edge effects.
The experimental treatments were designed to correspond to three distinct hydrological conditions found in peatlands: (1) rewetted (RW), (2) natural peatland (N), and (3) ditched (D). The perforated plastic pots, each containing seedlings corresponding to one of these treatments (RW, N, or D), were placed within larger plastic containers ((a)). The containers were filled with varying levels of water to simulate the respective hydrological scenarios. In addition to the treatment groups, a control group (C) was included in the experiment. Seedlings in the control group were positioned alongside those in the RW, N, and D treatments but were placed directly on the ground instead of being housed within the larger plastic containers ((a)).
In the RW treatment, the water was filled to the brim of the peat; in the N-treatment the boxes had water up to 5 cm below the peat surface and in the D-treatment, the water was filled to 15 cm below the peat surface. This meant that the complete root systems in the RW treatment were under water, and a large part of the root system in the N-treatment, while only a minor part of the root systems in the D-treatment was submerged. Although variations in reality often are greater with documented water-table range of 5–21 cm in natural peatlands (Breeuwer et al. Citation2009) and often depths of more than 50 cm in ditched sites (Haapalehto et al. Citation2014), our more modest variations are deemed sufficient for the experiment as the small seedlings do not have large root systems and will not have time to adapt their root systems during the course of the experiment. The desired water levels were marked on the outside of the large plastic containers used so that the water levels could be controlled and maintained constant during the experiment ((d)). The containers with pots were continuously filled manually twice a week throughout the experiment to keep constant amounts of water and the controls were manually irrigated twice a week to field capacity.
Measurements
Approximately two weeks after planting, on the 16th of June, the experiment started. After measuring the stomatal conductance (gs) at midday, each plant was subjected to its dedicated treatment. The gs was measured by the determination of vapour flux from stomata with a portable porometer (SC-1Leaf Porometer, Decagon Devices, Meter group) by holding several needles together to cover the ∼6 mm wide sensor aperture. The measurements were taken at one of the side branches what was sunlit and with mature needles.
Stomatal conductance can be used as an estimation of transpiration rates and is thus both an indication of water uptake and photosynthetic capacity, both processes are highly connected to plant vitality (Farquhar and Wong Citation1984; Miner et al. Citation2017). To evaluate the effects of the different water regimes on plant water status and vitality over time, we measured midday gs weekly until the 29th of September 2022, except for one week when the measuring instrument was broken. To reduce the risk of biased results due to daily fluctuations in e.g. temperature and VPD, we measured one block at a time, starting with block 1 and continued with the other blocks, in the same order every time. Measuring time for each block was about 15 min.
After ending the experiment, the plants were harvested from the pots and as much peat as possible was removed from the roots. The roots were cut from the stem by the root base. Total length of the stem from stem base to terminal shoot, excluding the bud, was measured (total height), as well as the length of the terminal shoot, and the length of all lateral annual shoots. The plants were then dried in a drying cabinet (Thermo Scientific Heratherm Advanced Protocol Oven, Heratherm OGS400) to a constant weight at 85°C (Petersson and Ståhl Citation2006; Jagodziński et al. Citation2020) before additional measurements. Dry weight of stem and annual shoots, and weight of annual needles were determined using a scale with a resolution of 0.0001 g (Radwag model AS 220.R2 PLUS). The roots were also weighed, but since it was close to impossible to remove all of the peat substrate without damaging the roots, this measurement was deemed imprecise and unreliable, and thus not further analysed.
For further studies of the plants’ growth response to the changed hydrological conditions, the annual rings in all the pine seedlings were measured. Surface treatments of cross sections from each seedling were made with an industrial razor blade so that ring boundaries and cell structures became clearly visible following procedures described by Ballesteros-Cánovas et al. (Citation2022). Thereafter, each cross-section was documented through photography, and measurements of diameter (with and without bark), total annual ring width, earlywood, and latewood were conducted in the ImageView software with a precision of 0.01 mm for every identified annual growth ring. To perform tree-ring measurements, digital images of each cross section were captured using a digital camera with a Sony Exmor CMOS 6.3 MP sensor connected to an Olympus stereo microscope with magnification range between 0.63 and 6.3x. According to ongoing dendrometer and microcore-based studies, the length of the growing season for the peatland pines in southern Sweden ranges between 50 and 100 days. There are thus variations in the length of the growing season but together with the fact that the latewood being formed on the annual rings, we are confident that the full growing season has been covered.
Greenhouse conditions
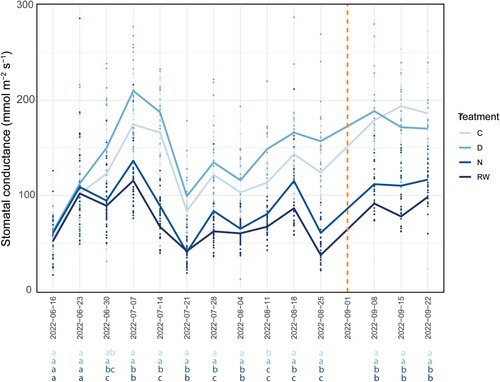
During the experiment, the greenhouse was covered in shade cloth to avoid the risk that direct sun through the glass would burn newly developed needles, and to ensure more even conditions between the plants. Mean daily temperature varied from 22.8°C (at the last measuring occasion in September) to the highest mean daily temperature in mid-July, with 37.3°C. The highest temperatures coincided with the lowest average stomatal conductance-determinations on July 21, and August 4 and 25 (). Mean daily relative humidity varied from 37.8% to 59.5%.
Figure 2. Stomatal conductance (mmol m−2 s−1) over the experiment period. The lines represent the mean stomatal conductance (gs) of the treatments and the dots represent the individual plants’ values. The dashed vertical line indicates the week when there was no measurement due to device failure. The letters at the bottom of the figure show results from the pair-wise comparison of estimated marginal means test. Treatments with different letters, are significantly different from each other (p-value < 0.05).
Statistics
We computed all statistical analyses with R statistical software, version 4.2.2 (R Core Team Citation2022) in the program RStudio, version 2023.3.0.386 (Posit Team Citation2023). We used the following packages: lme4 (Bates et al. Citation2015), car (Fox and Weisberg Citation2019) emmeans (Lenth Citation2023), ggsurvfit (Sjoberg et al. Citation2023), survival (Therneau Citation2023), tidyverse (Wickham et al. Citation2019), readxl (Wickham and Bryan Citation2023), and dplyr (Wickham et al. Citation2023). Linear mixed-effects models were fitted with Restricted Maximum Likelihood (REML), using the function lmer from the lme4-package. For the survival analysis, we used the survdiff- and survfit-function from the survival-package. We used statistical significance level at a p-value ≤ 0.05 in all the analyses and corresponding 95% confidence intervals.
Stomatal conductance
We used a linear mixed-effects model for stomatal conductance (gs). The response gs was logarithmised due to heteroscedasticity, and fixed effects were treatment (factor with 4 levels) and dates (factor with 15 levels) including their interaction. The random effects had three levels in the following order nesting block, treatment, and the individual plant ID. The block-treatment level captures the plants with the same treatment in the same block, the block-treatment-plant ID level captures the repeated measurements of the individual plants. Model assumptions were verified by plotting the residuals.
We tested the model with an ANOVA, type II analysis using Wald F tests with Kenward–Roger df correction. We computed pair-wise comparison of estimated marginal means from the model to test the differences of conductance by treatment and dates using pair-wise comparisons with Tukey correction and Kenward–Roger degrees-of-freedom method.
Plant survival
Since two of the treatments (RW and N) had plants that had died during the experiment, these two treatments survival were analysed by a survival curve using Aalen–Johansen estimator. The overall result was verified by a Fisher’s Exact Test of the total plant deaths by the end of the experiment.
Biomass and growth measurements of harvested plant material
We used linear mixed-effects models with total height, stem weight, annual needles, annual shoots, terminal shoot length and lateral shoots mean as responses. Stem growth and annual needles was log transformed to fulfil the assumptions of the model. The fixed effect was treatments (factor with 4 levels), and the random effects were treatment nested within block. Model assumptions were verified by plotting the residuals.
We analysed the overall treatment effect with ANOVAs type II analysis using Wald F tests with Kenward–Roger degrees-of-freedom method. We computed pair-wise comparison of estimated marginal means from the models to test the differences between the treatments using pair-wise comparisons with Tukey correction and Kenward–Roger method for degrees-of-freedom.
Results
There were clear differences between the treatments corresponding to the different hydrological scenarios. Plants subjected to conditions corresponding to RW and N peatlands were consistently lower performing than the plants in the D and C groups.
Stomatal conductance
The ANOVA for stomatal conductance showed significance for both treatment (F3; 12 = 100.3, p < 0.001), date (F14; 950 = 96.5, p < 0.001) and their interaction (F42; 952 = 6.6, p < 0.001). There were clear differences between the treatments from the third week () and forward. RW and N had significantly lower values of gs than both D and the control plants at all occasions except in the second week, when the control plants were not separated from N. In one of the 15 measuring occasions, the controls were significantly lower than D, but still higher than RW and N.
Plant survival
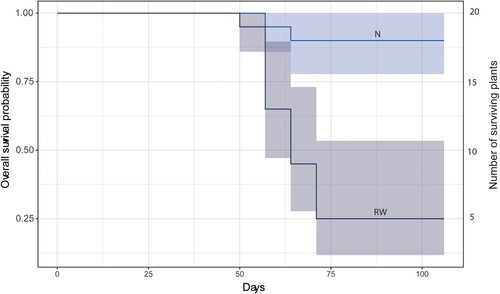
At the end of the experiment, 15 of the plants had died in treatment RW and two plants had died in treatment N. Since no plants had died in treatment D or treatment C, these were not included in the tests of survival. The Fisher Exact test showed that there was an overall significance between the treatment RW and N in plant survival at the end of the experiment, p < 0.001. The survival curves including the time factor also showed significance between the treatments by p < 0.001.
The survival curves illustrate when the deaths occurred (). In treatment RW, the first plant died 51 days after experiment initiation and plants continued to die until 71 days after experiment initiation. The two plants that died in treatment N did so between day 57 and 64 after experiment initiation.
Figure 3. Survival analysis for treatments corresponding to rewetted (RW) and natural (N) conditions during the experiment period with 95% confidence intervals. All plants in control and ditched groups (C and D) survived and are therefore not included in the figure.
Length and biomass
There was a significant treatment effect for all length and aboveground biomass measurements (). In the pair-wise comparison of estimated marginal means, all but one response variable of length and aboveground biomass growth showed significantly lower values for RW and N than D and C (). Stem growth increment, length of terminal shoot, mean length of lateral shoots, annual needles biomass, as well as annual shoot growth biomass, all presented the same significant differences between treatments. Stem weight showed the same trend, but with less clear differences between treatments. RW differed significantly from C, but none of them differed significantly from and N or D, which did not differ from each other ().
Figure 4. Three growth plots. A = growth length, B = terminal shoot length, and C = lateral shoot length. All responses were measured in cm. Note that the y-axel have different scales. The letters come from the pair-wise comparison of estimated marginal means. If the letters differ, it means that the treatments (control (C), natural (N), ditched (D) and rewetted (RW)) are significantly different from each other.
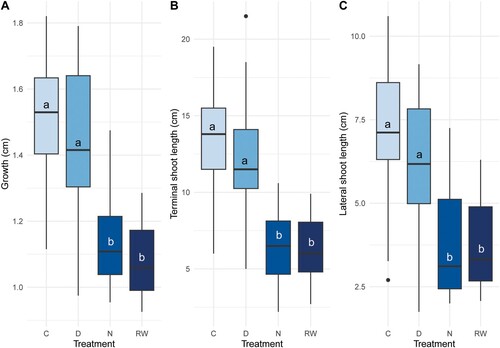
Table 1. Summary of the length and biomass of the 80 pine seedlings included in the experiment, based on the ANOVA results. The values show Wald F tests (F) with Kenward–Roger (Df) correction.
Table 2. Summary of the results from the pair-wise comparison of estimated marginal means test for all aboveground biomass measurements. Each treatment included 20 replicates, and all replicates were included in all measurements. Measurements were performed in October, after sessation of the experiment. The response was back-transformed from the log-scale. If treatments have different letters, they are significantly different from each other at p-value ≤ 0.05.
Radial-tree growth
The development of a 2022 annual growth ring differed significantly between the groups exposed to wet conditions (group RW and N) and the groups D and C growing under dryer conditions, close to field capacity (). For seedlings growing under conditions corresponding to a rewetted peatland (group RW), the average ring width for 2022 was 0.06 mm (range 0–0.72 mm). Cell formation and partial development of a 2022-year annual ring took place in 21% (4/19) of the plants following the controlled rewetting simulation. For the pine seedlings growing under moisture conditions corresponding to a natural peatland (group N), the average radial growth for 2022 was 0.12 mm (range 0–0.77 mm). In total 35% (7/20) of the seedlings in group N formed new cells during the experiment. All (100%, 20/20) of the seedlings growing under moisture conditions corresponding to a ditched peatland (group D) developed an annual growth ring for 2022. These rings were on average 0.78 mm, with a range between 0.12- and 1.96-mm. Similar survival and results were obtained for the control group (C) with an average growth of 0.51 mm (range: 0.12–1.50 mm). For all groups, the annual rings formed 2021 (prior to the start of the experiment) were wider than the 2022 rings (). There were significant differences between the seedlings growing in wet conditions (group RW and N) in comparison to the seedlings growing under drier conditions (group D and C).
Figure 5. Tree-ring width (mm) for 2022 shown for the four groups, control (C), ditched (D), natural (N) and rewetted (RW).
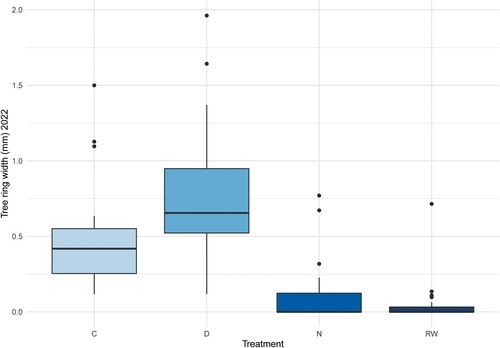
Figure 6. (a) Basal Area (mm2) at soil level for pine seedlings growing under conditions corresponded to a rewetting (RW), a natural peatland (N), a ditched peatland (D), and the control group (C). (b) Tree ring width for all years and treatments. The letters come from the pair-wise comparison of estimated marginal means. If the letters differ, it means that the treatments are significantly different from each other.
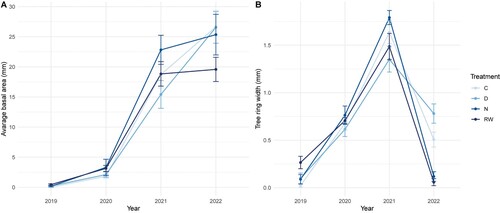
Average diameter of the seedlings (bark excluded) at soil level was 5.03 mm (RW), 5.26 mm (N), 5.68 (D) and 5.59 (C), and the average basal area (mm2) at soil level was 20.61 (RW), 25.35 (N), 26.55 (D) and 26.65 (C) mm2. The difference between the groups was clear when the increase in growth over time was compared since the basal area curves for groups D and C continue upwards while the curves for group N and especially RW noticeably flatten out ((c)).
Discussion
Interpretation of the results
The experiment examined the effects of different hydrological scenarios on growth performance for pine seedlings, focusing on stomatal conductance (gs), plant survival, length, and aboveground biomass, as well as radial tree growth. The results showed significant differences between the treatments linked to wet (group RW and N) and drier (group D and C) conditions.
In terms of gs, plants subjected to rewetting (RW) and natural peatland moisture conditions (N) had consistently lower values compared to plants in the ditched peatland (D) treatment and the control group. The differences were significant from the third week onwards. Only in the second week, the control plants were not significantly different from N. Closing of stomata is one of the earliest plant physiological responses to waterlogging for many species and is believed to be triggered by a hormonal signal from the roots due to O2 depletion in the rhizosphere (Kozlowski and Pallardy Citation2002). The time from exposure to anaerobic conditions to stomata closure varies highly between species (Levinsson et al. Citation2024). The stomatal closure connects to rapid reduction of the photosynthesis process, observed during waterlogged conditions (Newsome et al. Citation1982; Kozlowski and Pallardy Citation2002). Furthermore, O2 depletion in the rhizosphere reduces aerobic root respiration and metabolism, which also have negative consequences on water uptake, and both shoot and root growth (Eckhard et al. Citation2013). The effects of the waterlogging on growth were observed in the measurements, as the length and aboveground biomass determinations demonstrated significant treatment effects. The RW and N groups consistently showed lower values compared to treatment D and the control group, except for one response variable. Various growth parameters, including stem growth increment, shoot length, and aboveground biomass, were significantly lower in the RW and N treatments. When the pine roots were studied, no visible adaptation to hydrological changes could be observed. This was expected as the experiment only took place during one growing season and waterlogging usually does not modify root systems immediately, but rather in the longer term (Parent et al. Citation2008; Pearson et al. Citation2013).
The survival of the pine plants was also affected by the treatments. At the end of the experiment, 15 plants in the RW treatment and 2 plants in the N treatment had died. Despite this, Pearson et al. (Citation2013) noted that waterlogged peatland conditions had little impact on the survival of pine seedlings in the short term. In our controlled study, waterlogged conditions for three months were sufficient to kill the majority of the RW seedlings. It might be conceivable that the wild plants are more resistant than the investigated seedlings and can withstand slightly more hydrological stress before dying, but still a rewetting must be considered a strong tree establishment and growth-limiting measure.
The studies of the annual rings in the seedlings after the termination of the greenhouse experiment showed that some of the plants in the RW and N groups did not die immediately since some cell formation during 2022 took place in five of the seedlings in the RW group and seven of the seedlings in the N group. However, multiple missing annual rings are not unusual for peatland pines, and series of missing rings have been recorded without the pine tree having died for that matter (Smiljanić et al. Citation2014; Edvardsson et al. Citation2016; Blanchet et al. Citation2017). The phenomenon with missing rings in living trees has thus been documented for mature trees with considerably larger volume and more developed root systems than the plants in the greenhouse. No plants died in the D or control treatments, which also was confirmed from the tree-ring studies since both annual rings for 2022, diameter increase, and basal area increments since the onset of the experiment could be recorded (). However, the plants in this experiment were subjected to a drastic change in environmental conditions as they had not previous to the experiment been growing in wet conditions and were not acclimatised to such. Thus, the conditions resemble a rewetting scenario to a higher extent than a natural, in which it might be expected that established plants are better adapted to wet conditions.
Radial tree growth varied significantly among the groups. The RW and N treatments resulted in narrower annual growth rings for 2022 compared to D and the control group. A smaller percentage of seedlings in RW and N formed new cells, indicating slower growth. In contrast, all seedlings in D and the control group developed complete annual growth rings. The diameter and basal area at soil level were highest in D and the control group, followed by N and RW treatments. The fact that all groups show a thinner ring for 2022 than 2021 is likely related to processes linked to the transplanting. Uptake from the nursery field, cold storage, and potting are all processes that have been shown to temporarily reduce vitality and growth, together with the recreation of a root-shoot balance during the establishment phase (Rietveld Citation1989; Lindqvist Citation2000; Levinsson Citation2013). However, the trend is still clear the wetter it gets in the peat, the harder it is for the pine plants to survive. Also, the stem weight measurements showed the same trend, but with less clear differences between treatments. The RW treatment differed significantly from the control plants, but none of them differed significantly from the N or D treatments, which did not differ from each other.
Linkage between the greenhouse experiment and large-scale rewetting initiatives
Every year ditched peatlands emit approximately 2 Gt CO2, which corresponds to about 5% of all anthropogenic GHG emissions (Joosten et al. Citation2016; Günther et al. Citation2020). The ditching may also facilitate tree colonisation, which in turn may generate even drier peat surface conditions. To reverse this peatland development, rewetting by plugging excavated ditches has become an increasingly common trend. Most often, rewetting effectively reduces the CO2 emissions, but may in parallel increase the emission of methane (CH4) during the initial stage of the rewetting (Günther et al. Citation2020).
This study, where pine seedlings were exposed to different hydrological conditions in a greenhouse, shows how crucial the hydrological conditions are for the growth and survival of peat-rooted pine trees. However, this experiment only included young plants and there have been contradictory results in studies concerning stress tolerance and plant age. Studies by Kreuzwieser and Rennenberg (Citation2014) showed that tolerance to waterlogging stress increased with age, whereas other studies have found that the age-dependant tolerance differed, depending on the species general waterlogging tolerance, and concluded that this needs to be further investigated (Siebel and Bouwma Citation1998; Glenz et al. Citation2006). Thus, we cannot say if older pines in a rewetting situation would have reacted as strongly as the young plants in the experiment did.
Whether and how quickly trees on a ditched peatland die because of a rewetting depends, of course, on many factors, such as species, age of the trees, how deeply rooted they are, and the magnitude of the water-level change. Preliminary results from a peatland rewetting initiative in Jämtland (Edvardsson unpublished data), shows a gradual tree colonisation following a ditching to create more arable and grazing land and thereafter an abrupt death of most trees established in the peat soil following the rewetting. The trees’ ability to survive the water level increase in the peatland varied depending on their placement and the extent of the effect of the elevation where they grow. But from comparing the initial results from the restored peatland and our greenhouse experiment, it can be deduced that similar mechanisms control the growth of the trees since they show similar responses to hydrological changes. In parallel, it also shows that both the seedlings in the greenhouse and the mature established trees on a peatland can immediately die if the water-level change becomes too significant.
Conclusions
Peatland tree colonisation exaggerated by ditching and climate change has significant effects on peatland ecosystem services including carbon sequestration and biodiversity (Stelling et al. Citation2023) and has also been found to increase surface water browning (Härkönen et al. Citation2023). Restoration efforts commonly entail the rewetting of peatlands and the management of drainage systems to increase the carbon storage capacity and to facilitate the recovery of native ecosystems (Gatis et al. Citation2023). This study investigated the impact of different hydrological conditions on peat-rooted pine seedlings’ growth performance, focusing on stomatal conductance, plant survival, length, aboveground biomass, and radial tree growth. Our findings show that pine trees in rewetted conditions had consistently lower stomatal conductance and growth rates compared to drier treatments, and that plant survival was also impacted showing multiple deaths during the experiment for the seedlings in the treatment corresponding to rewetted conditions. The study thereby suggests that pine trees’ survival and growth are strongly influenced by hydrological conditions in the peatlands.
The linkage between hydrology and pine survival in peatlands has implications for large-scale rewetting initiatives aimed at mitigating CO2 emissions from peatlands. Our research shows that rewetting limits the survival and establishment of peatland trees, which will also contribute to an increase in carbon uptake within the peatlands. At the same time, this foster the accumulation of dead wood, which can be advantageous for biodiversity, but simultaneously sustains additional nutrient sources for shrubs that have colonised the peatlands.
Our greenhouse experiment supports the idea that rewetting of peatlands will cause the death of many trees, resulting in positive effects on the hydrology of the ecosystem as the trees cease to consume surface water. At the same time, the dead trees may remain standing for decades and slowly decompose, contributing nutrients to the peat surface vegetation, continuing to shade other vegetation, and possibly becoming something that is not perceived as attractive if the peatland is to function as a destination for recreational purposes. This leads to questions about what should be done with the trees that will die because of the rewetting initiatives. Regardless, rewetting is an effective way to reduce the accelerating tree establishment that has been observed on many Scandinavian peatlands due to earlier ditching initiatives, resulting in the trees ceasing to (i) consume water and dry out the peat and moss, (ii) fertilise the moss with litter fall, and (iii) interrupt the positive feedback effect that the trees generate to establish themselves in abundance. Furthermore, it is important to remember that differences in geology, hydrology, vegetation, and surrounding landscape and land use purposes necessitate that each restoration project be tailored to the prevailing circumstances. Kreyling et al. (Citation2021) have studied this and conclude that regardless of how restoration is carried out, peatland ecosystems will not return to the same state as they were before drainage or peat extraction, but a better understanding of local is required to improve planning and implementation of peatland rewetting and subsequent large-scale management of drained peatlands to fulfil the Paris Agreement.
Authorship contribution statement
Johannes Edvardsson: Conceptualisation, methodology, investigation, validation, writing – original draft, project administration, and funding acquisition. Anna Levinsson: Conceptualisation, methodology, investigation, validation, writing – original draft, resources, supervision, and project administration. Anna Lund: Formal analysis, investigation, data curation, writing – review and editing, and visualisation.
Acknowledgements
This study was an integrated part of the project MOSS – Management strategies for tree colonised peatland ecosystems, which is funded by FORMAS (grant no: 2020-00936). We wish to thank our assistant Lotta Olsson, for help with data collection and three anonymous reviewers for suggestions to improve the article.
Disclosure statement
No potential conflict of interest was reported by the author(s).
Data availability statement
The data that support the findings of this study are available from the corresponding author upon reasonable request.
Correction Statement
This article was originally published with errors, which have now been corrected in the online version. Please see Correction (https://doi.org/10.1080/02827581.2024.2364530)
Additional information
Funding
References
- Ballesteros-Cánovas JA, Edvardsson J, Corona C, Mažeika J, Stoffel M. 2022. Estimation of recent peat accumulation with tree saplings. Prog Phys Geog: Earth Environ. 46(4):515–529. doi:10.1177/03091333211073786.
- Bates D, Mächler M, Bolker B, Walker S. 2015. Fitting linear mixed-effects models using lme4. J of Stat Softw. 67:1–48. doi:10.18637/jss.v067.i01.
- Blanchet G, Guillet S, Calliari B, Corona C, Edvardsson J, Stoffel M, Bragazza L. 2017. Impacts of regional climatic fluctuations on radial growth of Siberian and Scots pine at Mukhrino mire (central-western Siberia). Sci Tot Environ. 574:1209–1216. doi:10.1016/j.scitotenv.2016.06.225.
- Boggie R. 1972. Effect of water-table height on root development of Pinus contorta on deep peat in Scotland. Oikos. 23(3):304–312. doi:10.2307/3543168.
- Breeuwer A, Robroek BJ, Limpens J, Heijmans MM, Schouten MG, Berendse F. 2009. Decreased summer water table depth affects peatland vegetation. Basic Appl Ecol. 10(4):330–339. doi:10.1016/j.baae.2008.05.005.
- Eckhard G, Horst JW, Neumann E. 2013. Adaptation of plants to adverse chemical soil conditions. In: Marschner P., editor. Marschner’s mineral nutrition of higher plants. Third Ed. Amsterdam, the Netherlands: Elsevier; p. 408–471.
- Edvardsson J, Šimanauskiene R, Taminskas J, Baužiene J, Stoffel M. 2015. Increased tree establishment in Lithuanian peat bogs detected using a combination of field and remotely sensed approaches. Sci Total Environ. 505:113–120. doi:10.1016/j.scitotenv.2014.09.078.
- Edvardsson J, Stoffel M, Corona C, Bragazza L, Leuschner HH, Charman DJ, Helama S. 2016. Subfossil peatland trees as proxies for Holocene palaeohydrology and palaeoclimate. Earth-Sci Rev. 163:118–140. doi:10.1016/j.earscirev.2016.10.005.
- Escobar D, Belyazid S, Manzoni S. 2022. Back to the future: restoring northern drained forested peatlands for climate change mitigation. Front. Environ Sci. 10:108. doi:10.3389/fenvs.2022.834371.
- Farquhar GD, Wong SC. 1984. An empirical-model of stomatal conductance. Aust J Plant Physiol. 11:191–209.
- Fox J, Weisberg S. 2019. An R companion to applied regression. Thousand Oaks, CA: Sage.
- Gatis N, Benaud P, Anderson K, Ashe J, Grand-Clement E, Luscombe DJ, Puttock A, Brazier RE. 2023. Peatland restoration increases water storage and attenuates downstream stormflow but does not guarantee an immediate reversal of long-term ecohydrological degradation. Sci Rep. 13(1):15865. doi:10.1038/s41598-023-40285-4.
- Glenz C, Schlaepfer R, Iorgulescu I, Kienast F. 2006. Flooding tolerance of Central European tree and shrub species. For Ecol Manag. 235:1–13. doi:10.1016/j.foreco.2006.05.065.
- Gorham E. 1991. Northern peatlands: role in the carbon cycle and probable responses to climatic warming. Ecol Appl. 1(2):182–195. doi:10.2307/1941811.
- Günther A, Barthelmes A, Huth V, Joosten H, Jurasinski G, Koebsch F, Couwenberg J. 2020. Prompt rewetting of drained peatlands reduces climate warming despite methane emissions. Nat Commun. 11(1):1644. doi:10.1038/s41467-020-15499-z.
- Haapalehto T, Kotiaho JS, Matilainen R, Tahvanainen T. 2014. The effects of long-term drainage and subsequent restoration on water table level and pore water chemistry in boreal peatlands. J Hydrol. 519:1493–1505. doi:10.1016/j.jhydrol.2014.09.013.
- Härkönen LH, Lepistö A, Sarkkola S, Kortelainen P, Räike A. 2023. Reviewing peatland forestry: implications and mitigation measures for freshwater ecosystem browning. For Ecol Manag. 531:120776. doi:10.1016/j.foreco.2023.120776.
- Hugelius G, Loisel J, Chadburn S, Jackson RB, Jones M, MacDonald G, Marushchak M, Olefeldt D, Packalen M, Siewert MB, Treat C. 2020. Large stocks of peatland carbon and nitrogen are vulnerable to permafrost thaw. P Natl Acad Sci. 117(34):20438–20446. doi:10.1073/pnas.1916387117.
- Jagodziński AM, Dyderski MK, Gęsikiewicz K, Horodecki P. 2020. Consequences of different sample drying temperatures for accuracy of biomass inventories in forest ecosystems. Sci Rep. 10(1):16009. doi:10.1038/s41598-020-73053-9.
- Jauhiainen J, Hooijer A, Page SE. 2012. Carbon dioxide emissions from an Acacia plantation on peatland in Sumatra, Indonesia. Biogeosci Discussions. 8(4): 617–630. doi:10.5194/bg-9-617-2012.
- Joosten H, Sirin A, Couwenberg J, Laine A, Smith P. 2016. Peatland restoration and ecosystem services. In: Bonn A, Allott T, Evans M, Joosten H, Stoneman R., editors. Cambridge, UK: Cambridge University Press.
- Kasimir A, He H, Coria J, Nordén A. 2018. Land use of drained peatlands: greenhouse Gas fluxes, plant production, and economics. Glob Change Biol. 24(8):3302–3316. doi:10.1111/gcb.13931.
- Klemedtsson L, Von Arnold K, Weslien P, Gundersen P. 2005. Soil CN ratio as a scalar parameter to predict nitrous oxide emissions. Glob Change Biol. 11(7):1142–1147. doi:10.1111/j.1365-2486.2005.00973.x.
- Kozlowski TT, Pallardy SG. 2002. Acclimation and adaptive responses of woody plants to environmental stresses. Bot Rev. 68(2):270–334. doi:10.1663/0006-8101(2002)068[0270:AAAROW]2.0.CO;2.
- Kreuzwieser J, Rennenberg H. 2014. Molecular and physiological responses of trees to waterlogging stress. Plant Cell Environ. 37(10):2245–2259. doi:10.1111/pce.12310.
- Kreyling J, Tanneberger F, Jansen F, van der Linden S, Aggenbach C, Blüml V, Couwenberg J, Emsens WJ, Joosten H, Klimkowska A, et al. 2021. Rewetting does not return drained fen peatlands to their old selves. Nat Commun. 12:5693. doi:10.1038/s41467-021-25619-y.
- Laine J, Minkkinen K, Trettin C. 2009. Direct human impacts on the peatland carbon sink. Carbon Cycling in Northern Peatlands. 184:71–78.
- Lamentowicz M, Kajukało-Drygalska K, Kołaczek P, Jassey VE, Gąbka M, Karpińska-Kołaczek M. 2020. Testate amoebae taxonomy and trait diversity are coupled along an openness and wetness gradient in pine-dominated Baltic bogs. Eur J Protistol. 73:125674. doi:10.1016/j.ejop.2020.125674.
- Laudon H, Hasselquist EM. 2023. Applying continuous-cover forestry on drained boreal peatlands; water regulation, biodiversity, climate benefits and remaining uncertainties. Trees, Forests and People. 11:100363.
- Lenth R. 2023. Emmeans: estimated marginal means, aka least-squares means. R package version 1.8.5 ed.
- Levinsson A. 2013. Post-transplant shoot growth of trees from five different production methods is affected by site and species. Arboriculture & Urban Forestry. 39:201–210. doi:10.48044/jauf.2013.026.
- Levinsson A, Emilsson T, Sjöman H, Wiström B. 2024. Using stomatal conductance capacity during water stress as a tool for tree species selection for urban stormwater control systems. Urban For Urban Gree. 91:128164. doi:10.1016/j.ufug.2023.128164.
- Lindqvist H. 2000. Plant vitality in deciduous ornamental plants affected by lifting date and cold storage, Doctoral thesis. Swedish University of Agricultural Sciences.
- Miner GL, Bauerle WL, Baldocchi DD. 2017. Estimating the sensitivity of stomatal conductance to photosynthesis: a review. Plant Cell Environ. 40(7):1214–1238. doi:10.1111/pce.12871.
- Minkkinen K, Laine J. 1998. Long-term effect of forest drainage on the peat carbon stores of pine mires in Finland. Can J For Res. 28(9):1267–1275. doi:10.1139/x98-104.
- Montanarella L, Jones RJA, Hiederer R. 2006. The distribution of peatland in Europe. Mires and Peat. 1:1–11. http://www.mires-and-peatland.net.
- Newsome RD, Kozlowski TT, Tang ZC. 1982. Responses of Ulmus americana seedlings to flooding of soil. Can J Botany. 60(9):1688–1695. doi:10.1139/b82-219.
- Nuutinen T, Hirvelä H, Hynynen J, Härkönen K, Hökkä H, Korhonen KT, Salminen O. 2000. The role of peatlands in Finnish wood production-an analysis based on large-scale forest scenario modelling. Silva Fenn 34(2):131–153. doi:10.14214/sf.636.
- Parent C, Capelli N, Berger A, Crèvecoeur M, Dat JF. 2008. An overview of plant responses to soil waterlogging. Plant Stress. 2(1):20–27.
- Pearson M, Saarinen M, Nummelin L, Heiskanen J, Roitto M, Sarjala T, Laine J. 2013. Tolerance of peat-grown Scots pine seedlings to waterlogging and drought: morphological, physiological, and metabolic responses to stress. For Ecol Manag. 307:43–53. doi:10.1016/j.foreco.2013.07.007.
- Petersson H, Ståhl G. 2006. Functions for below-ground biomass of Pinus sylvestris, Picea abies, Betula pendula and Betula pubescens in Sweden. Scand J For Res. 21(S7):84–93. doi:10.1080/14004080500486864.
- Posit Team. 2023. Rstudio: integrated development environment for R. Boston, MA: Posit Software, PBC.
- Ratcliffe JL, Creevy A, Andersen R, Zarov E, Gaffney PP, Taggart MA, Mazei Y, Tsyganov AN, Rowson JG, Lapshina ED, Payne RJ. 2017. Ecological and environmental transition across the forested-to-open bog ecotone in a west Siberian peatland. Sci Total Environ. 607:816–828. doi:10.1016/j.scitotenv.2017.06.276.
- R Core Team. 2022. R: A language and environment for statistical computing. Vienna, Austria: R Foundation for Statistical Computing.
- Rietveld WJ. 1989. Transplanting stress in bareroot conifer seedlings: its development and progression to establishment. North J Appl For. 6(3):99–107. doi:10.1093/njaf/6.3.99.
- Roulet NT, Moore TR. 1995. The effect of forestry drainage practices on the emission of methane from northern peatlands. Can J For Res. 25(3):491–499. doi:10.1139/x95-055.
- Siebel HN, Bouwma IM. 1998. The occurrence of herbs and woody juveniles in a hardwood floodplain forest in relation to flooding and light. J Veg Sci. 9(5):623–630. doi:10.2307/3237280.
- Sjoberg D, Baillie M, Haesendonckx S, Treis T. 2023. Ggsurvfit: Flexible Time-to-Event Figures. R package version. 0.3:0.
- Smiljanić M, Seo J-W, Läänelaid A, van der Maaten-Theunissen M, Stajić B, Wilmking M. 2014. Peatland pines as a proxy for water table fluctuations: disentangling tree growth, hydrology and possible human influence. Sci Total Environ. 500–501:52–63.
- Stelling JM, Slesak RA, Windmuller-Campione MA, Grinde A. 2023. Effects of stand age, tree species, and climate on water table fluctuations and estimated evapotranspiration in managed peatland forests. J Environ Manag. 339:117783. doi:10.1016/j.jenvman.2023.117783.
- Sutheimer CM, Meunier J, Hotchkiss SC, Rebitzke E, Radeloff VC. 2021. Historical fire regimes of North American hemiboreal peatlands. For Ecol Manag. 498:119561. doi:10.1016/j.foreco.2021.119561.
- Therneau T. 2023. . A Package for Survival Analysis in R. R package version, 3.5-5 ed.
- Turetsky MR, Donahue W, Benscoter BW. 2011. Experimental drying intensifies burning and carbon losses in a northern peatland. Nat Commun. 2(1):514. doi:10.1038/ncomms1523.
- Turetsky MR, St. Louis VL. 2006. Disturbance in boreal peatlands. In: Wieder RK, Vitt DH , Boreal peatland ecosystems. Berlin, Heidelberg: Springer Berlin Heidelberg; p. 359–379.
- Wickham H, Averick M, Bryan J, Chang W, McGowan LDA, François R, Grolemund G, Hayes A, Henry L, Hester J, Kuhn M. 2019. Welcome to the Tidyverse. J Open Source Software. 4(43):1686. doi:10.21105/joss.01686.
- Wickham H, Bryan J. 2023. Readxl: Read Excel Files. R package version 1.4.2 ed.
- Wickham H, François R, Henry L, Müller K, Vaughan D. 2023. dplyr: A Grammar of Data Manipulation. https://dplyr.tidyverse.org,https://github.com/tidyverse/dplyr.
- Wieder RK, Vitt DH. eds. 2006. Boreal peatland ecosystems, Vol. 188. Berlin Heidelberg: Springer Science & Business Media.
- Yu ZC. 2012. Northern peatland carbon stocks and dynamics: a review. Biogeosciences. 9(10):4071–4085. doi:10.5194/bg-9-4071-2012.