
 ?Mathematical formulae have been encoded as MathML and are displayed in this HTML version using MathJax in order to improve their display. Uncheck the box to turn MathJax off. This feature requires Javascript. Click on a formula to zoom.
ABSTRACT
This paper aims to present an input-output model of the forest-based bioeconomy, enabling insight into its contribution to total gross value added (GDP), employment, and CO2 emissions in Estonia, Latvia, Lithuania, and Finland. To quantify this contribution, the paper utilizes input-output tables of the four countries. The forest-based bioeconomy includes forestry, the processing of forestry products (forward linkages), and the direct and indirect use of inputs (backward linkages) from forestry and processing industries. Our analysis reveals that while forestry itself is a small industry, contributing minimally to GDP (ranging from 0.40% in Lithuania to 1.90% in Finland), and the forest-based bioeconomy is considerably larger. For instance, its contribution to GDP ranges from 3.59% in Lithuania to 7.22% in Estonia. Moreover, the forestry-based bioeconomy exhibits negative net CO2 emissions, primarily due to CO2 sequestration by forest lands and harvested wood products. Despite the substantial negative CO2 emissions associated with forestry activities, without sequestration, the forestry-based bioeconomy's share in total emissions ranges from 5.14% in Lithuania to 14.88% in Finland.
Introduction
Forests are widely acknowledged for their importance by scientists and policymakers alike. There is especially a growing recognition of the increasing demand for forest ecosystem services, which are integral to forest management (Naumov et al. Citation2018; Sousa-Silva et al. Citation2018; European Commission Citation2020b; Gustafsson et al. Citation2020). Forests serve as vital carbon sinks, sequestering and storing carbon, while also providing habitats for numerous species and playing crucial roles in preventing erosion and balancing micro-climates. Despite the prevailing policy paradigm aiming for the combined delivery of both ecosystem services and economic functions of forestry, in practice, policy tends to prioritize the former (Sotirov et al. Citation2021). European Union policy documents, such as the Green Deal, EU Bioeconomy strategy, and EU Biodiversity strategy, predominantly focus on climate change, biodiversity, and non-market values of forests, largely overlooking their economic functions.
This research extends to both the direct and indirect economic value of forests, which encompasses forestry's use of inputs from other sectors and the processing of forest products in industries like the paper industry. The concept of the “forest-based bioeconomy” encompasses all these values. It is defined as the extraction, processing, and transformation of renewable biological resources and waste streams connected to forestry. It is part of the broader bioeconomy, as defined by the European Union, which focuses on all renewable sources (European Commission Citation2018, Citation2020a, Citation2021; Zlaugotne et al. Citation2020; Mainar-Causapé et al. Citation2021). The European interest in the bioeconomy stems largely from the fact that its products can substitute fossil energy and fossil-derived products, finding applications in construction, packaging, textiles, plastics, and chemical production.
However, operationalization of the forest-based bioeconomy is essential to inform policymakers and stakeholders for better decision-making regarding the trade-offs between economic and non-economic values of forests. Finland stands out among Baltic and Scandinavian countries for its recognition to operationalize the forest-based bioeconomy, including its economic functions (see Mosley and Van Brusselen Citation2024). However, operationalization is still largely missing.
Operationalization necessitates integrated modelling of the forest-based bioeconomy tailored to region-specific circumstances (Smyth et al. Citation2020). Integration in this context involves considering the direct and indirect use of inputs by forestry from other industries in the economy, forestry itself, and the processing of forestry products by other industries, along with the direct and indirect use of inputs by these processing industries.
It is the purpose of this paper to provide such an integrated modelling of the forest-based bioeconomy to produce country-specific information on the contribution of the forest-based bioeconomy to GDP, employment, and CO2 emissions.
We do this by using an input-output method developed by (Harthoorn Citation1989) that has been applied by Harthoorn and Wossink (Citation1987) to measure the economic importance of the agriculture-based bioeconomy. The method differs from regular input-output analysis used to determine the economic importance of the bioeconomy (for instance Lazorcakova et al. Citation2022) in that it takes the production of forestry-based products in the different parts of the economy as a starting point of the analysis instead of the final demand for these products. We apply the method in Estonia, Latvia, Lithuania, and Finland because of the relative importance of the forest-based bioeconomy in these countries.
Background
Forests provide direct and indirect income, employment, ecosystem services, and recreation opportunities (European Commission Citation2021). Forests are the largest terrestrial ecosystem in the EU covering around 38% of the land area. The current condition of forest ecosystems in the EU is the result of natural and human-driven forces. Nowadays, in the EU only about 2% to 4% of the total forest area is covered by primary forests, whereas 89% are covered by semi-natural forests. The rest is taken up by plantations. The forest area has increased in the EU in the last decades and gained 13 million hectares in the period 1990–2015 due to both natural processes and active afforestation. The main proportion of forests in the EU (84%) are considered as forests available for wood supply. Around 14% of the EU’s forests are protected for biodiversity reasons (Camia et al. Citation2021).
Estonia, Latvia, Lithuania, and Finland had a share of 15% in total forest growth and 20% in the EU forest area in 2015. provides information on the economies of Estonia, Latvia, Lithuania, and Finland. Notice that the sum of gross value added in an economy equals GDP.
Table 1. Gross value added, CO2 emissions, and employment in Estonia, Latvia, Lithuania, and Finland in 2015.
presents data on the economic importance of “Forestry and logging” (A02) in the four countries. The last column shows exports of “Forestry and logging” (A02), “Manufacture of wood of products of wood and cork, except furniture; articles of straw and plaiting materials’ (C16), and “Manufacture of paper and paper products” (C17). The latter two are the main processing industries of products from “Forestry and logging”. The codes between brackets refer to the codes used by the European Union Statistical Classification of economic activities (NACE). shows the importance of forestry for land use, while the share in GDP and total employment is small. also shows the large share of the two processing industries in exports, this is especially the case for Finland, which has a large paper industry.
Table 2. Share (in %) of “Forestry and logging” in the economy of Estonia, Latvia, Lithuania and Finland in 2015.
The greenhouse gas, mainly CO2, sequestration by forestland and harvested wood products is larger than the GHG emitted by the “Forestry and logging” industry ().
Table 3. GHG emissions in thousand ton CO2 equivalent by “Forestry and logging” industry, forest land and harvested wood products in 2015.
Data
Input-Output (IO) tables give a numerical overview of an economy (OECD Citation2019). The tables are presented either commodity-by-commodity (i.e. the products and services needed to produce a commodity) or industry-by-industry (i.e. the commodity produced by an industry to produce the output of an industry). In the rest of this paper, for simplicity, we refer to the IO tables as being industry-by-industry. This has no consequences for the analysis and is just a matter of how commodities and industries are defined. IO tables contain industries using intermediate inputs, imports, labour, and capital as factor inputs whose value equals value added, but also final demand (private household consumption, government consumption, investment demand, and export demand).
This research uses the most recent 2015 commodity-by-commodity IO-tables for Estonia (Statistics Estonia Citation2018), Latvia (CSB Latvia Citation2016), and Lithuania (Lietuvos Statistikos Citation2019) and an industry-by-industry IO table for Finland (Statistics Finland Citation2022). The size of the IO tables differs by country. The IO table of Estonia has 61, Latvia 62 and Lithuania 60 commodities, and Finland has 63 industries. Data are compiled according to the European Union’s statistical classification of economic activities (NACE) and are expressed in basic prices (million euros). In addition to the data from the IO tables, we use employment data from the EU labour force survey (Eurostat Citation2022b), and CO2 emission data are obtained from the EU air emissions accounts (Eurostat Citation2022a). To avoid double counting, it is considered that forest biomass harvested for its use as energy is reported as instantaneous GHG emissions by the forestry sector. These emissions are therefore set to zero in the energy sector, this is a standard practice in national accounting (Pingoud et al. Citation2019; Camia et al. Citation2021).
Model
We use an IO method developed by Harthoorn (Citation1989) that makes it possible to calculate the forest-based bioeconomy by isolating the relevant inter-industry transactions from an IO table. The method is based on standard input-output analysis (Schumann Citation1968; Miller and Blair Citation2009).
For the analysis, it is necessary to define selection and residual vectors. The elements of these vectors can take values between 0 and 1. These vectors behave like a switch, which allows or block product flows in matrices. The elements of the selection vectors ( are defined as:
(1)
(1) where Sm is the subset m of industries in the IO table. “Forestry and logging” (A02) form subset 0. “Manufacture of wood of products of wood and cork, except furniture; articles of straw and plaiting materials” (C16) and “Manufacture of paper and paper products” (C17) are considered processing industries that belong completely to the forest-based economy and therefore belong completely to subset 1. Other industries can belong partially to subset 1 depending on the definition of the forest-based bioeconomy that is used (see scenarios). The subsets are disjoint (i.e. do not overlap). Residual vectors are the complement of the sum of the selection vectors of which subscripts are less than or equal to m. Therefore,
(2)
(2) where: sm(n): selection vector; rm: residual vector; i: summation vector (vector with ones).
To clarify the concept of selection and residual vectors, we use a simplified version of the model as an example. Suppose that there are four industries in an economy. The first industry (first row and column in the input-output table) is “Forestry and logging”. The second industry (second row and column in the input-output table) is a processing industry that is completely dependent on forestry. The other two industries deliver direct and indirect inputs to forestry and the processing industry. It should be noted that both “Forestry and logging” and the processing industry can provide input to the other industries. The following vectors can be defined
selection vector for “Forestry and logging”
residual vector for “Forestry and logging”
selection vector for processing industry
residual vector for “Forestry and logging” and processing industryIf a hat (for instance
) is put above a vector this vector becomes a diagonal matrix. A diagonal matrix contains only zeros except on the diagonal (upper left to bottom right corner) where it contains the elements of the vector. Now the production, value added, employment, and CO2 emissions of the forestry-based bioeconomy can be determined.
The production needed for the delivery of one unit of output of an industry can be represented by the Leontief inverse (see, for instance, Miller and Blair Citation2009). The output generated in industries that is necessary to produce one unit of output in “Forestry and logging” is (outcome presented as a matrix):
(3)
(3) where:
: matrix of input coefficients; I: identity matrix;
: Leontief inverse.
The elements of the matrix of input coefficients () can be calculated by dividing the matrix of intermediate inputs (upper left corner of an IO table showing the deliveries of inputs by industries to industries) by the corresponding column total.
The production of other industries, which can be attributed to the production of “Forestry and logging” (i.e. indirect and direct backward linkages of “Forestry and logging”) can be obtained by:
(4)
(4) The production of the processing industries, with exclusion of production and direct and indirect deliveries to “Forestry and logging” (i.e. the first forward linkage of “Forestry and logging”) equals:
(5)
(5) The production of other industries, which can be exclusively attributed to the direct and indirect deliveries to the processing industries (i.e. indirect and direct backward linkages of processing industries with the exclusion of “Forestry and logging” with its direct and indirect backward linkages) equals:
(6)
(6) To simplify the analysis, we decided not to include the processing of the output of processing industries.
The total production of the forest-based bioeconomy equals the sum of the expressions in equations (3-6) and after multiplying the resulting vector by the vector of total final demand. Total production is:
(7)
(7) where: y: vector of production; ƒ: vector of final demand.
Next, we assume for each industry a fixed ratio between production and value added, between production and employment and between production and CO2 emissions (i.e. fixed IO coefficients of value added, employment, and CO2 emissions, respectively). The value added, employment, and CO2 emissions of the forest-based bioeconomy can then be determined as:
(8)
(8) where:
: vector of value added or employment or CO2 emissions;
: diagonal matrix of value added or employment or CO2 emissions IO coefficients.
Scenarios and results
Scenarios
It is rather arbitrary how to define processing industries (see for instance Lazorcakova et al. Citation2022), one option is to consider only the main processing industries completely, while another option is to add to this all other industries that process forest products but the latter only partially. Therefore, we define two alternative scenarios, each linked to an alternative definition to measure the forest-based bioeconomy:
In scenario I, we assume that the forest-based bioeconomy is comprised of “Forestry and logging” (C02) as the primary production industry and “Manufacture of wood of products of wood and cork, except furniture; articles of straw and plaiting materials” (C16) and “Manufacture of paper and paper products” (C17) as processing industries. Direct and indirect backward linkages of these industries are also included.
Scenario II includes, in addition to C02, C16, and C17, also all other industries that process outputs of “Forestry and logging”, but only partially. The extent to which they are assumed to be processing these outputs is assumed to be equal to the share of “Forestry and logging” in total intermediate input demand. Direct and indirect backward linkages of these industries are also included.
Notice that the outcomes of scenario II are by definition larger than the outcomes of scenario I because it includes more processing. To measure the forest-based bioeconomy we use the share in GDP, total employment, and CO2 emissions as indicators. In this way, we can perform a cross-country comparison.
Results
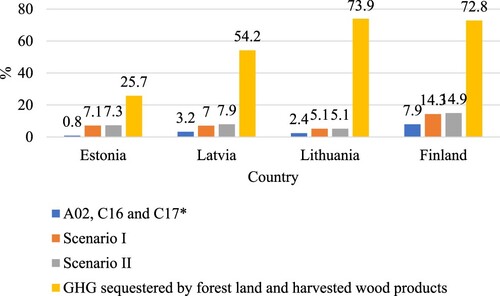
presents the outcomes of both scenarios. From it can be concluded that the forest-based bioeconomy is the smallest in Lithuania and in terms of the share in total value added and employment the largest in Estonia although the differences with Latvia and Finland are small. The size of the direct and indirect backward linkages are given by the difference between A02, C16, and C17 and Scenarios I and II. They are the largest in Estonia and Finland. This is caused by the existence of a large processing industry in these countries (see also ), which requires large amounts of (non-forestry) inputs. Latvia has a lower level of processing. CO2 emissions are especially high due to direct and indirect backward linkages. The share of CO2 emissions is relatively high in Finland, which can be explained by the paper industry in this country that uses a relatively large amount of fossil fuels. The differences between scenarios I and II are small indicating that output from “Forestry and logging” as an intermediate input mainly goes to C16 and C17 and not to other processing industries. Note that excludes CO2 sequestration.
Table 4. The share (in %) of “Forestry and logging” (A02) and the processing industries (C16 and C17) and of the forest-based bioeconomy in the two scenarios in value added (share in GDP), employment (share employment) and CO2 emissions (share CO2).
Considering the net CO2 emissions, shows that the forest-based bioeconomy is a “net sink” of carbon in all four countries. Given that in scenario II, compared to scenario I more non-forestry activities are included, CO2 emissions are larger, and net CO2 emissions are lower.
Figure 1. GHG emissions of the forest-based bioeconomy in 2015 in the first three columns, and its sequestration is the last column, in % of total GHG emissions/sequestration. *A02 – “Forestry and logging”, C16 – “Manufacture of wood of products of wood and cork, except furniture; articles of straw and plaiting materials”, C17 – “Manufacture of paper and paper products”.
Conclusions and discussion
The purpose of this paper was to present an input-output model of the forest-based bioeconomy to provide information on the contribution of the forest-based bioeconomy to GDP, employment, and CO2 emissions in Estonia, Latvia, Lithuania, and Finland. We find that forestry is a small industry in all four countries. For example, its contribution to GDP ranges from 0.40% in Lithuania to 1.90% in Finland. However, the forest-based bioeconomy is larger. For example, the contribution to GDP ranges from 3.59% in Lithuania to 7.22% in Estonia. The forest-based bioeconomy has negative net CO2 emissions due to CO2 sequestration by forestlands and harvested wood products despite the large CO2 emissions without the sequestration, ranging from a share in total emissions from 5.14% in Lithuania to 14.88% in Finland.
Our analysis indicates that while forestry itself maybe relatively small, the forest-based bioeconomy is substantial. This finding holds significant policy relevance. Employing appropriate measurement methods, such as the IO analysis presented, is crucial for making informed and balanced choices. For instance, solely considering the contribution of forestry to GDP overlooks the value-added creation in other industries connected to forestry. This oversight could result in underestimating the economic effects of environmental measures that affect forestry production. Additionally, the significance of the forest-based economy may grow in the future, as forestry products have the potential to replace fossil fuels (Knowledge Centre for Bioeconomy Citation2022).
Our analysis has some caveats that influence the validity of the results. First, the model that is used is a descriptive tool, and economic behaviour or policies that could influence the outcomes are not included. Second, we use the IO-tables of 2015 to analyse the importance of the forest-based bioeconomy due to the lack of data in recent years. Notably, outcomes can differ between years. Ideally, we would have information for a series of years that would enable us to detect and analyse the development of the forest-based bioeconomy over time. Finally, forests and the forest-based bioeconomy have many more functions than the ones investigated in this paper, an example would be biodiversity as indicated in Section 2. These have been excluded from our analysis. Despite these caveats, we feel that this paper provides valuable information to policymakers and stakeholders.
Disclosure statement
No potential conflict of interest was reported by the author(s).
References
- Camia A, Giuntoli J, Jonsson R, Robert N, Cazzaniga N, Jasinevičius G, Avitabile G, Grassi G, Barredo V, Mubareka S. 2021. The use of woody biomass for energy production in the EU. Luxembourg: European Union.
- CSB Latvia. 2016. Gross domestic product Supply-Use and Input-Output tables. [accessed 2022 December 11]. https://www.csb.gov.lv/en/statistics/statistics-by-theme/economy/GDP/IOT.
- European Commission. 2018. A sustainable Bioeconomy for Europe: strengthening the connection between economy, society and the environment Updated Bioeconomy Strategy. European Commission, Brussels. [accessed 2022 December 12]. https://op.europa.eu/en/publication-detail/-/publication/edace3e3-e189-11e8-b690-01aa75ed71a1/.
- European Commission. 2020a. How the bioeconomy contributes to the European Green Deal. [accessed 2022 April 28]. https://ec.europa.eu/info/sites/info/files/research_and_innovation/research_by_area/documents/ec_rtd_greendeal-bioeconomy.pdf.
- European Commission. 2020b. EU Biodiversity Strategy for 2030 Bringing nature back into our lives. [accessed 2013 January 17]. https://ec.europa.eu/research/environment/index.cfm?pg = nbs.
- European Commission. 2021. COM2021572-new-EU-Forest-Strategy-for-2030-1. 572. [accessed 2023 January 20]. https://commission.europa.eu/document/cf3294e1-8358-4c93-8de4-3e1503b95201_en.
- Eurostat. 2021. EU trade since 1988 by CPA 2008, [DS-1060915]. [accessed 2023 January 17] https://appsso.eurostat.ec.europa.eu/nui/show.do?dataset = DS-1060915&lang = en.
- Eurostat. 2022a. Air emissions accounts by NACE Rev.2 activity (env_ac_ainah_r2). [accessed 2023 January 17]. https://ec.europa.eu/eurostat/databrowser/view/ENV_AC_AINAH_R2/default/table?lang = en.
- Eurostat. 2022b. Employment by sex, age, and detailed economic activity (from 2008 onwards, NACE Rev.2 two digit level) - 1 000. [accessed 2023 January 17]. https://data.europa.eu/data/datasets/wumnysyeut8wtoobkz5r3g?locale = en.
- Eurostat. 2022c. Land cover for FAO Forest categories by NUTS 2 regions. [accessed 2023 January 17]. https://data.europa.eu/data/datasets/6h7abbpf8ukzq5y1nfp8wq?locale = en.
- Eurostat. 2022d. National accounts aggregates by industry (up to NACE A*64) [nama_10_a64. [accessed 2023 January 17]. https://ec.europa.eu/eurostat/databrowser/view/nama_10_a64/default/table?lang = en.
- Gustafsson L, Bauhus J, Asbeck T, Augustynczik ALD, Basile M, Frey J, Gutzat F, Hanewinkel M, Helbach J, Jonker M, et al. 2020. Retention as an integrated biodiversity conservation approach for continuous-cover forestry in Europe. Ambio. 49(1):85–97. doi:10.1007/s13280-019-01190-1.
- Harthoorn R. 1989. On the integrity of data and methods in the static open leontief model. thesis fully external. Enschede: University of Twente.
- Harthoorn R, Wossink GAA. 1987. Backward and forward effects of Dutch agriculture. European Review of Agricultural Economics. 14(3):325–333. doi:10.1093/erae/14.3.325.
- Konstantinaviciute I, Byčenkienė S, Kavšinė A, Smilgius T, Zaikova I, Juška R, … Ziukelyte I. 2017. Lithuania`s National Inventory Report 2017, Greenhouse Gas Emissions 1990-2020. [accessed 2023 January 10]. https://am.lrv.lt/uploads/am/documents/files/ŠESD apskaitos ir kt ataskaitos/LT_NIR_2017_04_14_FINAL.pdf.
- Knowledge Centre for Bioeconomy. 2022, February 28. Forest-based bioeconomy for climate change mitigation. [accessed 2023 January 15]. https://knowledge4policy.ec.europa.eu/bioeconomy/topic/forest-bioeconomy-cc-mitigation_en..
- Lazorcakova E, Dries L, Peerlings J, Pokrivcak J. 2022. Potential of the bioeconomy in visegrad countries: An input-output approach. Biomass Bioenergy. 158:106366.
- Lietuvos Statistikos D. 2019. Input-Output table at basic prices, domestic output and imports, 2015 (EUR mill.). [accessed 2022 December 14]. https://osp.stat.gov.lt/en/nacionalines-saskaitos.
- Mainar-Causapé AJ, Philippidis G, Sanjuán-López AI. 2021. Constructing an open access economy-wide database for bioeconomy impact assessment in the European union member states. Economic Systems Research. 33(2):133–156. doi:10.1080/09535314.2020.1785848.
- Miller RE, Blair PD. 2009. Input-Output analyses, Foundations and Extensions. [accessed 2022 December 10]. https://books.google.lv/books?id = SmFUl-6X1FUC&lpg = PA557&ots = lXQFT8SyuF&dq = direct and indirect linkages input output model&hl = lv&pg = PA557#v = onepage&q = direct and indirect linkages input output model&f = false.
- Ministry of the Environment of Republic of Estonia. 2020. Greenhouse Gas Emissions in Estonia 1990-2019. National Inventory Report Submission to the UNFCCC Secretariat. [accessed 2023 January 10]. https://unfccc.int/documents/273444.
- Mosley F, Van Brusselen J. 2024. Mapping Finland’s regional forest bioeconomy plans. Scandinavian Journal of Forest Research. 39(1):20–29. doi:10.1080/02827581.2023.2282087.
- Naumov V, Manton M, Elbakidze M, Rendenieks Z, Priednieks J, Uhlianets S, Yamelynets T, Zhivotov A, Angelstam P. 2018. How to reconcile wood production and biodiversity conservation? The Pan-European boreal forest history gradient as an “experiment.”. J Environ Manag. 218:1–13. doi:10.1016/j.jenvman.2018.03.095.
- OECD. 2019. Input-Output Tables (IOTs). [accessed 2022 December 10]. https://www.oecd.org/sti/ind/input-outputtables.htm.
- Pingoud K, Skog KE, Martino DL, Tonosaki M, Xiaoquan Z. 2019. 2006 IPCC Guidelines for National Greenhouse Gas Inventories, Agriculture, Forestry and Other Land Use, Harvested Wood Products. Vol. 4, pp. 1–33. [accessed 2024 January 14]. https://www.ipcc-nggip.iges.or.jp/public/2006gl/pdf/4_Volume4/V4_12_Ch12_HWP.pdf.
- Schumann J. 1968. Input-Output-Analyse. Berlin, Heidelberg: Springer.
- Skrebele A, Rubene L, Lupkina L, Cakars I, Siņics L, Lazdāne J, Zustenieks G. 2020. Latvia’s National Inventory Report 1990–2018, Submission under UNFCCC and the Kyoto Protocol. [accessed 2023 January 21]. https://unfccc.int/sites/default/files/resource/lva-2020-nir-11may20.pdf.
- Smyth CE, Xu Z, Lemprière TC, Kurz WA. 2020. Climate change mitigation in British Columbia’s forest sector: GHG reductions, costs, and environmental impacts. Carbon Balance Manage. 15:1–22. doi:10.1186/s13021-020-00155-2.
- Sotirov M, Schulz T, Winkel G. 2021. How to balance forestry and biodiversity conservation-A view across Europe. European Forest Institute and Swiss Federal Research Institute WSL, 62-75.
- Sousa-Silva R, Verbist B, Lomba Â, Valent P, Suškevičs M, Picard O, Hoogstra-Klein MA, Cosofret VC, Bouriaud L, Ponette Q, et al. 2018. Adapting forest management to climate change in Europe: linking perceptions to adaptive responses. Forest Policy and Economics. 90:22–30. doi:10.1016/j.forpol.2018.01.004.
- Statistics Estonia. 2018. RAT00004: Symmetric product by product input-output table at basic prices (ESA 2010). [accessed 2022 December 10]. https://andmed.stat.ee/en/stat/majandus_rahvamajanduse-arvepidamine_sisend-valjundtabelid/RAT00004.
- Statistics Finland. 2022. 11h9–Input-Output table at basic prices, annually, 2015-2020. [accessed 2022 December 10]. https://pxdata.stat.fi/PXWeb/pxweb/en/StatFin/StatFin__pt/statfin_pt_pxt_11h9.px.
- Zlaugotne B, Ievina L, Azis R, Baranenko D, Blumberga D. 2020. Ghg performance evaluation in green deal context. Environmental and Climate Technologies. 24(1):431–441. doi:10.2478/rtuect-2020-0026.