Abstract
The objective of this study was to explore the protein expression pattern in normal endometrial mucosa (n = 5) and endometrial carcinoma (n = 15) of low (diploid) and high (aneuploid) malignancy potential by two-dimensional gel electrophoresis (2-DE). The specimens were evaluated for histopathologic subtype, stage and grade in relation to DNA ploidy. A match-set consisting of five samples from normal endometrium, eight diploid and seven aneuploid tumours was created. All the diploid and three of the aneuploid tumours were of endometrioid subtype, while the remaining four were of uterine seropapillary type. There were 192 protein spots differentiating diploid tumours from normal endometrium and 238 protein spots were separating aneuploid tumours from normal endometrium (p < 0.01). A cluster analysis based on 52 significantly deviating protein spots within the groups showed clustering and separation of the normal endometrium, diploid and aneuploid tumours. In conclusion this study showed significant differences in protein expression between normal endometrium and endometrial carcinoma as well as between endometrial carcinoma of low and high malignancy potential. In future studies these results may provide useful in finding new sensitive prognostic markers for endometrial cancer.
Endometrial carcinoma is one of the most common female malignancies in the western world and the third most common in Sweden. It is considered to have a favourable prognosis since it usually presents at an early stage with vaginal bleeding. About 70% of the patients present with a stage I cancer where the 5-year over all survival is 87% in large international series Citation[1]. In the western world stage I is even more common. In patient material from the Department of Gynaecologic Oncology, Radiumhemmet, Karolinska University Hospital, Stockholm, Sweden consisting of 376 women diagnosed between 1994 – 1995, 86% of the patients were in stage I at diagnosis Citation[2]. Stage, histopathology and grade are acknowledged prognostic factors Citation[1], Citation[3]. Despite excellent survival in stage I, the majority of recurrences occur in this stage because of its high frequency. In order to better predict which patients are at risk of relapse additional prognostic factors such as DNA ploidy have been evaluated and ploidy has provided independent prognostic information in several studies Citation[2], Citation[4–8]. Other attempts to evaluate genetic instability and its consequences have been made in order to find possible future prognostic factors. Using comparative genomic hybridisation (CGH) Citation[9], Citation[10] genetic aberrations as gains and losses on the individual chromosomes could be explored. CGH has been performed in many human neoplasias Citation[11]. In the past decade interest has been focused on the proteome, i.e. the complex protein expression pattern including isoforms and post-translational modifications. By two-dimensional gel electrophoresis (2-DE/ 2-D PAGE) protein expression in individual tumours can be assessed. It is a technique, capable of mapping thousands of polypeptides simultaneously in one gel Citation[12] and provides a useful tool for detection of potential diagnostic and prognostic markers Citation[13–15]. The development of computer-based semi-automated image analysis systems like PDQuest (BioRad Laboratories) and MELANIE (GE Health Care Uppsala Sweden) have made evaluation of the spots on the 2-DE gel maps much more efficient Citation[16], Citation[17]. Several proteins have already been identified and can be assessed by gel to gel matching, since information is available on public databases reached from web sites such as the World 2D-PAGE at the ExPASy server in Geneva, http://au.expasy.org/ch2d/. Mass spectrometry has become the method of choice for protein identification following separation by 2-DE Citation[18–23]. Protein expression by 2-DE has been examined in numerous tumour forms, for example breast cancer, colon cancer, lung cancer, renal and bladder cancer, ovarian cancer, cervical and vaginal cancer and in one endometrial cancer study Citation[23–36]. 2-DE and mass spectrometry in combination seem to be of great interest in identification of protein patterns in cancer diagnostics and prognostics.
The aim of this study is to explore the 2-DE protein expression pattern in normal endometrium and endometrial carcinoma in relation to genetic stability represented by diploid (low risk) and aneuploid (high risk) features reflecting malignancy potential.
Materials and methods
Patients
Fresh tumour material and normal endometrium were collected from women who underwent hysterectomy for endometrial cancer or benign affections during 1997 – 2003 at the Department of Obstetrics and Gynaecology at Karolinska Hospital, Stockholm Sweden. Only five normal endometrial specimens of 11 collected could be used for analysis due to difficulties in dissecting enough normal endometrial tissue from the underlying myometrium, since the endometrial layer is extremely thin in postmenopausal women. Three of these five women were pre or peri-menopausal. The entire material was collected by scraping the normal endometrial surface and non-necrotic areas within the tumour Citation[37]. This technique minimised admixture of myometrium and other types of non-endometrial tissue. Fifteen tumour specimens with tumour material of good quality and distinct ploidy patterns were selected. A senior pathologist checked the quality of the samples and only those with more than 95% tumour cells or with normal endometrial cells respectively were included in the analysis.
Median age at diagnosis was 74 years (range 47 – 91) in patients with endometrial carcinoma and 50 years (36, 50, 50, 55 and 64 years) in patients with benign endometrium.
Treatment
All women with endometrial cancer underwent total hysterectomy and bilateral salpingo-oophorectomy prior to adjuvant radiotherapy according to routine practice at the Department of Gynaecologic Oncology, Radiumhemmet, Karolinska University Hospital, Stockholm, Sweden. The two oldest women in this study had no adjuvant therapy due to severe health problems.
Stage
All women were surgically staged according to FIGO criteria Citation[38] with total hysterectomy and bilateral salpingo-oophorectomy. No routine lymph node sampling was performed. Twelve patients were in stage I, three in stage IIIa (spread to adnex) (). No patient was in stage II or IV.
Table I. Tumour data on patients included in the study.
Histopathology
Histopathological subtype and degree of differentiation were evaluated in the tumour specimens according to the FIGO Citation[38] grading system. Eleven tumours were of the endometrioid subtype while four were of the less common serous carcinoma (UPSC). Eight tumours were assessed as grade 1 (well differentiated); two as grade 2 (moderately differentiated) and five were judged as grade 3 (poorly differentiated) ().
The five benign endometrial specimens were obtained from women who had undergone hysterectomy because of myoma (two), benign adnexal tumours (two) and uterine prolapse (one).
Image DNA cytometry
DNA ploidy was performed on paraffin-embedded tumour specimens on Feulgen stained Citation[39] histopathological sections (8 µm) using image cytometry Citation[40]. The staining procedure, internal standardisation and tumour cell selection were based on methods described by Auer and Tribukait Citation[41]. DNA distribution profiles (histograms) were sampled from at least 100 interface nuclei of each specimen. All DNA values were expressed in relation to the corresponding staining controls, which were given the value 2c, denoting diploid DNA content.
The classification of the DNA profiles was done according to Auer et al Citation[42]. In the breast study we compared the protein expression pattern in “diploid” type I and clearly aneuploid (type IV) ().
Figure 1. Diploid cell population, b. Aneuploid cell population by image cytometry.
Specimens were selected to get fairly equal numbers of typically diploid and aneuploid specimens. The study included eight diploid and seven aneuploid samples.
Two dimensional gel electrophoresis
Sample collection
Samples of endometrial carcinoma (n = 15) and benign endometrium (n = 5) were obtained immediately after removal of the uterus. Cells were collected by scraping with a scalpel from the surface of the freshly cut tumour or normal mucosa and transferred into 2 – 5 ml ice cold culture medium, RPMI-1640® with 5% FCS (fetal calf serum), 0.2 mM PMSF (phenylmethyl sulfonylfluoride (Sigma)) and 0.064 mM benzamidine. This was followed by aspiration and squirting steps with a syringe and a 29-gauge needle to preferentially release the tumour cells, which are less attached to each other than the connective tissue cells. A two-phase nylon filter (pore sizes of 250 µm and 160 µm) was used to catch the remaining stromal components and to allow the passage of tumour cells. The validity of this method has been evaluated previously Citation[37].
The crude homogenised tissue with cells in culture medium are then under laid with ice cold Percoll, (GE Healthcare, Uppsala) centrifuged (Hettich Rotanta/RP) for 10 minutes at 400 g (1500 rpm) at +4°C. The cells of interest, free from connective tissue, mucus, myometrium, blood and other contaminating factors, are now concentrated in the interface between the Percoll fraction and the culture medium fraction, containing the FCS. The interface is collected and re-suspended in ice-cold PBS (phosphate buffer saline, Sigma) pH 7.4 containing 0.2 mM PMSF and 0.064 mM benzamidine, vortexed and centrifuged 3 minutes at 780 g (2100 rpm) and a second time, 5 minutes at 2755 g (4000 rpm). The cell pellet was stored in -70°C until cell extraction and sample preparation.
Sample preparation
The cells were extracted by osmotic chock. Milli Q water was added to the cell pellet and the cells were repeatedly frozen in liquid nitrogen and thawn four times. Protease inhibitors DNAse/RNAse (Worthington Biochemicals), reducing and solubilizing agents, β-Mercaptoethanol (Merck) and SDS, sodium dodecylsulfate (BioRad), were added. The protein cell extraction is lyophilised 4 – 6 hours. Lysis buffer (containing 7 M Urea (BioRad), 2M Thiourea (Riedel-de Haen), 65mM Dithiotreitol (DTT, BioRad), 1 M Titriplex III (Merck), 1.5% CHAPS, zwitterion detergent, 3-((3-cholamidopropyl)dimethyl ammonio)-1-propan sulfonate (Sigma)), 0.5% NP-40 (USB,USA), 5% Resolyt 4-8 (BDH Electran), 3.5 mM NaOH (Merck), 0.0001% PMSF, 0.01% Benzamidine (Sigma), 0.01% BHT, 2,6-di-tert,-butyl-4-methylphenol (Sigma)) were added and the samples thoroughly shaken for 3 hours at room temperature followed by a 15 minutes centrifugation at 13 400 g using a Eppendorf centrifuge, 5417R, Eppendorf. The solubilized proteins were enriched and collected in the supernatant and aliquoted.
Protein quantification
Protein concentrations of samples were determined by adding 25 µL concentrated assay reagent (Bio-Rad) to 1 µL solubilized sample diluted in 100 µL Milli-Q water using 96-well microtiterplates Citation[43]. A standard curve was constructed using different concentrations of bovine serum albumin. The plate was read using a Multiscan reader (Labsystems).
2-DE gel electrophoresis
Polypeptide separation by first dimension isoelectric focusing (IEF)
2-DE gel electrophoresis was performed as described by Franzén et al. Citation[37] and Okuzawa Citation[44]. Before application, all samples were diluted with rehydration buffer containing 7 M urea, 2 M thiourea, 65 mM 3-(3-chloramidopropyl) dimethylammonio-1-propanesulfonate (CHAPS), 0.5% immobilised 4 – 7 pH gradient (IPG) buffer, 0.3% dithiothreitol (DTT) and a trace of bromophenol blue. Seventy five micrograms protein of each sample was diluted in 300 µl rehydration buffer and applied to precast IPG strips (pH 4 – 7, 17 cm; Bio-Rad) for isoelectric focusing. The solubilized proteins were actively rehydrated into the IPG strips during 12 h at 20°C in a PROTEAN IEF Cell (Bio-Rad) and focused, reaching approximately 52 900 Vh (volt hour). Before entering the second dimension the strips were subsequently equilibrated in two steps, 15 min each, with 50 mM Tris-HCl, pH 8.8, in 6 M urea, 30% glycerol and 2% SDS. One percent DTT was included in the first and iodoacetamide (2.5%) in the second equilibration step.
Polypeptide separation by second dimension SDS PAGE.
The SDS-PAGE gels cast were slab gradient gels, 10 – 13% with piperazinediacrylamide, PDA, (BioRad) as a cross linker and the gel size were 1.5×200×230 mm. The IPG strips were carefully applied on top of the gels and fixed in position with a warm 0.5% agarose (Sigma) overlay. Electrophoresis was carried out at constant power 100 V reaching approximately 42 000 Vh. For image analysis, gels were stained with silver nitrate Citation[45], Citation[46].
Scanning, image analysis and statistical analysis.
2-DE gels were scanned at 84.7×84.7 µm resolution using a GS-710 imaging flatbed densitometer (BioRad). Data were analysed using PDQuest software 7.1.1 from BioRad Citation[47], polypeptide spots from benign mucosa, diploid and aneuploid tumours were matched to spots in the reference gel (“master” gel). Spot intensities were normalised, background was subtracted, spots were located, and the relative staining intensities were determined. Several known proteins served as landmarks to facilitate the gel matching.
A principal component analysis (PCA) was performed on the 20 gels to screen for outliers and clusters Citation[48]. Spot data from the PDQuest gel analysis package was transferred to the Spotfire statistical software (DecisionSite for Functional Genomics; www.spotfire.com). PCA is effective for identifying discriminating features in a data set by finding two or three linear combinations of the original features that best summarise the variation in the data. If a majority of the variation is captured by these two or three most significant principal components, group membership of many data points can be observed.
Statistical analysis
Spots were identified by a Boolean analysis of quantitative and qualitative changes combined with the non-parametric Mann-Whitney U-test (p < 0.01). The analyses included comparisons between normal (N) vs. endometrioid diploid (diplCa) cancer, normal vs. aneuploid cancer (aneuCa) and endometrioid diploid vs. aneuploid cancer on a 99% level of significance in the non-parametric Mann-Whitney U-test. In order to detect only those proteins that characterise each of the three groups Boolean analyses combining the calculations mentioned above were created and proteins in the overlapping area of N vs. diplCa and N vs. aneuCa were excluded. Principal component analyses were used to separate/ cluster the disease sub entities.
Results
The match-set consisted of 20 samples, five benign endometrial samples and 15 malignant tumours. Eight tumours were endometrioid and diploid. The seven remaining aneuploid specimens consisted of three endometrioid tumours and four UPSC.
Data on ploidy, histopathologic subtype, stage and grade in the fifteen tumours and the normal material are summarised in . Ploidy histograms of a typical diploid and aneuploid specimen are shown in .
In the 2-DE gels an average of 1876 spots/ gel could be resolved.
After 2-DE analysis and subsequent PDQuest evaluation a principal component analysis (PCA) was applied to the entire data set in order to identify outliers and define clusters. Using the entire match-set data, spotfire statistical analysis visualised the relationship between diploid tumours, aneuploid tumours and benign endometrial tissue in a three-dimensional PCA plot. Two samples, CP 35 (diploid) and CP 27 (aneuploid) were falling out of the pattern and considered as “outliers”. The aberrant location of these two samples was evaluated as an error in handling of specimens or admixture of irrelevant cells (myometrium or blood cells) and the samples were excluded from further analysis.
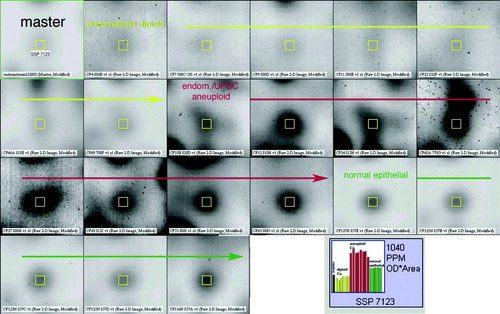
Statistical analysis by means of Mann Whitney test with a 99% significance level showed that there were 192 spots differentiating diploid tumours from normal mucosa. When comparing aneuploid tumours to normal mucosa in the same way, 238 spots separated them (). Forty-two spots separated aneuploid tumours from diploid. A Boolean analysis was used to find those spots that exclusively defined differences between normal endometrium, diploid and aneuploid tumours. By this method 83 spots were found in the diploid tumours but not in the aneuploid ones while 129 spots were expressed in the aneuploid tumours but not among the diploid ones. The PCA-cluster analysis based on 52 selected highly representative spots deviating in the three subentities gave a distinct separation of the three subgroups (). In a screen shot from the PDQuest analysis software the expression of one of the 52 spots (spot SSP 7123) was seen throughout all the members of the match-set, differentially expressed in benign, diploid and aneuploid cancer ().
Figure 2. a. 2-DE master image. Black spots are protein spots. The white markings (x) are the 192 spots differentiating normal from diploid samples by Mann-Whitney test with 99% significance level. b. 2-DE master image showing 238 spots (white x) differentiating normal from aneuploid samples by Mann-Whitney test with 99% significance level.
Figure 3. PCA plot of the protein expression data of the 52 spots able to group all match-set members. The normal cohort (green), diploid endometrioid cancer (yellow) and aneuploid endometrioid/UPSC cancer (red).
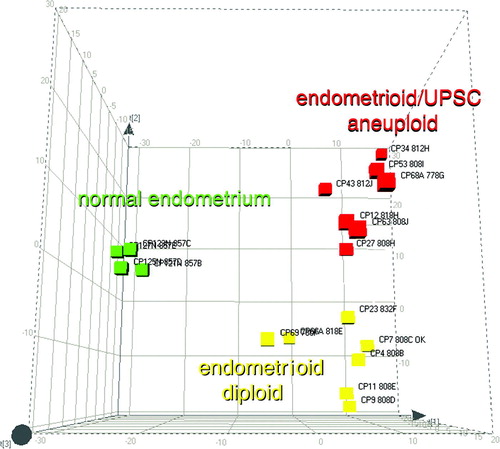
Figure 4. Screen shot from the PDQuest analysis software showing the inter-individual expression of Spot SSP 7123 through all the match-set members. The arrow lines separate the three sub-entities. The histogram shows the expression levels of the spot SSP 7123 throughout all gels. The highest expression levels are found in the aneuploid cancers (red columns).
The heterogeneity of each subgroup and within all members of the match-set was assessed by a correlation analysis (). When comparing two normal gels the correlation coefficient (r) was 0.76 (range within entire subgroup: 0.70 – 0.82), which represents a high correlation between the samples. In contrast, the r-value of a diploid cancer compared to a normal sample was 0.36 (range 0.28 – 0.37) and only 0.20 (range 0.19 – 0.22) when comparing a normal sample to an aneuploid tumour. The mean correlation coefficients values within the diploid and aneuploid groups were 0.67 (range 0.63 – 0.71) and 0.64 (range 0.59 – 0.66) respectively.
Figure 5. a–c: a. Scatter plot representing the correlation coefficient between two normal tissue samples (A and B) with r = 0.76 (range: 0.70 – 0.82). b. In contrast the r-value of one example normal vs. diploid endometrioid cancer showed 0.36 (range: 0.28 – 0.37) and c. 0.20 (range: 0.19 – 0.22) for the correlation between normal and aneuploid cancer.
Discussion
During the last decades great effort has been made to find markers that could separate low-risk from high-risk endometrial carcinoma. Stage, histopathology and grade of differentiation are the acknowledged prognostic factors Citation[3], but many tumours relapse in a way that was not anticipated. In order to better predict which patients are at risk of relapse additional prognostic factors like DNA ploidy have been evaluated. DNA ploidy is a method of assessing genetic imbalances. The diploid tumour is supposed to be more stable and less prone to spread while the aneuploid tumours with their scattered ploidy pattern are less stable and associated with more aggressive tumours. Ploidy has been evaluated as prognostic factor in a number of studies and shown to be an independent prognostic factor in some of these Citation[2], Citation[4–8]. Still only a limited number of aneuploid tumours relapse Citation[2], Citation[5] which does not make it an optimal prognostic factor. Other attempts to evaluate genetic instability or its consequences have been made in order to find possible future prognostic factors. Sub-chromosomal aberrations have been explored in different tumour forms Citation[11], Citation[49], Citation[50]. In endometrial cancer the most frequent aberrations found are gains at chromosomes 1q and 8q Citation[49], Citation[50].
In the last decade interest has been focused on the proteome, i.e. the complex protein expression pattern including isoforms and post-translational modifications that is the result of transcription of the genetic information in the cell. 2-DE protein expression in individual tumours can be assessed, followed by mass spectrometric identification of individual proteins. There are great expectations that different protein patterns in normal cell populations and tumour cell populations of low and high malignancy potential could, in the future, be used as both diagnostic, prognostic and treatment predictive tools.
The present study has shown highly significant differences in protein expression between benign endometrial tissue and endometrial carcinoma. Also strong significant differences were found between genetically stable tumours (diploid) with low malignancy potential and more genetically unbalanced (aneuploid) tumours with a high malignancy potential. In this study, 52 protein spots that deviated between the three groups (benign, diploid and aneuploid) could be selected which enabled clustering of all match-set members correctly. In a previous 2-DE protein expression study by Byrjalsen et al the expression of protein profiles of metabolically (35S)-methionine-labelled proteins in endometrial carcinoma has been studied. In this study 19 protein spots in five endometrial carcinomas showed increased expression compared to benign hyperplasia Citation[36].
In the present study the homogeneity between individual samples was high within the groups of benign, diploid and aneuploid tumours respectively while there was a distinct heterogeneity between members of the different groups. This is also found in a study of normal mucosa, polyps and adenocarcinoma of the colon Citation[23].
In colon cancer differential expression patterns of normal mucosa, polyps and adenocarcinoma have been defined Citation[23], Citation[25–27]. Roblick et al. found relative differences in protein expression levels between normal colon mucosa, adenoma, carcinoma and metastasis in tissue collected from the same patient Citation[23]. Statistically significant protein expression differences during the development from normal mucosa via polyp to cancer and/or metastasis were excised and 72 spots could be analysed by mass spectrometry. Cervical and vaginal cancers are shown to be homogeneous in their protein expression, which points at a common carcinogenesis Citation[35]. This is in contrast to ovarian cancer where pairs of different ovarian cancers have large heterogeneity Citation[51] and breast cancer where diploid and aneuploid tumours show high heterogeneity within each group Citation[24]. In lung cancer it was shown that different histopathological subtypes exhibit specific protein expression patterns Citation[28], Citation[29]. Protein expression in benign ovarian tissue, borderline and ovarian cancer has been defined and it was possible to discriminate between benign and malignant samples using a set of nine proteins Citation[30], Citation[31]. In renal cancer protein expression profiles were investigated and specific proteins were found exclusively expressed in normal or malignant tissue respectively Citation[32], Citation[33]. Proteomics is also used in bladder cancer diagnostics and follow up Citation[34].
The next step in this investigation is to perform a mass spectrometric analysis in order to identify the proteins separating normal endometrium from endometrial cancer and diploid tumours from aneuploid ones.
After identification of the differentially expressed proteins these data can be used to create protein sets characteristic of normal endometrium, endometrial carcinoma of high and low malignancy potential. The prognostic capacity of these sets could then be evaluated in larger patient materials.
Conclusion
This study showed highly significant differences in protein expression between normal endometrium and endometrial carcinoma as well as between endometrial carcinoma of low (diploid) and high (aneuploid) malignancy potential. After protein identification the 52 proteins that are able to provide a tight clustering in each group (benign, diploid and aneuploid) could have the potential of being used to create a prognostic marker-panel for endometrial carcinoma.
This work was supported by grants from The King Gustav V Jubilee Fund, Stockholm and the Karolinska Institute. U. J. Roblick received a research grant from the University of Schleswig-Holstein, Campus Lübeck. Local ethical committee approval November 6, 2000, number 00-385 and April 7, 2003, number 03-034.
References
- Creasman W, Odicino F, Maisonneuve P, Beller U, Benedet J, Heintz A, et al. FIGO Annual Report-Carcinoma of the corpus uteri. J Epidemiol Biostat 2001; 6(1)47–86
- Lundgren C, Auer G, Frankendal B, Moberger B, Nilsson B, Nordstrom B. Nuclear DNA content, proliferative activity, and p53 expression related to clinical and histopathologic features in endometrial carcinoma. Int J Gynecol Cancer 2002; 12(1)110–8
- Zaino RJ. Pathologic indicators of prognosis in endometrial adenocarcinoma. Selected aspects emphasizing the GOG experience. Gynecologic Oncology Group. Pathol Annu 1995; 30(1)1–28
- Zaino RJ, Davis AT, Ohlsson-Wilhelm BM, Brunetto VL. DNA content is an independent prognostic indicator in endometrial adenocarcinoma. A Gynecologic Oncology Group study. Int J Gynecol Pathol 1998; 17(4)312–9
- Lundgren C, Auer G, Frankendal B, Nilsson B, Nordstrom B. Prognostic factors in surgical stage I endometrial carcinoma. Acta Oncol 2004; 43(1)49–56
- Evans MP, Podratz KC. Endometrial neoplasia: Prognostic significance of ploidy status. Clin Obstet Gynecol 1996; 39(3)696–706
- Britton LC, Wilson TO, Gaffey TA, Lieber MM, Wieand HS, Podratz KC. Flow cytometric DNA analysis of stage I endometrial carcinoma. Gynecol Oncol 1989; 34(3)317–22
- Nordstrom B, Strang P, Lindgren A, Bergstrom R, Tribukait B. Carcinoma of the endometrium: Do the nuclear grade and DNA ploidy provide more prognostic information than do the FIGO and WHO classifications?. Int J Gynecol Pathol 1996; 15(3)191–201
- Kallioniemi A, Kallioniemi OP, Sudar D, Rutovitz D, Gray JW, Waldman F, et al. Comparative genomic hybridization for molecular cytogenetic analysis of solid tumors. Science 1992; 258(5083)818–21
- du Manoir S, Speicher MR, Joos S, Schrock E, Popp S, Dohner H, et al. Detection of complete and partial chromosome gains and losses by comparative genomic in situ hybridization. Hum Genet 1993; 90(6)590–610
- Knuutila S, Aalto Y, Autio K, Bjorkqvist AM, El-Rifai W, Hemmer S, et al. DNA copy number losses in human neoplasms. Am J Pathol 1999; 155(3)683–94
- O′Farell PH. High resolution two-dimensional electrophoresis of proteins. J Biol Chem 1975; 250: 4007–21
- Celis JE, Dejgaard K, Madsen P, Leffers H, Gesser B, Honore B, et al. The MRC-5 human embryonal lung fibroblast two-dimensional gel cellular protein database: Quantitative identification of polypeptides whose relative abundance differs between quiescent, proliferating and SV40 transformed cells. Electrophoresis 1990; 11(12)1072–113
- Wirth PJ, Luo LD, Fujimoto Y, Bisgaard HC, Olson AD. The rat liver epithelial (RLE) cell protein database. Electrophoresis 1991; 12(11)931–54
- Hanash SM, Baier LJ, McCurry L, Schwartz SA. Lineage-related polypeptide markers in acute lymphoblastic leukemia detected by two-dimensional gel electrophoresis. Proc Natl Acad Sci U S A 1986; 83(3)807–11
- Appel RD, Hochstrasser DF, Funk M, Vargas JR, Pellegrini C, Muller AF, et al. The MELANIE project: from a biopsy to automatic protein map interpretation by computer. Electrophoresis 1991; 12(10)722–35
- Appel RD, Vargas JR, Palagi PM, Walther D, Hochstrasser DF. Melanie II–a third-generation software package for analysis of two-dimensional electrophoresis images: II. Algorithms. Electrophoresis 1997; 18(15)2735–48
- Chalmers MJ, Gaskell SJ. Advances in mass spectrometry for proteome analysis. Curr Opin Biotechnol 2000; 11(4)384–90
- Choudhary JS, Blackstock WP, Creasy DM, Cottrell JS. Matching peptide mass spectra to EST and genomic DNA databases. Trends Biotechnol 2001; 19(Suppl 10)S17–22
- Gevaert K, Vandekerckhove J. Protein identification methods in proteomics. Electrophoresis 2000; 21(6)1145–54
- Jungblut P, Thiede B. Protein identification from 2-DE gels by MALDI mass spectrometry. Mass Spectrom Rev 1997; 16(3)145–62
- Cutler P. Protein arrays: The current state-of-the-art. Proteomics 2003; 3(1)3–18
- Roblick UJ, Hirschberg D, Habermann JK, Palmberg C, Becker S, Kruger S, et al. Sequential proteome alterations during genesis and progression of colon cancer. Cell Mol Life Sci 2004; 61(10)1246–55
- Franzen B, Linder S, Alaiya AA, Eriksson E, Fujioka K, Bergman AC, et al. Analysis of polypeptide expression in benign and malignant human breast lesions. Electrophoresis 1997; 18(3-4)582–7
- Jungblut PR, Zimny-Arndt U, Zeindl-Eberhart E, Stulik J, Koupilova K, Pleissner KP, et al. Proteomics in human disease: Cancer, heart and infectious diseases. Electrophoresis 1999; 20(10)2100–10
- Stulik J, Koupilova K, Osterreicher J, Knizek J, Macela A, Bures J, et al. Protein abundance alterations in matched sets of macroscopically normal colon mucosa and colorectal carcinoma. Electrophoresis 1999; 20(18)3638–46
- Stulik J, Osterreicher J, Koupilova K, Knizek, Macela A, Bures J, et al. The analysis of S100A9 and S100A8 expression in matched sets of macroscopically normal colon mucosa and colorectal carcinoma: The S100A9 and S100A8 positive cells underlie and invade tumor mass. Electrophoresis 1999;20(4-5):1047–54.
- Schmid HR, Schmitter D, Blum P, Miller M, Vonderschmitt D. Lung tumor cells: A multivariate approach to cell classification using two-dimensional protein pattern. Electrophoresis 1995; 16(10)1961–8
- Hirano T, Fujioka K, Franzen B, Okuzawa K, Uryu K, Shibanuma H, et al. Relationship between TA01 and TA02 polypeptides associated with lung adenocarcinoma and histocytological features. Br J Cancer 1997; 75(7)978–85
- Alaiya AA, Franzen B, Fujioka K, Moberger B, Schedvins K, Silfversvard C, et al. Phenotypic analysis of ovarian carcinoma: Polypeptide expression in benign, borderline and malignant tumors. Int J Cancer 1997; 73(5)678–83
- Alaiya AA, Franzen B, Hagman A, Silfversward C, Moberger B, Linder S, et al. Classification of human ovarian tumors using multivariate data analysis of polypeptide expression patterns. Int J Cancer 2000; 86(5)731–6
- Sarto C, Marocchi A, Sanchez JC, Giannone D, Frutiger S, Golaz O, et al. Renal cell carcinoma and normal kidney protein expression. Electrophoresis 1997; 18(3-4)599–604
- Sarto C, Deon C, Doro G, Hochstrasser DF, Mocarelli P, Sanchez JC. Contribution of proteomics to the molecular analysis of renal cell carcinoma with an emphasis on manganese superoxide dismutase. Proteomics 2001; 1(10)1288–94
- Celis JE, Wolf H, Ostergaard M. Bladder squamous cell carcinoma biomarkers derived from proteomics. Electrophoresis 2000; 21(11)2115–21
- Hellman K, Alaiya AA, Schedvins K, Steinberg W, Hellstrom AC, Auer G. Protein expression patterns in primary carcinoma of the vagina. Br J Cancer 2004; 91(2)319–26
- Byrjalsen I, Mose Larsen P, Fey SJ, Nilas L, Larsen MR, Christiansen C. Two-dimensional gel analysis of human endometrial proteins: Characterization of proteins with increased expression in hyperplasia and adenocarcinoma. Mol Hum Reprod 1999; 5(8)748–56
- Franzen B, Linder S, Okuzawa K, Kato H, Auer G. Nonenzymatic extraction of cells from clinical tumor material for analysis of gene expression by two-dimensional polyacrylamide gel electrophoresis. Electrophoresis 1993; 14(10)1045–53
- FIGO stages-1998. revisions: Vulva, ovary, corpus. Gynecol Oncol 1989; 35: 125–7
- Gaub JA, Zetterberg G A. Quantitative cytochemical aspects of a combined Feulgen naphtol-yellow-s staining procedure for the simultaneous determination of nuclear and cytoplasmic proteins and DNA in mammalian cells. Exp Cell Res 1965; 92: 323–32
- Steinbeck RG, Auer GU, Zetterberg AD. Reliability and significance of DNA measurements in interphase nuclei and division figures in histological sections. Eur J Cancer 1999; 35(5)787–95
- Auer G, Tribukait B. Comparative single cell and flow DNA analysis in aspiration biopsies from breast carcinomas. Acta Pathol Microbiol Scand [A] 1980; 88(6)355–8
- Auer GU, Caspersson TO, Wallgren AS. DNA content and survival in mammary carcinoma. Anal Quant Cytol 1980; 2(3)161–5
- Bradford MM. A rapid and sensitive method for the quantitation of microgram quantities of protein utilizing the principle of protein-dye binding. Anal Biochem 1976; 72: 248–54
- Okuzawa K, Franzen B, Lindholm J, Linder S, Hirano T, Bergman T, et al. Characterization of gene expression in clinical lung cancer materials by two-dimensional polyacrylamide gel electrophoresis. Electrophoresis 1994; 15(3-4)382–90
- Morrissey JH. Silver stain for proteins in polyacrylamide gels: A modified procedure with enhanced uniform sensitivity. Anal Biochem 1981; 117(2)307–10
- Rabilloud T, Vuillard L, Gilly C, Lawrence JJ. Silver-staining of proteins in polyacrylamide gels: A general overview. Cell Mol Biol (Noisy-le-grand) 1994; 40(1)57–75
- Garrels JI. The QUEST system for quantitative analysis of two-dimensional gels. J Biol Chem 1989; 264(9)5269–82
- Jocliffe IT. Principal Component Analysis. Springer, New York 1986
- Kiechle M, Hinrichs M, Jacobsen A, Luttges J, Pfisterer J, Kommoss F, et al. Genetic imbalances in precursor lesions of endometrial cancer detected by comparative genomic hybridization. Am J Pathol 2000; 156(6)1827–33
- Sonoda G, du Manoir S, Godwin AK, Bell DW, Liu Z, Hogan M, et al. Detection of DNA gains and losses in primary endometrial carcinomas by comparative genomic hybridization. Genes Chromosomes Cancer 1997; 18(2)115–25
- Alaiya AA, Franzen B, Moberger B, Silfversward C, Linder S, Auer G. Two-dimensional gel analysis of protein expression in ovarian tumors shows a low degree of intratumoral heterogeneity. Electrophoresis 1999;20(4–5):1039–46. [pii].