Abstract
We test the hypothesis that a pulse of the anti-cancer agent doxorubicin renders cells more sensitive to ionizing radiation in a strongly time-specific, dose-specific manner.
We have treated cultured cells from a human tumor line, HepG2, with graded doses of two agents: doxorubicin (Dox) and ionizing radiation (XR), delivered in sequence-specific, time-specific, dose-specific patterns. We observe a strong increase in cell killing, up to 120 fold, between pulsed treatment with Dox followed exactly 4 hours later with acute XR. This effect is more pronounced for larger doses of irradiation (>7.5 Gy). These data demonstrate proof of principal in a model system that timing between agents may be an exceptionally important variable in using combined, multi-modal therapy in the treatment of cancer. Since the levels of Dox needed to induce substantial increases in cellular radiosensitivity may be achievable in vivo, we suggest that this phenomenon, which we refer to as time-targeted therapy (TTT), be considered for translation into the clinic if preclinical studies identify appropriate timing and toxicity for combined of Dox XR can be overcome.
Treating tumors with combinations of anti-cancer agents is a proven and useful approach to the therapy of cancer. Combining radiotherapy with chemical anti-cancer agents is especially attractive if the limiting toxicity of the chemical agent is in tissues remote from the irradiated volume. However the number of permutations and combinations in using two agents is large when sequence, dose levels, duration of exposure and intervals between doses are considered. In preliminary studies, we fortuitously observed that two much studied agents, doxorubicin (Dox) and ionizing radiation (XR), showed very strong interaction when radiation was delivered exactly 4 hours after a transient dose of Adriamycin. We therefore studied sequence-specific, interval-specific, dose-specific interaction in cell killing between these two agents in a human hepatocellular blastoma tumor cell line, HepG2.
Ionizing radiation (XR) is one of the most frequently used anti-cancer agents with approximately 50% of all cancer patients being treated with this agent. The toxic properties of radiotherapy have been studied in detail over the last century. Doxorubicin (Dox) has been used as an anti-cancer agent for over 20 years, applied to different histological types of cancer and its toxic effects have been well documented in the literature Citation[1], Citation[2]. Dox has also become an “archetypal” chemotherapeutic agent, being included in studies testing the relative potency of multiple anticancer agents in multiple biological systems Citation[3], Citation[4]. Dox has also been studied as an agent that interacts with free radicals and modulates chromatin structure Citation[5], Citation[6]. Thus, these studies of Dox not only have value both for therapy but also as a model agent for laboratory studies of tumor cell response to different forms of therapy.
An important aspect of our studies is to model the in vivo kinetics of Dox Citation[7], Citation[8] which shows a rapid serum clearance after bolus injection (half-life of ∼ 15 min). Thus we selected a one-hour pulse of Dox as the starting point for our in vitro studies for interaction between Dox and XR.
We selected HepG2 as the target cell system since we have earlier demonstrated that this cell line has endogenous ability to activate some chemical agents from an inactive to an active form. This line was derived from a human hepatocellular blastoma and has been widely used as a target cell line in genetic toxicology studies Citation[9–11]. Of course using a metabolically active cell line as a study tool creates the possibilities that observed effects might result from such activity. However in studies to be published elsewhere we will show two glioblastoma cell lines with no activating ability also show TTT, hence the activating properties of HepG2 cells are not essential for TTT studies reported here.
General interactions between Dox and XR have been studied by several authors Citation[12–20] and substantial interactions have been observed. However time-dependent interaction between a pulse of Dox and a subsequent larger fraction of XR has not been reported.
Material and methods
Cell culture
Briefly, cells are rendered into single cell suspensions (validated by microscopic examination) and plated into three to five 75 mm Petri dishes late on the afternoon before initiating treatment. Treatment procedures are initiated the next morning and multiplicity controls were performed that measured the number of cells per colony (multiplicity was less than 1.1 for all studies). Cell number measurements showed there was no significant cell growth for Dox-treated cells or irradiated cells during the first 24 hours.
Irradiation
Irradiation was performed in a Cs-137 irradiator at approximately 50 Gy/hr with cells in complete medium. Dox was administered in complete medium without serum to prevent any spurious binding between Dox and the serum component. Control studies showed that treatment of cells up to 5 hours with serum-free medium did not reduce plating efficiency. After the exposure period plates were rinsed three times with complete medium and then fresh medium containing serum was added.
Analysis of survival parameters and interaction coefficients
For all survival patterns we empirically determined two parameters that describe the rate of cell killing (logs10 killed per Gy) at lower doses and for higher doses. We measured the coefficient of the slope of the line from 0 Gy to 2 Gy and refer to this α. This coefficient is identical to the same coefficient determined by regression of the linear-quadratic model (LQ). At higher doses (>4 Gy) we performed linear regression analysis and designated the slope of this line as ω. This coefficient is related to the coefficient 1/Do from the slope-intercept model. Using the LQ model the term –ω D would correspond to –α D-β D2. Both coefficients have the units of logs10 of cells killed per Gy.
Since surviving fractions are fair estimates of the probability of a cell surviving a given treatment, we use Bayes’ Theorem to calculate a coefficient ξ that we term the interaction coefficient. We define ξ explicitly as the as the ratio between the fraction of cells killed by the two agents for combined therapy divided by the product of the fraction of cells killed by each agent when used independently. The coefficient ξ is a dimensionless ratio. Thus using this analysis, it is possible to express increased killing in quantitative terms for interactions using different variables and we will use this approach in our analysis.
Results
We measured survival in some detail for HepG2 cells exposed for 1 hour or 5 hours with graded doses of Dox up to 5.0 µgm/ ml. These data are shown in .
Figure 1. Cell killing by increasing concentrations of DOX for either a one hour or five hour exposure duration.
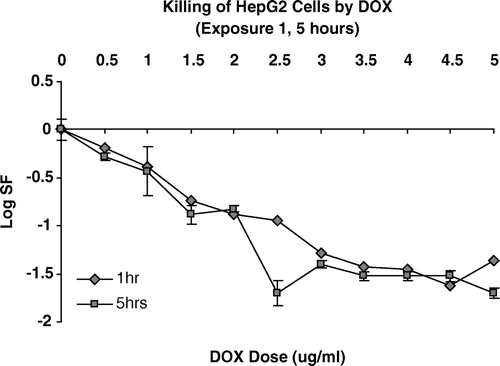
These data suggest a biphasic response pattern with a decrease in the rate of cell kill per unit dose at a dose-level between approximately 1.5 and 3.0 µgm/ml. Thus we concluded that the maximum rate of cell killing expressed as logs of cells killed per unit dose of Dox lies below 3.0 µgm/ml. These data also show that extending exposure duration from one to five hours does not increase direct cell killing significantly. This is strong evidence that the toxic effects produced by Dox are immediate and longer durations do not induce increased toxic effects. Based on the data shown in we selected four doses of Dox as our initial test doses: 0.1, 0.3, 0.5 and 1.0 µgm/ml, and we selected 1.0 hour as the exposure duration.
We measured clonogenic survival in HepG2 cells after treatment with graded doses of ionizing radiation. These data are shown in .
Figure 2. Cell killing by graded doses of ionizing radiation in HepG2 cells. The terms –α × D and – ω × D represent the rates of cell kill at lower doses and higher doses respectively. The line –α × D represents cell killing estimated by the slope of a line from 0 dose to survival at 2.0 Gy and would be equivalent of the a coefficient from the linear-quadratic model; -ω × D is the rate of cell killing at higher doses determined by reiterative linear regression for dose points between 5 and 10 Gy and would be equivalent of –αD-βD2 using the linear-quadratic model.
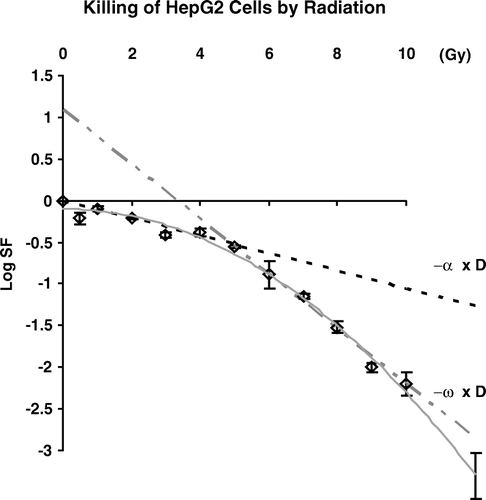
These data show a typical survival curve for human tumor cells and we extracted the slope of the lines determining survival at circa 2 Gy and for doses between 5 and 10 Gy. The values for these slopes, that we will term α and ω, are 0.19 and 2.98 logs killed per Gy respectively. These values are close to values obtained by deriving parameters using the linear-quadratic model (data not shown).
We sought to determine the extent to which pretreatment of HepG2 cells with 0.1, 0.3, 0.5 or 1.0 µgm/ml of Dox for one hour altered cell killing by acute doses of ionizing radiation delivered immediately after the removal of the drug. These are shown in .
Figure 3. Killing of HepG2 cells by graded doses of ionizing radiation delivered immediately after a one hour pre-treatment with DOX at the concentrations shown.
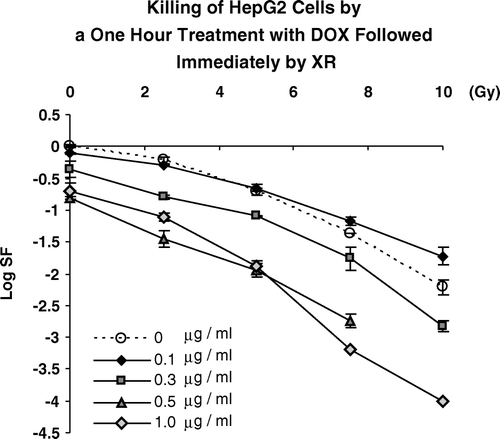
These data show that while there is a general trend for increased cell killing at higher doses of Dox and XR, there is decreased killing seen for cells receiving treatments with 0.1 µgm/ml combined with 7.5 and 10.0 Gy. This indicated that interactions between these two agents were not simple additive effects. To better show the trends in these interactions, we calculated the coefficient of interaction, ζ for each combined therapy and hence compared combined effects to the effects of the two agents delivered independently. These data are shown in .
Figure 4. Increased killing beyond independent action (ξ) expressed in logs10 for pretreatment with DOX at concentrations of 0.1, 0.3, 0.5 or 1.0 µgm/ml for one hour followed immediately by acutely delivered XR.
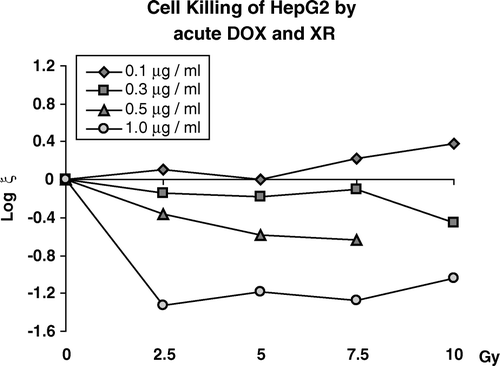
These data show that pretreatment of HepG2 cells for one hour of 0.1 µgm/ml of Dox both protects and sensitizes cells that survive the initial Dox treatment to subsequent graded doses of XR. The observation that log ζ is greater than zero indicates protection, when this value is less than zero there is additional killing. Note that exposure of cells to 0.3, 0.5, and 1.0 ug/ml produces a value of ξ that is less than zero showing increased cell killing at these higher doses of Dox. However there appears to be a “plateau effect” in which increasing XR doses does not increase cell killing beyond that observed at 2.5 Gy. Thus for immediate treatment, interaction is highly Dox-dose dependent but relatively independent of radiation dose.
We examined the influence of increasing intervals of time between exposure to Dox and subsequent exposure to ionizing radiation delivered at different doses. Cells were exposed to a dose of 1.0 µgm/ml of Dox for one-hour, rinsed and then exposed to graded doses of XR as a function of time. These data are shown in .
Figure 5. Survival curves for HepG2 cells exposed to DOX for one hour at a dose of 1.0 µgm/ml and then irradiated with graded doses of XR as a function of time after removal of the Adr.
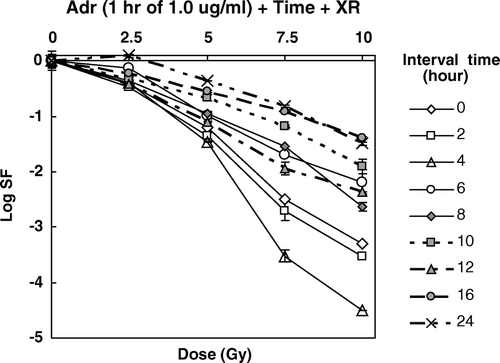
These data showed a strong time-dependent change in cell killing when the interval between the two agents was used as a variable. However the pattern of increased cell killing observed was complex and did not represent a monotonic increase or decrease. The variation in cell killing is more clearly seen when the survival data in are plotted directly as a function of time between a pulse of Dox and XR. These data are shown in .
Figure 6. Cell killing produced by a single exposure (1 hour) to 1.0 µgm/ml of DOX followed by graded doses of XR as a function of time after the Dox pulse.
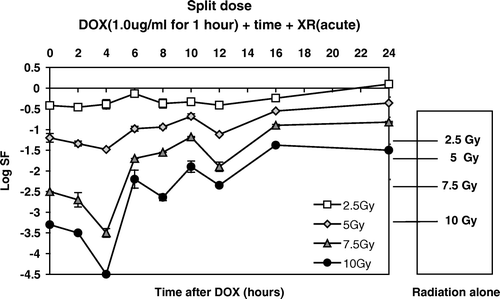
These data clearly show that the maximum cell killing is observed when the interval between Dox and XR is four hours. Note that at 24 hours interval, there is a general protection for all doses. These data also show that there is an apparent increased response of cells to higher doses (7.5 and 10.0 Gy) compared to lower doses. This observation is extremely important for considering translation of TTT to the clinic. Again, by changing variables this differential effect is more clearly seen and can be better described in quantitative terms. We transformed the data in into the interaction coefficient ζ at each dose and time point, to illustrate the increased killing beyond additive. In we show ξ as a function of interval between treatments.
Figure 7. The expression of additional killing beyond additive, ξ, by sequential exposure to DOX and XR as a function of time for four XR doses.
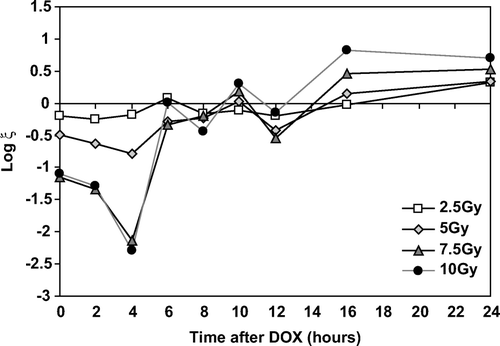
These data show that there are distinct patterns of increased killing beyond additive as a function of dose. An important observation is that for intervals of 16 hours or more, there is a protective effect at all doses. The eight data points for intervals of 16 hours and 24 hours are significantly greater than 0 while the 12 data points from 6 to 12 hours are not. There is clearly no variation between increased killing for 7.5 and 10.0 Gy up to 6 hours. This is an important observation as it indicates there is no additional increase in interaction when the XR dose is increased from 7.5 to 10.0 Gy. The three data points at 0, 2 and 4 hours for doses of 7.5 and 10.0 Gy are significantly lower (more toxic) than for 2.0 or 5.0 Gy exposures. Most importantly these data show that timing between intervals is critical to achieving maximum cell killing. Between 4 and 6 hours there is a decrease in cell killing both for 5.0 Gy and 10.0 Gy of approximately two logs. We interpret these data to emphasize that TTT is a robust effect but is highly dependent on precise timing. Importantly, compared to the patterns of ζ in , interaction is quite distinctly different when time is a variable.
Discussion
Data presented here achieve our goal of demonstrating proof-of-principal that cell killing induced by XR can be significantly enhanced when delivered exactly 4 hours after a pulse exposure to Dox. These studies will also serve as a well-defined paradigm for future studies by contrasting effects between a lower dose (e.g. 2 Gy) and a higher dose (e.g. 7.5 Gy) and contrasting response for an interval of 4 hours compared to 2 or 16 hours. Such a paradigm can be applied to: 1) planning studies on the molecular mechanisms that underlay these observations, 2) seeking other chemical agents that might induce TTT and 3) designing preclinical studies, especially for toxicity studies and time dependent in vivo studies, which are needed prior to considering translating this observation into the clinic.
One important point in interpreting these studies is that the effect is robust and if it can be translated into the clinic with tumor response paralleling cell response, a substantial effect might be expected. The increase in cell killing, compared to XR alone represents a factor of approximately 120 and a factor of approximate 10 compared to immediate irradiation after a pulse of Dox (1 µgm/ml).
It is important to seek the mechanism(s) that underlays TTT. Our studies determine certain characteristics of such a mechanism:
1) The mechanism that sensitizes cells to XR after a pulse of Dox must be very different from the process induced by a pulse of radiation, since over 4 hours after XR, cells become more resistant to XR, not more sensitive Citation[21]. Lee et al. Citation[22] have shown that cellular effects of Dox and XR act through pathways that are very different one from the other. Specifically these authors measured altered gene expression after challenges with Dox and XR and observed altered expression of 23 genes and 68 genes respectively. Surprisingly, there were no common genes altered by these two agents;
2) Cells are sensitized by TTT to larger radiation doses, >7.5Gy, compared to lower doses. This means that sensitization mechanisms that act at the level of induced free radicals, or any other mechanism that acts as a “dose-modifying-factor” probably must be eliminated. Since TTT works more efficiently when challenged with higher doses, mechanisms associated with such response should be considered. For instance the change in radiosensitivity seen with TTT would be interpreted using the LQ model as a change in the coefficient “β” that is hypothesized to be associated with multi-event DNA lesions and with changes in the rate of repair;
3) TTT acts in a very time-specific manner e.g. sensitivity increases from 2 to 4 hours and decreases at 6 hours. This underlays our preferred hypothesis that a pulse of Dox induces genes that are not fully expressed until 4 hours and then decay rapidly. One such gene expressed in this time frame is Topoisomerase II (Topo II). Indeed Theilmann and Popanda Citation[23] show that the kinetics for the induction of Topo II after a dose of Dox is very similar to the pattern observed for increased radiosensitivity. These authors show that Topo II overexpression begins at circa 2 hours, continues to increase until a decrease is observed at 6 hours. Our hypothesis would suggest that Dox-induced Topo II levels alter chromatin structure and Chapman Citation[24] has suggested changes in chromatin structure as important in radiosensitivity. Further Gerwitz Citation[5] has suggested the importance of changes in topoisomerase II as a toxic mechanism in tumor cells treated with anthracyclines.
While the goal for the studies presented here were proof-of-principal of TTT, we have also presented an analytical structure for future important studies. First, studies must be performed in xenograft tumors to identify the optimum time difference in vivo between Dox pulse and XR challenge. In such studies, using model tumors that vary in their vascular characteristics would be useful. Studies are needed that examine the state of DNA integrity and chromatin conformation at 4 hours after the Dox pulse. Second, susceptibility to XR-induced apoptosis and chromosome aberrations should be studied on the basis of time after a Dox pulse. Another set of experiments at both the cellular and molecular level should evaluate other anthracyclines for their potency for inducting TTT. If our hypothesis proves true, that the induction of Topo II is a critical mechanism in TTT, the search for agents that induce such changes without the toxic effects of Dox, would be an important effort. Our current approach is to seek variation in colorectal and glioblastoma cell lines that vary in TP53, ATM and 14-3-3σ and we have begun these studies. An important question in appreciating the possible clinical relevance of TTT, or any similar protocol, is whether the observed effect is dependent on the type of cell. We were concerned that the ability of HepG2 cells to activate some pro-carcinogens to a more active form might be involved in TTT. However as pointed out in the introduction, we now know that TTT is observed in two glioblastoma cell lines and we will publish this data elsewhere. We will test whether TTT is robust when tested in xenograft tumors that exhibit wide variation of vascular function and also determine the time at which maximum effect is observed.
Concomitant XR and Dox must be considered, in general, a treatment that can result in unacceptable toxicity. For TTT to be effective we opine that it be used in multiple cycles, each cycle comprised of a dose of Dox that will initiate TTT in tumor cells and followed at 4 hours (or another interval that elicits optimal response in xenograft studies) with a dose of XR. Thus for TTT to be effective, patients must tolerate a series of cycles of Dox at injected levels that can achieve serum (tumor) doses of Dox needed to sensitize cells in the culture dish (0.5, 1.0 µgm/ml). While this may be achievable in the clinic for a single dose, it is not clear whether multiple cycles will be too toxic unless appropriate recovery intervals can be inserted between cycles. Erttmann et al. Citation[25] have shown a nonlinear relationship between injection regimen and Dox serum level with larger injected single boluses (30 mg/m2 and 50 mg/m2) achieving a disproportionably higher serum levels of smaller doses. The standard single agent therapy with Dox is 60 – 75 mgm/m2 and this treatment can be repeated until cumulative therapy doses of 300 mg/m2 leads to cardiac toxicity in 1 – 2% of patients. Thus determining toxicity of multiple TTT cycles will need to be inferred or measured. Translation to the clinic must be implemented with great care.
Our studies suggest that for maximum interaction, a radiation dose of at least 7.5 Gy must be used. Interestingly, data in Figure 8 shows that increasing the challenging dose to 15 Gy from 7.5 Gy does not increase the TTT effect. Thus maximum effect is achieved at a dose level that is only 25% larger than the 6 Gy doses we are currently using in the clinic for hypofractionation with protons.
We are extremely interested in the use of larger fractions of radiation in the treatment of cancer, particularly with proton radiotherapy. Such hypofractionation protocols have three advantages for TTT compared to smaller fractions. First, large fractions (7.5 or larger) result in increased cell killing through TTT as shown in this paper. Third, the average amount of radiation delivered to normal tissue by proton radiotherapy, compared to the tumor, is decreased and hence the extent of local interaction in local normal tissue should be decreased. We do not know whether TTT will sensitize normal tissue to the same extent as we see sensitization of cultured tumor cells. Finally we suggest that TTT should be considered for priority study of toxicity induced by multiple cycles of this therapy using hypofractionation so that possible translation into the clinic can be considered.
In summary, we have made a new observation on chemical-enhanced radiosensitivity that is highly dependent on time between exposures and highly dependent on the size of the radiation dose used to challenge the pretreated cells. This observation that we call Time-targeted therapy (TTT) is robust and induces levels of increased cell killing that if this enhancement can be translated proportionally to the clinic would be predicted to enhance tumor response. Our observations are purely empirical but their strong time-dependent pattern lays an extremely specific paradigm for studies of mechanisms and for preclinical studies. At a time when conformal photon therapy and proton radiotherapy are being used to evaluate hypofraction in the clinic, TTT offers an extremely important approach to enhancing effects of larger fractions. While TTT is most effective under rather narrow conditions of Dox dose, XR dose and time intervals between the two agents, these conditions may be achievable in the clinic if severe toxicity can be avoided.
References
- Boor DJ, Hortobagyl GN. Anthracycline antibiotics in the treatment of cancer. Drugs 1994; 47: 223–58
- Hortobagyl GN. Anthracyclines in the treatment of cancer. An overview. Drugs 1997; 54(Suppl 4)1–7
- Pauwels OM, Gozy, et al. Cross resistance and collateral sensitivity between cytotoxic drugs and radiation in two human bladder cell lines. Radiother Oncol 1996; 39: 81–6
- Kanter PM, Schwartz HS. Adriamycin-induced DNA damage in human leukemia cells. Leuk Res 1979; 3: 277–83
- Gewirtz DA. A critical evaluation of the mechanisms of action proposed for the antitumor effects of the anthracycline antibiotics Adriamycin and daunorubicin. Biochem Pharmacol 1999; 57: 727–41
- Meijer C, Mulder NH, Timmer-Bosscha H, Zijlstra JG, de Vries EG. Role of free radicals in an adriamycin-resistant human small cell lung cancer cell line. Cancer Res 1987; 47: 4613–7
- Cummings J, Smyth JF. Pharmacology of adriamycin: The message to the clinician. Eur J Cancer Clin Oncol 1988; 24: 579–82
- Chevillard S, Vielh P, Campana F, Bastian G, Coppey J. Cytotoxic effects and pharmacokinetic analysis of combined adriamycin and X-ray treatments in human organotypic cell cultures. Anticancer Drugs 1992; 3: 133–7
- Danesi R, Fogli S, Gennari A, Conte P, Del Tacca M. Pharmacokinetic-pharmacodynamic relationships of the anthracycline anticancer drugs. Clin Pharmacokinet 2002; 41: 431–44
- Dearfield KL, Jacobson-Kram D, Brown NA, Williams JR. Evaluation of a human hepatoma cell line as a target cell in genetic toxicology. Mutation Res 1983; 108: 437–9
- Dearfield KL, Jacobson-Kram D, Huber BE, Williams JR. Induction of sister chromatid exchanges in human and rat hepatoma cell lines by cyclophosphamide and phosphoramide mustard and the effects of cytochrome P450 inhibitors. Biochem Pharmacol 1986; 13: 2190–205
- Durand RE. Adriamycin: A possible indirect radiosensitizer of hypoxic tumor cells. Radiology 1976; 119: 217–22
- Byfield JE, Lee YC, Tu L. Molecular interactions between adriamycin and x-ray damage in mammalian tumor cells. Int J Cancer 1977; 19: 186–93
- Byfield JE, Lynch M, Kulhanian F, Chan PY. Cellular effects of combined adriamycin and x-irradiation in human tumor cells. Int J Cancer 1977; 19: 194–204
- Harris JW, Shrieve DC. Effects of adriamycin and X-rays on euoxic and hypoxic EMT-6 cells in vitro. Int J Radiat Oncol Biol Phys 1979; 5: 1245–8
- Rowley R, Bacharach M, Hopkins HA, MacLeod M, Ritenour R, Moore JV, et al. Adriamycin and X-radiation effects upon an experimental solid tumor resistant to therapy. Int J Radiat Oncol Biol Phys 1979; 5: 1291–5
- Siemann DW, Sutherland RM. The interaction between adriamycin and radiation in a solid murine tumor. Radiat Res 1980; 83: 345–5
- Twentyman PR, Walls GA, Wright KA. The response of tumour cells to radiation and cytotoxic drugs--a comparison of clonogenic and isotope uptake assays. Br J Cancer 1984; 50: 625–31
- Peacock JH, Shipley WU, Steel GG, Stephens TC. Adriamycin sensitivity following “ultra” low dose rate irradiation of Lewis lung carcinoma in vivo. Int J Radiat Oncol Biol Phys 1985; 11: 2099–104
- Chae HJ, Kim HR, Lee WG, Kwak YK, Kim WH, Hong ST, et al. Radiation protects adriamycin-induced apoptosis. Immunopharmacol Immunotoxicol 2005; 27: 211–32
- Elkind Sutton. X-ray damage and recovery in mammalian cells in culture. Nature 1959; 184: 1293–5
- Lee SM, Yuon BH, Kim CS, Kim CS, Kang CH, Kim J. Gamma-irradiation and doxorubicin treatment of normal cells cause cell cycle arrest via different pathways. Mole Cells 2005; 20: 331–8
- Thielman HW, Popanda O. Doxorubicin and gamma rays increase the level of DNA topoisomerase II alpha in nuclei of normal and xeroderma pigmentosum fibroblasts. J Cancer Res Clin Oncol 1998; 124: 355–66
- Chapman, JD. Single hit mechanisms of tumour cell killing by radiation. Int J Radiat Biol 2003 Feb;79(2)71–81.
- Ertmann R, Erb N, Steinhoff A, Landbeck G. Pharmacokinetics of doxorubicin in man: Dose and schedule dependence. J Cancer Res Clin Oncol 1988; 114: 509–13