Abstract
Acute radiation proctitis was evaluated before, during and after radiotherapy (RT) for prostate cancer. The main aims of the study were to examine changes related to the increasing radiation dose, and identify surrogate markers of gastrointestinal (GI) reaction to radiation. Twenty consecutive prostate cancer patients scheduled for 7 weeks of conformal RT were prospectively included in a longitudinal study assessing symptoms, inflammation in rectal mucosa biopsies, and blood and stool samples at four time points (before RT and 2, 6 and 11 weeks after start of RT). Blood samples were examined for acute phase response-related markers, fatty acids (FAs), vitamin E and leukotriene B4 (LTB4). Lactoferrin, calprotectin and S100A12 were measured in stool samples and FAs in biopsies from rectal mucosa. The increase in histopathological inflammation reached a maximum 2 weeks after start of RT. Symptoms of GI toxicity increased with higher radiation dose and had not returned to pre-treatment level 4 weeks after RT. Lactoferrin concentrations in stool increased significantly at week 6. Significant decreases of vitamin E, leukocyte count, hemoglobin and some groups of FAs were discovered, while a few FAs increased significantly during the study period. Time courses vary between the selected indicators of acute radiation proctitis. The biopsy grading of inflammatory changes were most intense 2 weeks into the treatment period while symptoms continued to increase until week 6. Lactoferrin in stool samples could be a non-invasive marker of GI inflammation during RT. A transient decrease in vitamin E and some FAs during RT warrants further studies.
Acute toxicity may limit the radiation dose to the tumor. Normal tissue radiation effects during the course of radiotherapy (RT) are therefore important. The molecular and cellular events occurring during the RT period initiate many processes that eventually might cause chronic, troublesome symptoms and reduced quality of life. Understanding the mechanisms of radiotoxicity is necessary for developing therapeutic strategies to prevent or treat acute and late radiation damage.
This study describes changes over time for various subjective and objective indicators of radiation effects, to identify candidate surrogate molecular markers. Prostate cancer patients were examined with focus on acute radiation proctitis and individual changes induced by pelvic RT. The time-course of symptoms of acute gastrointestinal (GI) toxicity and histopathological inflammation in rectal mucosa biopsies were compared to biochemical measurements related to inflammatory responses and nutritional status.
Pre-clinical studies have indicated a relationship between the redox status of cells and their response to radiation-induced increase in reactive oxygen species (ROS) Citation[1], Citation[2]. The lipid mediators of inflammatory signal cascades, eicosanoids, are converted from fatty acids (FAs) by enzymatic conversion from arachidonic acid (AA) and eicosapentaenoic acid (EPA). Two of these enzymes are cyclooxygenase-1 and -2 (COX-1 and -2). Both COX-1 and COX-2 as well as prostaglandin E2 were expressed in increased amount in mouse and rat bowels after radiation Citation[3], Citation[4]. Enzymes in the cyclooxygenase pathway converts FAs to prostaglandins and tromboxanes while lipoxygenases produces leukotrienes Citation[5]. Concentrations of leukotriene B4 (LTB4), prostaglandin E2 and thromboxane B2 were all increased in rectal dialysate in ten patients during the course of pelvic RT Citation[6]. Plasma prostaglandin levels remained unchanged in 17 patients examined weekly through pelvic RT Citation[7]. In animal studies, many special diets, short-chain FAs, antioxidants like vitamins A and E and other interventions have proven useful in mitigating or preventing radiation enteropathy Citation[8]. Clinical studies are few; those addressing dietary modifications during pelvic RT were reviewed by McGough et al. Citation[9]. Probiotic supplementation, elemental diet and fat modified diets were regarded candidates for further investigations. Analyses of the physiological changes induced by abdominopelvic RT is a first step to answer questions related to this topic. Guren et al. Citation[10], Citation[11] identified transient decreases in nutrient intake, albumin, cobalamin and body weight during pelvic RT. Our present study describes changes related to pelvic RT which might yield information for future nutritional or other interventions during RT.
Material and methods
Patients and study design
Twenty patients (mean age 63 years, range 53–71) with prostate cancer (T1-3NxM0) scheduled for RT were consecutively included in the study from August to December 2003. Patients with a past or present history of significant GI disease (inflammatory bowel disease, celiac disease) were excluded. One patient had previously removed a benign colon polyp endoscopically. Five patients had cardiovascular diseases, three of which were treated for hypertensive disease only. The remaining two patients additionally used cholesterol-lowering medication and acetyl-salicylic acid. One of these two patients had a history of cardiac infarction; the other had been operated with a coronary bypass the same year as RT. One patient had diabetes mellitus type 2. Mean Body Mass Index (BMI) was 26.6, range 21.2–31.8 kg/m2. According to WHO criteria none were underweight (BMI < 18.5 kg/m2), six had normal weight (18.5–24.9 kg/m2), eleven were overweight (BMI 25–29.9 kg/m2) and three borderline obese (BMI > 30 kg/m2). Each examination included scoring of symptoms related to RT, dietary frequency questionnaire, collection of blood and stool samples, and biopsies from the anterior rectal mucosa. The times of the examinations were: 1) within a week before initiation of RT (week 0, baseline); 2) 2 weeks after start of RT (week 2); 3) 6 weeks after start of RT (week 6) and 4) 4 weeks after the last fraction of RT (week 11). During the 7 RT weeks, examinations were performed shortly before the RT fraction of that day.
All patients gave informed written consent to the study, which was approved by the Regional Committee of Medical Research Ethics.
Questionnaires for symptom scores, diet and smoking
GI symptoms were recorded by the physician in accordance with the patient's choice while presented to a selection of grading in numbers from 0–10; “0” meaning no problem with the item in question, “10” meaning severe problems Citation[12], Citation[13]. The 12 questions related to GI symptoms were applied from the validated QUFW94 questionnaire Citation[12]. Nine questions in our previously used questionnaire Citation[13] overlapped with the 12 selected questions from QUFW94, with the difference that the questions concerning fecal incontinence and blood on stool were graded 0–10 in QUFW94, and “yes/no” in our questionnaire. The discrepancies in the remaining questions concerned abdominal pain, mucous on stool, use of diapers and if the patient needed to defecate during nighttime. Five items (about problems with loose stools, cramps when passing stools, abdominal pain, problems with excessive gas or nausea) were summarized to a Total Symptom Score (TSS) as previously described Citation[13].
To assess the intake of food rich in fatty acids and antioxidants we developed an ad-hoc frequency questionnaire. The questions were posed as: “How many days during the last week did you eat ….”. The foods in question were: vegetables; fruit; cod-liver oil; vitamin supplements; nuts; fish and cultured dairy products. No dietary limitations were given, only the standard information from the department. This oral and written information advice caution with milk, fruit and uncooked vegetables in the case of diarrhea during RT.
Definitions of smoking habits were: never smoked regularly; former regular smoker; light smoker (≤10 cigarettes every day) or heavy smoker (>10 cigarettes every day).
Rectal mucosal biopsies
During rigid proctoscopy three forceps biopsies were obtained from the anterior rectal wall, 10 cm from the anal verge. Biopsies were fixed in methanolcarnoy and formalin, paraffin embedded and sectioned for histopathology. Grading of inflammatory changes was done slightly modified from previous studies () Citation[14]. Fibrous deposits in the basal membrane and stroma in lamina propria were visualized by staining with trichrom blue. Biopsy scoring related to inflammatory changes was graded from 0 to 4 for each of the nine characteristics (), and the total sum for each patient at each examination time was used for the analysis of individual changes and comparisons with other measurements of inflammation. Biopsies for FAs analyses were snap-frozen in liquid nitrogen.
Table I. Grading of histologic changes
Blood and stool sampling
Serum and EDTA-plasma samples were analyzed for routine laboratory tests, FAs, LTB4, vitamin E, thiobarbituric acid reactive substances (TBARS), calprotectin and S100A12. The plasma samples for LTB4 were centrifuged immediately, while all other blood samples were centrifuged for 10 min at 1600 g 30 min after venipuncture, separated and frozen at −80 °C. Vacutainers were protected from light due to later analysis of TBARS. Ten µM of indomethacin (Sigma-Aldrich) was added to the eicosanoid aliquots to inhibit early steps of prostaglandin synthesis. The patients collected minimum 50 g of stool in a plastic container the morning of the examination. The samples were frozen at -70°C for later protein extraction and analyses.
Fatty acids, LTB4, vitamin E and TBARS
Biopsies and blood samples were analyzed for 37 different FAs, LTB4, vitamin E and TBARS at the National Institute of Nutrition and Seafood Research (NIFES), Bergen. FA composition was determined by a gas liquid chromatography (GLC) described earlier Citation[15], Citation[16]. Plasma samples were analyzed in duplicates, biopsies as singlets without prior homogenization. LTB4 in plasma was detected by ELISA-kits from R&D Systems, London, United Kingdom. Vitamin E content (tocopherol isomers α,β,γ,δ) was analysed with high performance liquid chromatography (HPLC) Citation[17]. TBARS was measured spectrophotometrically as described earlier Citation[18]. LTB4, vitamin E and TBARS were tested in plasma duplicates. Normal reference range for vitamin E: 5–20 µg/ml.
Inflammatory markers calprotectin, S100A12 and lactoferrin
Stool samples were analysed at Department of Immunology and Transfusion Medicine, Ullevaal University Hospital, Oslo. Protein extraction from stool samples was performed according to the standard method Citation[19]. Briefly, feces was diluted in 1:50 of fecal extraction buffer, vortex mixed for 30 s, shaken at 1000 rpm for 30 min and centrifuged at 10 000 g for 20 min. The supernatant was assayed for calprotectin and S100A12. A second portion of the feces was homogenized according to a simplified method by Roche and assayed for calprotectin. Calprotectin was quantified by an ELISA as described previously Citation[20]. The reference concentrations for calprotectin in plasma were (mean±2SD) 0.32–1.97 mg/l. Upper reference limit of calprotectin in stool samples were 50 mg/kg. S100A12 was assayed in a recently developed ELISA from recombinant S100A12 Citation[21]. Briefly, polyclonal immunoaffinity purified antibodies were obtained from rabbit anti-serum to recombinant S100A12. The IgG-fraction of rabbit anti-S100A12 serum was used for coating of microwell plates and dilutions of the recombinant S100A12 were used as standards. The amount of S100A12 bound was determined by enzyme labeled immunoaffinity purified rabbit anti-S100A12. Samples were tested in duplicates. Optical densities were read at 405 nm after reaction with substrate for about 30 min. The reference concentrations for S100A12 were (mean±2SD) 0.03–1.75 mg/l in serum (based on 150 blood donors) Citation[21]. Stool samples for the lactoferrin assay were prepared and assayed according to the instructions of an ELISA-kit from TechLab, Blacksburg, VA, USA (IBD-SCAN™). Upper reference limit was 7.25 mg/kg.
Statistics
The statistics were performed with SPSS 13 (SPSS Inc, Chicago, IL) and R (The R Foundation for Statistical Computing, Vienna, Austria). Changes relative to the measurement (scores or concentrations) at baseline were analyzed by exact paired permutation tests. Spearman correlations were used to compare different measurements at each examination time. P-values < 0.05 were considered statistically significant (two-sided tests).
Results
Oncological treatment
All patients followed the planned RT schedule without treatment breaks or changes in the prescribed total dose. Fifteen had started maximal androgen blockade (MAB) before RT according to departmental routines previously described Citation[22]. All patients were treated with a four-field conformal box technique, 2 Gy fractions 5 days/wk, to a total of 70 Gy (one patient to 72 Gy). Seven patients were treated with a slightly larger field, with the craniocaudal upper limit in the L5-S1 interspace and the lower limit at the ischial tuberosity. The Gross Tumour Volume (GTV) was contoured by the responsible oncologist on 5 mm thick and 5 mm intervals’ slices on Computer Tomography scans, defined as the volume within the outer wall contour of prostate and seminal vesicles, as appropriate Citation[22]. Clinical Target Volume (CTV) was generated by adding 5 mm margins on GTV, and the Planning Target Volume (PTV) additionally 15 mm wider than CTV, except towards rectum, where 10 mm margins were applied Citation[22]. For the boost PTV from 50 to 70 Gy a margin of 10 mm to CTV was used, except for the 5 mm towards rectum. Mean dose to 50% of the rectal volume (rectum defined as the wall and content of rectum) was 45.4 Gy (95% CI 41.4, 49.4). Mean dose to 25% of rectal volume was 62.5 Gy (95% CI 59.1, 65.8).
Intercurrent diseases, medication, smoking and routine blood tests
Routine laboratory tests of albumin and creatinin were within the normal range for all patients. Liver enzymes were normal in 18 of the 20 patients. Two patients had increased liver enzymes 2 weeks into the RT period, normalizing after changes of the MAB-medication. Hemoglobin was significantly lower in week 6 and shortly after RT, and leukocyte count was significantly lower at all examinations after start of RT (). C-reactive protein (CRP) was above 11 mg/l at five of the 4×20 examinations, with 35 mg/l as the highest, concomitantly with a diagnosis of ulcus ventriculi. One patient had a microbiologically verified cystitis before RT, diagnosed and treated shortly after start of RT. Blood concentrations of CRP, calprotectin, S100A12 as well as leukocyte count was excluded from analysis for this patient ( and ). One patient used loperamid due to loose stools at the examination after RT. No other medication related to radiation toxicity was necessary. With the exception of one biopsy planned at week 6, all biopsies, questionnaires, blood and stool samples were collected according to the study protocol. Due to anal soreness, this patient abstained from the rectal mucosa biopsy, but consented to all the other examinations at week 6.
Table II. Concentrations of vitamin E, LTB4, TBARS, hemoglobin and leukocyte count
Table III. Concentrations of calprotectin, S100A12 and lactoferrin
At inclusion in the study, two patients had never smoked regularly and 11 were previous smokers. The remaining seven patients usually smoked above ten cigarettes a day. Two patients reduced their smoking and one stopped smoking during the study period.
Symptom and biopsy scores
The median of TSS increased with radiation dose, and had not returned to pre-treatment scores at week 11 (). Median and interquartile range (IR) of the TSS at baseline was 1 (0–3); at week 2: 2.5 (1–4.8); week 6: 4.5 (2.3–9) and week 11: 4.5 (2–7). TSSs at each examination time after start of RT were significantly different from baseline (p ≤ 0.028). One patient developed a gastric ulcer in week 6 and had a high score on nausea at the examination few days after start of medical treatment. Both questionnaires (our previously used and QUFW94) equally identified the patients with GI problems. Scores for incontinence or blood on stool (QUFW94) represented minor incontinence or blood recorded for 7 or less patients at each examination time. The WHO performance status identified three different patients having WHO grade 1 at one examination each. At all the other examinations WHO grade 0 was recorded.
Figure 1. Symptom scores (TSS) before, during and after radiotherapy. Median and interquartile range shown in black; individual patients’ TSS in grey. TSS: Total Symptom Scores: sum of scores from five questions grading nausea, abdominal pains, excessive gas, loose stools and painful defecations; “0” meaning no problem, “10” very much problem on each of the 5 questions. (n = 20)
The total biopsy score for all patients at the four examination times are shown in . Compared to baseline there was a significant increase to week 2 and week 6 (p < 0.001 for both) but no significant difference was found between baseline and week 11 (p = 0.342). Median sum (and IR) of scores at baseline were 3 (1–10.5); at week 2: 21 (14.3–24.8); week 6: 17 (13–20) and week 11: 4.5 (1.3–13.3), respectively. Recomputing the scores into a scale representing 100% for the maximum score and 0% for the minimum score of 0, the median scores were 8%; 58%; 47% and 13% at the examination times, respectively. The mean measured thickness of the basal membrane when stained by trichrome blue was 3.3, 4.0, 4.3 and 3.4 mm at the four examination times, respectively (). Similarly to the sum of scores, basal membrane thickness was significantly different from baseline at week 2 and 6 (p ≤ 0.026) but not at week 11 (p = 0.404).
Figure 2. Biopsy scores before, during and after radiotherapy. Median and interquartile range shown in black; individual patients’ sums in grey. Individual patients’ sum from the biopsy evaluation (). (n = 19)
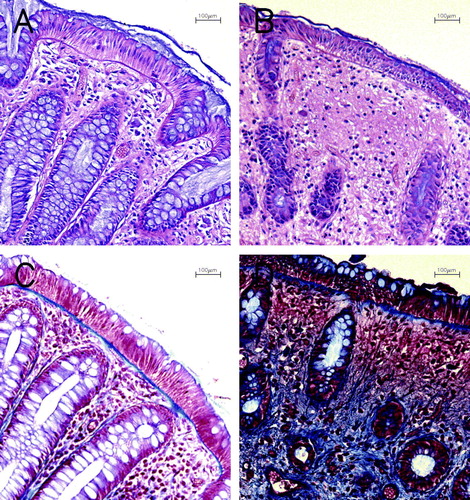
Figure 3. Histological sections from rectal mucosa biopsies. A and B: Hematoxylin & Eosin stained sections. A: Before RT. Note regularity of glands, goblet cells in epithelium and normal height of epithelium. B: Week 2. Reduced number of glands and goblet cells and atrophy of epithelium and fibrosis. C and D: Trichrom Blue staining of collagenous material. C: Before RT. Basal membrane is stained blue. D: Week 6. Increased collagen in lamina propria stroma and reduced number of glands. All photomicrographs at magnification×100.
Dietary intake; FAs, vitamin E, LTB4 and TBARS
Only minor changes in the frequency of intake of any of the nutrients examined during the study period were recorded. Frequency of intake of selected food items showed that most of the patients had a daily intake of vegetables, fruit, fish or supplements rich in essential FAs (often based on cod-liver oil). Half of the patients reported daily use of such supplements, and four patients reported daily intake of vitamin supplements. Four patients reported 5–7 days a week with intake of cultured dairy products, whereas three patients reported no intake of these products the preceding week. Nuts were usually eaten once a week.
Biopsy concentrations of the total amount of monounsaturated FAs and three individual FAs decreased significantly at week 2 (). The total amount of saturated and monounsaturated FAs and three FAs decreased significantly from before to after RT. One of the FAs of the n − 3 polyunsaturated FAs (PUFAs) increased significantly at week 2. In plasma samples the total amount of n-3 PUFAs and two FAs in this group increased significantly at week 6 (). The total amount of n − 6 PUFAs decreased significantly, similarly to the ratio of n − 6/n − 3 PUFAs and the ratio of 20:4n − 6 (AA) and 20:5n − 3 (EPA) at week 6. Concentrations of FAs in plasma and biopsies were analyzed for 25 other FAs which contribute to the sums presented. Data are not shown due to low concentrations (below 0.1 mg/ml). Vitamin E and TBARS decreased significantly at week 6 (, ).
Figure 4. Vitamin E in plasma before, during and after radiotherapy. Median and interquartile range shown in black; individual patients’ concentrations shown in grey. (n = 20)
Table IV. Fatty acids in rectal mucosa biopsies
Table V. Fatty acids in plasma samples
Calprotectin, S100A12 and lactoferrin
Significantly lower blood concentrations of S100A12 were found at week 6 (). All concentrations of calprotectin and S100A12 were within normal range.
Fecal lactoferrin and S100A12 concentrations increased significantly to week 6 (, ). Four patients had concentrations of both lactoferrin and calprotectin above normal limits at one or more examination times; additionally five patients had elevated lactoferrin concentrations only. Correlations of lactoferrin and calprotectin were significant (p ≤ 0.001) and substantial (Spearman's rho ≥ 0.702) at the four examination times. Comparisons of the standard extraction and Roche method for calprotectin determination in stool correlated significantly (p ≤ 0.006, rho ≥ 0.596) for all examination times.
Figure 5. Lactoferrin in stool samples before, during and after radiotherapy. Median and interquartile range shown in black; individual patients’ concentrations in grey. (n = 20)
Symptom and biopsy scores and relationship to biochemical measurements
Symptom scores did not correlate significantly with biopsy scores at any examination time. No significant correlations between lactoferrin in stool with biopsy scores or symptom scores were found (p ≥ 0.687 and −0.008 ≤ rho ≤ 0.099 for biopsy scores; p ≥ 0.290 and −0.249 ≤ rho ≤ 0.085 for symptom scores).
Comparisons of the four types (sums) of FAs in plasma and biopsy samples ( and ) showed significant correlation only at week 11, when the correlation between n − 6 PUFAs in plasma and in biopsies was 0.818 (p = 0.002, significant after Bonferroni correction for a group of 16 tests at week 11).
Discussion
The main findings of this study were the identification of patterns in longitudinal changes induced by the RT. Biopsy grading of inflammation showed a maximum at the first examination 2 weeks after start of RT (). In keeping with previous studies Citation[13], Citation[23], symptoms were most pronounced towards the end of RT (). Biochemical indicators of inflammatory reactions were examined, and stool concentrations of lactoferrin seems to be the best marker of acute radiation proctitis in this patient group (, ). The decrease in vitamin E at week 6 (, ) could indicate enhanced consummation of antioxidants. Depression of hematopoesis in pelvic bone marrow was mirrored by the fall in hemoglobin and leukocyte count at weeks 6 and 11 ().
Symptoms and biopsies
This study shows an early increase in biopsy scores of inflammatory changes in rectal mucosa and later development of symptoms ( and ). This confirms other studies showing histopathological signs of inflammation to be more intense at week 2 of RT compared to week 6 Citation[14] and GI toxicity symptoms to be worst at the end of RT Citation[13], Citation[22], Citation[23]. The discrepancy in time profiles between symptoms and biopsies may be partly explained by the fact that the biopsies are from superficial layers of the bowel, while deeper tissues were not examined. Processes detectable in mucosa may not be representative of the complex changes during RT, e.g. the signal substances leading to GI toxicity. The severity of GI symptoms during RT for pelvic cancers may increase the risk of late radiation injury Citation[23–28].The time profiles may therefore be in favor of prophylactic interventions before or concomitantly with the start of RT. Waiting for symptoms may accordingly appear to be too late for causal prophylaxis or treatment.
The presence of collagen material was assessed by biopsy staining (). Both the basal membrane thickness, sum of inflammatory scores (, ) as well as the fibrosis score in lamina propria stroma separately, were significantly higher at week 2 and 6, but not at week 11. However, the present study did not address individual risk profiles for late radiation enteropathy. This would require larger, prospective long-term studies. Dose-volume histograms (DVHs) for 70 Gy to rectum have been calculated for this patient group treated at our institution Citation[22]. DVHs for the three groups of CTV (prostate alone, prostate plus seminal vesicles and third, a modified pelvic field) were compared to acute toxicity symptom scores. When the three groups were analyzed together, there was a statistically significant correlation at 40 Gy between the fractional rectum volume and the incidence of GI toxicity Citation[22].
Measurements related to nutrition
The ratio between AA and EPA (and the ratio of n-6 PUFAs to n-3 PUFAs) is mainly determined by dietary intake of AA and EPA. The typical diet in Western countries consists of much more AA and n − 6 PUFAs than EPA and n − 3 PUFAs. By supplementing the diet with n − 3 PUFAs one might induce conversion to eicosanoids with less pro-inflammatory functions compared to the products of n − 6 PUFAs Citation[5]. A pilot study with 16 prostate cancer patients receiving either external RT or external RT plus implants of brachytherapy showed that rectal suppositories with misoprostol, a PGE1-analogue, reduced proctitis symptoms 4 weeks after external RT Citation[29]. However, no significant differences in histopathological or endoscopic scores could be found between six treated and five untreated patients.
The patients in our study were asked about intake of nutriments with relatively much n − 3 PUFAs (fish, nuts and supplements with these FAs). Almost all ate fish twice or more every week and half of the group took supplements on a daily basis, and the frequency of intake hardly changed during the study period. In plasma samples, the ratio of AA/EPA and n − 6 PUFAs/n − 3 PUFAs decreased significantly at week 2 and 6 (). We consider the changes in FAs to be induced by the RT, and that the reduction in AA/EPA ratio in plasma and reduction of saturated and monounsaturated FAs in biopsies are consequences of metabolic changes following the repeatedly generated ROS. Complicated repair processes and repeated injury occurs simultaneously during the many fractions of radiation Citation[30]. Blood samples were not taken on fasting patients and the statistics have not been corrected for many tests of FAs. Interpretations of our findings should therefore be drawn with great care until future studies might elucidate some of the many unknown factors in this process.
We interpret the decrease of vitamin E (, ) to be a result of the increased demand for anti-oxidant substances in cells exposed to ROS. Dietary intake of anti-oxidant sources (vegetables and fruit) did not change significantly during the study period, and the decrease of vitamin E is in concert with the findings of Guren et al. Citation[10], showing a transient decrease in cobolamin before, during and shortly after RT. Whether anti-oxidants should be given while the cancer is still under treatment is controversial Citation[31]. A review of prophylactic and therapeutic strategies in radiation enteropathy emphasizes the problem of differential protection, i.e. whether the tumor and normal tissues both benefit from the same interventions Citation[8]. Tumor protection has not been adequately followed up in the clinical studies evaluated, according to these authors Citation[8].
The bacteria composing the intestinal flora are important for the GI function, and a study comparing mice with and without enteric bacteria suggested that gut microbes affect the radiosensitivity of cells in the small intestine Citation[32]. Alterations in enteric flora most likely explain some of the GI symptoms during RT. One study recorded GI symptoms in 21 women before, during and six weeks after brachytherapy, hysterectomia and external RT for cervical or uterine carcinoma Citation[33]. The 11 patients given live Lactobacillus acidophilus cultures in a yoghurt product had significantly less diarrhoea at all examinations after treatment start compared to the ten in the control group.
Inflammatory markers
We aimed at identifying suitable surrogate markers of inflammation useful in future clinical studies. A non-invasive, objective marker correlating to histopathological scores of inflammatory changes would be preferable in evaluating effects of interventions aimed at reducing the risk of chronic radiation enteropathy. At this point no particular candidate marker in blood samples can be recommended. CRP has been suggested (high-sensitivity CRP), means increasing from 1.4 mg/l to 2.7 mg/l from start to end of RT in 51 patients Citation[34]. We did not measure concentrations below 10 mg/l with the routine method, and can thus not compare our data with their findings. The time-course of fecal excretion of inflammatory related proteins calprotectin and lactoferrin could resemble the one of symptom scoring, with a maximum at week 6 Citation[35]. In the present study we confirm the significant increase in lactoferrin but not calprotectin in stool samples. The patients and RT in the two studies are comparable, thus an explanation might be the relatively modest inflammation during RT, compared to the more extensive and pronounced inflammation present in inflammatory bowel diseases, where the two proteins are recognized as markers of intestinal inflammation Citation[36], Citation[37].
We have previously studied LTB4 in stool samples Citation[35], but could neither in plasma () nor stool find the same increase as in rectal dialysate Citation[6].
Conclusions
The sequential design of the present and previous studies from our and other groups confirms that the pattern of changes over time differs depending on which parameter is described or measured. Nutritional interventions or supplements could be of value as prophylaxis, but further studies are needed to identify suitable candidates. If future studies discover prophylactic interventions to alleviate proctitis, interventions should start at the beginning of RT, maybe even before, since inflammatory changes in biopsies precede GI symptoms. The transient decrease of vitamin E is in concert with other studies indicating altered nutritional needs. Whether these findings should lead to supplementation is an open question. Biochemical changes in the composition of FAs were observed, but their interpretation is not clear. To assess interventions, objective markers of GI inflammation in stool samples might be useful, e.g. lactoferrin and calprotectin. These markers should be examined in future studies, as should high-sensitivity CRP in blood samples. The discrepancy in time patterns of histopathology and GI toxicity could not be explained by the selected biochemical measurements investigated in this study.
Acknowledgements
The Martin Flatners grant, University of Bergen Cancer Research Grant, Inga Marie Larsine and Gabriel Tidemand Gabrielsen Grant (University of Bergen), the Norwegian Cancer Society and Western Norway Regional Health Authority supported the study. We thank Livar Frøyland, National Institute of Nutrition and Seafood Research, Bergen, for valuable advice.
Related Research Data
References
- Li L, Steinauer KK, Dirks AJ, Husbeck B, Gibbs I, Knox SJ. Radiation-induced cyclooxygenase 2 up-regulation is dependent on redox status in prostate cancer cells. Radiat Res 2003; 160: 617–21
- Steinauer KK, Gibbs I, Ning S, French JN, Armstrong J, Knox SJ. Radiation induces upregulation of cyclooxygenase-2 (COX-2) protein in PC-3 cells. Int J Radiat Oncol Biol Phys 2000; 48: 325–8
- Cohn SM, Schloemann S, Tessner T, Seibert K, Stenson WF. Crypt stem cell survival in the mouse intestinal epithelium is regulated by prostaglandins synthesized through cyclooxygenase-1. J Clin Invest 1997; 99: 1367–79
- Keskek, M, Gocmen, E, Kilic, M, Gencturk, S, Can, B, Cengiz, M, et al. Increased expression of cyclooxygenase-2 (COX-2) in radiation-induced small bowel injury in rats. J Surg Res 2006; (in press).
- Arslan G, Brunborg LA, Froyland L, Brun JG, Valen M, Berstad A. Effects of duodenal seal oil administration in patients with inflammatory bowel disease. Lipids 2002; 37: 935–40
- Cole AT, Slater K, Sokal M, Hawkey CJ. In vivo rectal inflammatory mediator changes with radiotherapy to the pelvis. Gut 1993; 34: 1210–4
- Lifshitz S, Savage JE, Taylor KA, Tewfik HH, Van Orden DE. Plasma prostaglandin levels in radiation-induced enteritis. Int J Radiat Oncol Biol Phys 1982; 8: 275–7
- Hauer-Jensen M, Wang J, Denham JW. Bowel injury: Current and evolving management strategies. Semin Radiat Oncol 2003; 13: 357–71
- McGough C, Baldwin C, Frost G, Andreyev HJ. Role of nutritional intervention in patients treated with radiotherapy for pelvic malignancy. Br J Cancer 2004; 90: 2278–87
- Guren MG, Schneede J, Tveit KM, Ueland PM, Nexo E, Dueland S. Biochemical signs of impaired cobalamin status during and after radiotherapy for rectal cancer. Int J Radiat Oncol Biol Phys 2004; 60: 807–13
- Guren MG, Tobiassen LB, Trygg KU, Drevon CA, Dueland S. Dietary intake and nutritional indicators are transiently compromised during radiotherapy for rectal cancer. Eur J Clin Nutr 2006; 60: 113–9
- Fransson P, Tavelin B, Widmark A. Reliability and responsiveness of a prostate cancer questionnaire for radiotherapy-induced side effects. Support Care Cancer 2001; 9: 187–98
- Hovdenak N, Karlsdottir A, Sorbye H, Dahl O. Profiles and time course of acute radiation toxicity symptoms during conformal radiotherapy for cancer of the prostate. Acta Oncol 2003; 42: 741–8
- Hovdenak N, Fajardo LF, Hauer-Jensen M. Acute radiation proctitis: A sequential clinicopathologic study during pelvic radiotherapy. Int J Radiat Oncol Biol Phys 2000; 48: 1111–7
- Lie O, Lambertsen G. Fatty acid composition of glycerophospholipids in seven tissues of cod (Gadus morhua), determined by combined high-performance liquid chromatography and gas chromatography. J Chromatogr 1991; 565: 119–29
- Torstensen BE, Lie O, Froyland L. Lipid metabolism and tissue composition in Atlantic salmon (Salmo salar L.)–effects of capelin oil, palm oil, and oleic acid-enriched sunflower oil as dietary lipid sources. Lipids 2000; 35: 653–64
- Espe M, Kiessling A, Lunestad B-T, Torrisen O, Rora A. Quality of cold smoked salmon collected in one French hypermarket during a period of 1 year. Food Science Technol 2004; 37: 627–38
- Hamre K, Næss T, Espe M, Holm J, Lie O. A formulated diet for Atlantic halibut larvae. Acriculture Nutrition 2001; 7: 123–32
- Ton, H, Brandsnes, Dale, S, Holtlund, J, Skuibina, E, Schjonsby, H, et al. Improved assay for fecal calprotectin. Clin Chim Acta 2000;292:41–54.
- Kristinsson J, Roseth A, Fagerhol MK, Aadland E, Schjonsby H, Bormer OP, et al. Fecal calprotectin concentration in patients with colorectal carcinoma. Dis Colon Rectum 1998; 41: 316–21
- Larsen, A, Bronstein, IB, Dahl, O, Wentzel-Larsen, T, Kristoffersen, EK, Fagerhol, MK. Quantification of S100A12 (EN-RAGE) in blood varies with sampling method, calcium and heparin. Scand J Immunol 2006; (in press).
- Karlsdottir A, Johannessen DC, Muren LP, Wentzel-Larsen T, Dahl O. Acute morbidity related to treatment volume during 3D-conformal radiation therapy for prostate cancer. Radiother Oncol 2004; 71: 43–53
- Peeters ST, Heemsbergen WD, van Putten WL, Slot A, Tabak H, Mens JW, et al. Acute and late complications after radiotherapy for prostate cancer: Results of a multicenter randomized trial comparing 68 Gy to 78 Gy. Int J Radiat Oncol Biol Phys 2005; 61: 1019–34
- Dahl O, Horn A, Mella O. Do acute side-effects during radiotherapy predict tumour response in rectal carcinoma?. Acta Oncol 1994; 33: 409–13
- Jereczek-Fossa BA, Jassem J, Badzio A. Relationship between acute and late normal tissue injury after postoperative radiotherapy in endometrial cancer. Int J Radiat Oncol Biol Phys 2002; 52: 476–82
- O'Brien PC, Franklin CI, Poulsen MG, Joseph DJ, Spry NS, Denham JW. Acute symptoms, not rectally administered sucralfate, predict for late radiation proctitis: Longer term follow-up of a phase III trial–Trans-Tasman Radiation Oncology Group. Int J Radiat Oncol Biol Phys 2002; 54: 442–9
- Schultheiss TE, Lee WR, Hunt MA, Hanlon AL, Peter RS, Hanks GE. Late GI and GU complications in the treatment of prostate cancer. Int J Radiat Oncol Biol Phys 1997; 37: 3–11
- Wang CJ, Leung SW, Chen HC, Sun LM, Fang FM, Huang EY, et al. The correlation of acute toxicity and late rectal injury in radiotherapy for cervical carcinoma: Evidence suggestive of consequential late effect (CQLE). Int J Radiat Oncol Biol Phys 1998; 40: 85–91
- Khan AM, Birk JW, Anderson JC, Georgsson M, Park TL, Smith CJ, et al. A prospective randomized placebo-controlled double-blinded pilot study of misoprostol rectal suppositories in the prevention of acute and chronic radiation proctitis symptoms in prostate cancer patients. Am J Gastroenterol 2000; 95: 1961–6
- Denham JW, Hauer-Jensen M. The radiotherapeutic injury-a complex 'wound'. Radiother Oncol 2002; 63: 129–45
- Prasad KN, Cole WC, Kumar B, Che PK. Pros and cons of antioxidant use during radiation therapy. Cancer Treat Rev 2002; 28: 79–91
- Crawford PA, Gordon JI. Microbial regulation of intestinal radiosensitivity. Proc Natl Acad Sci USA 2005; 102: 13254–9
- Salminen E, Elomaa I, Minkkinen J, Vapaatalo H, Salminen S. Preservation of intestinal integrity during radiotherapy using live Lactobacillus acidophilus cultures. Clin Radiol 1988; 39: 435–7
- Cengiz M, Akbulut S, Atahan IL, Grigsby PW. Acute phase response during radiotherapy. Int J Radiat Oncol Biol Phys 2001; 49: 1093–6
- Larsen A, Hovdenak N, Karlsdottir A, Wentzel-Larsen T, Dahl O, Fagerhol MK. Faecal calprotectin and lactoferrin as markers of acute radiation proctitis: A pilot study of eight stool markers. Scand J Gastroenterol 2004; 39: 1113–8
- Kane SV, Sandborn WJ, Rufo PA, Zholudev A, Boone J, Lyerly D, et al. Fecal lactoferrin is a sensitive and specific marker in identifying intestinal inflammation. Am J Gastroenterol 2003; 98: 1309–14
- Roseth AG. Determination of faecal calprotectin, a novel marker of organic gastrointestinal disorders. Dig Liver Dis 2003; 35: 607–9