Abstract
Purpose. The purpose of this study was to compare late radiation-induced radiological abnormalities of the lung with spirometric observations. Radiological abnormalities were also related to theoretical calculations, in order to predict late effects based on dose-volume histograms. Patients and methods. Sixty-one breast cancer patients who had received postoperative radiotherapy were included. During a follow-up examination 3 years or more after start of radiotherapy, computed tomography (CT) scans and pulmonary function tests were performed. Grading of radiological abnormalities (fibrosis) was performed based on CT images. Based on the dose volume histograms of the lung, effective dose was calculated. Results. There was a positive correlation between the effective radiation dose and the fraction of patients that developed radiation induced fibrosis. No significant association was found between the normalized forced vital capacity (FVC) and the radiological abnormality score or the effective radiation dose. Conclusion. In this study we found no correlation between local radiation-induced changes in the lung tissue and overall lung function. The effective dose was a better predictive factor for radiation induced fibrosis than for overall lung function.
Radiation-induced pulmonary complications are commonly seen following irradiation of the breast, and may limit the dose that can safely be given to the target volume. Keeping the dose to the lung as low as possible is thus essential to avoid unacceptable late adverse effects. The probability of developing late pulmonary adverse effects does not, however, solely depend on the dose, but also on the irradiated lung volume.
Observations and modelling of lung complications following thoracic irradiation have mainly focused on radiation-induced pneumonitis (RP) and pulmonary fibrosis, assessed by pulmonary function tests (PFT) and radiological examinations (x-ray, CT, SPECT) Citation[1–7]. In several studies of radiation-induced radiological pulmonary abnormalities, evaluation of the severity has been based on standard chest radiographs or CT images Citation[4], Citation[8–11], with radiological grading according to, or adapted from, different classification systems Citation[12–15].
The probability of late adverse pulmonary effects can be calculated from dose-volume-histograms using appropriate bio-mathematical models and parameters, and is thus predictable for a population of patients. Normal tissue complication probability can be modelled in several ways, for example by phenomenological models with a limited number of parameters, or by more biologically founded models with several parameters. One frequently used phenomenological model is the Lyman-Kutcher-Burman (LKB) model Citation[16], Citation[17].
The purpose of this study was to: 1) assess the frequency of late radiation-induced radiological abnormalities of the lung, 2) compare these findings with spirometric observations, and 3) to relate the radiological abnormalities to theoretical calculations, in order to predict late effects based on dose-volume histograms.
Patient and methods
Patients
The 61 patients included in this analysis were among 318 stage II/III breast cancer patients included in a follow-up study at The Norwegian Radium Hospital in 2004–2006. The study was approved by the ethics committee. The 61 patients selected had received computed tomography (CT) based postoperative radiotherapy in 2000–2002. The follow-up examinations, including CT-scans (61 patients) and spirometry (59 patients), which were performed in 2004 and 2005, 35–51 months (median 40 months) after start of radiotherapy. The median age of these patients was 54 years (range 39–70) at the time of the follow-up examination. They were originally selected to be a part of a substudy on late density changes in lung tissue, where only patients with a follow-up time of 3 years or more were included. In addition, they had to have accessible preRT and postRT CT-scans, and dose planning data. Some patients were excluded due to technical issues. None of the patients had other (relevant thoracic) malignant diagnoses.
Surgical treatment consisted of mastectomy/lumpectomy and axillary lymph dissection. Radiotherapy was given in 25 fractions of 2 Gy, using a beam arrangement consisting of four half-beams (mainly 6 MV). The target volume included the breast (after lumpectomy), the chest wall and the ipsilateral axilla, fossa supraclavicularis and the lymph nodes along the ipsilateral arteria mammaria interna. Two tangential beams were covering the caudal part of the target volume, and one 0° field and one oblique field were covering the cranial part. For 14 of the patients, an additional electron boost of 10 Gy (9 or 12 MeV, circular field of 5–9 cm in diameter) was given to the tumour bed. The boost treatment of these patients was not subjected to simulation or treatment planning; reconstruction of the boost dose distribution to the lung tissue was thus not feasible for this retrospective analysis. Dose calculation of the photon beams was performed using the TMS (Helax, version 6.0 or higher) treatment planning system, employing a pencil beam algorithm and density correction.
Patients with primarily inoperable breast cancer received induction chemotherapy (epirubicin and/or paclitaxel). Post-operative adjuvant chemotherapy (CMF or FEC) and tamoxifen were administered according to the patient's age at presentation and the tumour's hormone receptor status. Most of the patients were given both cytostatics and tamoxifen.
Complications
The SOMA/LENT scoring system Citation[14], Citation[15] was used for assessment of late pulmonary fibrosis from post-RT CT images. The score ranges from 0 to 3 and reflects the radiographic density as follows: no enhanced radiographic density (Grade 0), slight enhanced radiographic density (Grade 1), patchy (Grade 2), or dense (Grade 3) radiographic appearances. For each patient the score was based on the most severe abnormalities observed. The SOMA/LENT scoring system includes symptomatic criteria, however only the density related criteria were used in this study.
Lung function assessment was based on spirometric measurement, performed at follow-up. No pre-treatment spirometry data were available for this group of patients. The post-treatment measurements were therefore normalised to mean values (percent of expected value) of healthy persons. Forced vital capacity (FVC) below 100% of mean normal values may indicate a reduced lung function, and a FVC below 80% of is regarded as moderate restrictive lung disease Citation[18].
Dose and DVH reduction
Dose-volume statistics of the lung-pairs were achieved by adding dose-volume histograms for the two individual lungs. The differential DVH was then reduced to the normalised effective dose Deff, corresponding to the dose to the whole organ giving rise to the same biological effect as the original dose distribution. Deff for each individual patient was calculated according to Equation 1:1 where di′ is the physical dose di corrected for fraction size using the linear quadratic model with an α/β ratio of 3.0 Citation[19], vi is the volume fraction and n is the volume parameter.
The value of n is usually regarded as related to the organ's architecture, (degree of serial/parallel organization of functional subunits). For the lung, the value of n was set to 0.87 for radiation pneumonitis by Burman et al. Citation[20]. Moiseenko et al. Citation[4] used the same value when calculating the Veff (Deff) for pulmonary fibrosis, but also presented a value of n=0.5 (±0.41) for this endpoint. For some dose distributions, the Deff will strongly depend on the value of n, which therefore should be chosen carefully. The Deff will be equal to the mean dose for n = 1, while for a small value of n, it will approach the organ's maximum dose Citation[21]. Based on the published data from Moiseenko et al. Citation[4], n=0.5 and n=0.87 were chosen for our calculations.
NTCP calculation
The patients were divided into subgroups of 10 (11 or 9), based on their Deff. Each subgroup covered a different dose range, represented by the median Deff for the group members. For each group, the NTCP was calculated, based on the median Deff, according to the Lyman-Kutcher-Burman (LKB) model Citation[16], Citation[17]:2 The parameter m, describing the steepness of the dose-response curve, and the tolerance dose resulting in a 50% complication probability, TD50, were fit simultaneously using a built-in routine in IDL (Interactive Data Language 6.2, Research Systems Inc., Boulder, CO, USA). Different combinations of m and TD50 were compared, using the root-mean-square error, erms, as a goodness of fit. The erms was calculated according to Equation 3:
3
Results
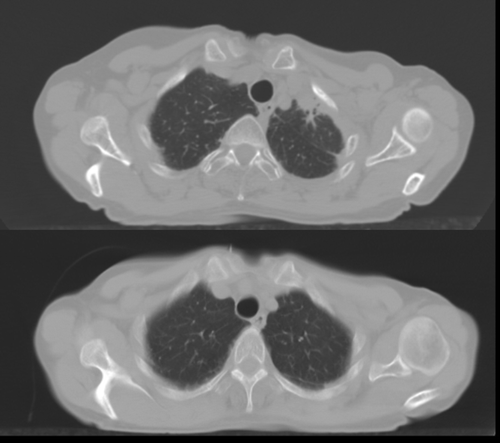
Assessment of radiation-induced radiological pulmonary abnormalities of the 61 patients resulted in 14 presenting with Grade 0, 25 Grade 1, 21 Grade 2, and 1 Grade 3. Hence, 36% of the patients had a score above 1, and 77% had a score above 0. shows an example of a follow-up CT image of a patient with a high fibrosis score compared to pre-treatment.
Figure 1. Follow-up (upper) and pre-irradiation (lower) CT images for patient with dense (Grade 3) radiographic appearances.

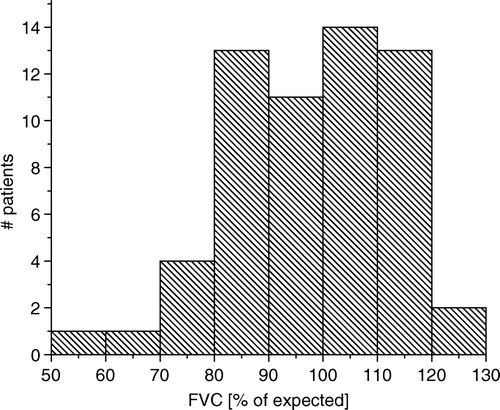
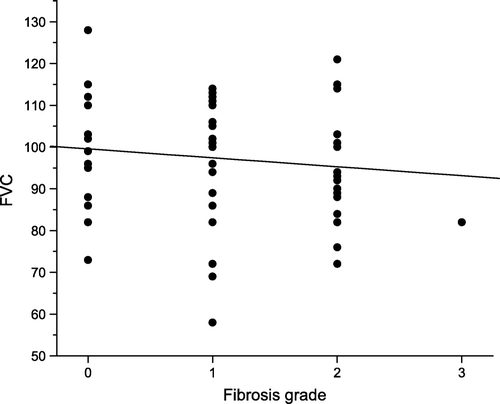
The Forced Vital Capacity (FVC) was below 100%, indicating possible reduced lung function, in 51% of the patients, and below 80%, indicating moderate restrictive lung disease, in 10% of the patients. The FVC values were normally distributed, as illustrated in , and the median value was 99%. Only a weak, non-significant, association between normalized FVC and radiological abnormality score was found, as demonstrated in (linear correlation coefficient, r, of −0.12). Also, an analysis of the relationship between the effective dose, Deff, and the normalised FVC revealed no significant correlation (r = 0.11, for n=0.5).
Shortness of breath or other lung symptoms was reported by ten of the patients. However, reported symptoms were not related to lung function or fibrosis score. There was a weak correlation between patient age and fibrosis score (r = 0.3), and between years of smoking and FVC (r = − 0.3), and furthermore, a weak correlation (r = 0.2) of score and time (months) since irradiation was observed (no correction for multiple testing was made). Whether or not the patients received an electron boost did not seem to affect the fibrosis score. The mean fibrosis score for those with and without boost was 1.2 and 1.1, respectively. The mean MLD (mean lung dose) was 10.4 Gy, and mean lung volume receiving at least 20 Gy (V20) was 20.6%. Linear correlations between the dose metrics (MLD, V20 and V30) and the degrees of fibrosis or the FVC were also very low (∼0.1).
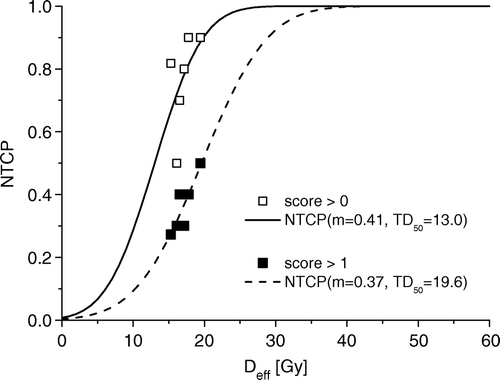
The patients were divided into six groups of 10–11 patients each, according to their effective dose, Deff. The median Deff (n=0.5) for the six groups varied between 15.3 Gy and 19.4 Gy. An analysis of the relation between effective dose on one hand, and radiological score and lung capacity, on the other hand, revealed a positive correlation between Deff and score above 0 or 1 (r = 0.87 for score >1, r = 0.56 for score >0), and a negative correlation between Deff and FVC (r = − 0.30 for FVC <80%, r = − 0.64 for FVC <100%). A negative correlation between Deff and FVC is expected if an increase in effective dose were to lead to a reduced lung capacity.
The effective dose, Deff, among the 61 patients ranged from 9.7 Gy to 20.1 Gy, using an n-value of 0.5 Citation[4] in the dose reduction calculations, and between 5.2 Gy and 12.8 Gy when employing an n-value of 0.87 Citation[20]. Corresponding values of calculated NTCP, based on the parameters of Moiseenko et al. Citation[4] (m=0.34, TD50=28.8 Gy) ranged between 2.6% and 18.8%, and between 0.8% and 5.1%, for n=0.5 and 0.87, respectively. The root-mean-square error, erms, was calculated to quantify to what extent the calculated NTCP could predict the actual observations (). Generally the erms values were high, indicating a significant deviation between calculated probabilities for late adverse effects and actual observations. However, erms values were lower for n=0.5 than for n=0.87, for all end-points, indicating a better correspondence between calculated NTCP (with m=0.34 and TD50=28.8 Gy Citation[4]) and observed adverse effects for the lower volume parameter. An n-value of 0.5 is associated with a more serial like functional tissue architecture than an n-value of 0.87 and thus a lesser volume effect. The best correlation between actual observations and calculated NTCP were seen for FVC <80% and n=0.5, with an erms of 0.068. Presumably, a better correspondence between calculated NTCP and actual observations can be achieved by optimizing the parameter values with respect to the lowest obtainable erms. In optimised values of m and TD50 are shown, for a fixed value of n (n=0.5). The optimisation resulted in lower erms values for the radiological score >0 and score > 1, and thus a better prediction of the actual observation. Corresponding NTCP curves and actual observations are shown in . It turned out that the parameter fitting for the FVC data was highly sensitive to the initial parameter estimates, and also resulted in a non-clinically relevant order of magnitude.
Figure 4. Observed data (fraction of patients) and corresponding best fit () NTCP for a fibrosis score above 0 and above 1.

Table I. erms for the response data (fraction of patients) vs. NTCP calculated using the m=0.34 and TD50=28.8 Gy Citation[4].
Table II. Parameters with 95% confidence intervals and corresponding erms for the response data (fraction of patients) vs. calculated NTCP for n=0.5.
Discussion
Numerous tools for assessing radiation induced adverse effects of the lung, associated with thoracic irradiation, have been reported in the literature. Some of these tools describe local lung abnormalities, whereas others assess overall lung function. Spirometry is appropriate for the assessment of overall lung function, whereas image-based tools may provide more detailed information about local changes, like lung fibrosis. Also questionnaires may be used to assess subjective perceived lung function. In this study FVC was measured to provide information about the overall lung function, whereas the radiological score provide information about local lung abnormalities like radiation-induced fibrosis. In this study we found no correlation between FVC and radiological score. Other groups have seen correlation between functional and radiological radiation-induced damage. Oii et al. Citation[22] observed a significant decline in lung function with increased lung injury score in high resolution CT images for 30 BC patients. Lind et al. Citation[23] reported a significant different decrease in vital capacity between patients with low and high scores of CT-changes (modified Arriagada classification) 4 months after completion of treatment for 105 breast cancer (BC) patients. However, only a non-significant difference was found after 5 months for 167 BC patients using Arriagada classification on chest radiographs Citation[10].
Our results show a lack of correlation between local radiation-induced changes in the lung tissue and overall lung function. This is, however, not surprising, as it is not solely the development of local lung abnormalities that has an impact on the overall lung function; e.g. compensatory process following local lung damage may have a substantial impact on both subjective perceived and objective overall lung function. Furthermore, co-morbidity in patients plays a significant role. Also other studies have found that most patients with radiation fibrosis are asymptomatic Citation[24]. However, there might also be methodological explanations for this lack of correlation. For each patient the score was based on the most severe abnormality observed in the CT images. It might have been more appropriate to apply a weighted score, if the goal is that local lung damage is to reflect overall lung function. Our analysis revealed a significant positive correlation between effective dose and the fraction of patients that developed radiation induced fibrosis; however, such a correlation was not apparent between effective lung dose and overall lung function. This is consistent with the lack of correlation between overall lung function and radiological score. High doses to limited regions of the lung are expected to result in local radiation-induced abnormalities. If one regards the functional tissue architecture of the lung as mainly a parallel structure, reduced overall lung function requires larger volumes to be irradiated to a significant dose level. After all, the irradiated lung volumes in these patients are limited, explaining the lack of correlation between effective lung dose and overall lung function.
The calculated effective dose depends on the volume parameter n, and so will TD50. In addition, the choice of n is crucial when grouping the patients, because the ranking of their effective doses will vary. In our optimisation, no value of n seemed to stand out from others. As a result n=0.5 was chosen in the further analysis. The lung is regarded as an organ with a high degree of parallel structure, and the volume parameter n is thus believed to be relatively high. An appropriate question regarding our results is whether the chosen endpoint definitions are related to a parallel structure or not. The local development of fibrosis, and the classification made in this analysis, is probably more dependent on local high doses than the effective dose for the total lung volume. This indicates that a relatively low value of n might be more correct. In contrast, FVC is assumed to reflect the overall lung function, and therefore a higher n, related to a parallel structure, is more probable for this endpoint.
Spirometry represents an objective description of the severity of the damage to the pulmonary function. It should be noted that the preRT values were not measured, and hence the individual follow-up values and the derived normalised data may not represent the true condition of these patients. Moreover, alternative methods like the carbon monoxide diffusing capacity, DLCO, could be a better indication of lung function Citation[25] in these patients. Also the radiological scoring of fibrosis is hampered with uncertainties as the scoring is subjective.
The NTCP model was fitted to the observations by minimising the erms value as the optimisation criteria. As mentioned above, n was kept constant and equal to 0.5. The m-value (m=0.37) found for a fibrosis score above 1 is close to what Moiseenko observed (m=0.34), while the value of TD50 (19.6 Gy) is somewhat lower than the 28.8 Gy reported by Moiseenko Citation[4]. The low TD50 is a result of the relatively low effective dose for these patients. Generally, the curve-fitting fails to give a clear description of the FVC-based endpoints.
A dose-volume histogram provides a simple description of the dose distribution. Development of fibrosis will be closely related dose-volume effects, but also neighbouring volumes may play a role in the development or recovery of damage through the capability of repair, new-growth, recruitment, or compensation of lung tissue Citation[24]. Analyses based on dose-volume histograms can not deal with these issues, as the regional variations are lost. After DVH-reduction, even more of the detailed information is lost. There is very little variation in Deff for these patients, due to only minor variations in treatment and beam set-up. A limited interval for the effective dose may not be optimal for parameter optimisation in the LKB NTCP model.
In conclusion, the effective dose was a better predictive factor for radiation induced fibrosis than for overall lung function. The other studied treatment-related and patient-related factors showed no strong correlation to the assessed late effects. No correlation was observed between local radiation-induced changes in the lung tissue and overall lung function.
Acknowledgements
This work has been supported by the Research Council of Norway.
References
- Boersma LJ, Damen EM, de Boer RW, Muller SH, Roos CM, Valdes Olmos RA, et al. Dose-effect relations for local functional and structural changes of the lung after irradiation for malignant lymphoma. Radiother Oncol 1994; 32: 201–9
- De Jaeger K, Seppenwoolde Y, Boersma LJ, Muller SH, Baas P, Belderbos JS, et al. Pulmonary function following high-dose radiotherapy of non-small-cell lung cancer. Int J Radiat Oncol Biol Phys 2003; 55: 1331–40
- Marks LB, Fan M, Clough R, Munley M, Bentel G, Coleman RE, et al. Radiation-induced pulmonary injury: symptomatic versus subclinical endpoints. Int J Radiat Biol 2000; 76: 469–75
- Moiseenko V, Craig T, Bezjak A, Van Dyk J. Dose-volume analysis of lung complications in the radiation treatment of malignant thymoma: A retrospective review. Radiother Oncol 2003; 67: 265–74
- Svane G, Rotstein S, Lax I. Influence of radiation therapy on lung tissue in breast cancer patients – CT-assessed density changes 4 years after completion of radiotherapy. Acta Oncol 1995; 34: 845–9
- Theuws JCM, Seppenwoolde Y, Kwa SL, Boersma LJ, Damen EMF, Baas P, et al. Changes in local pulmonary injury up to 48 months after irradiation for lymphoma and breast cancer. Int J Radiat Oncol Biol Phys 2000; 47: 1201–8
- Wennberg B, Gagliardi G, Sundbom L, Svane G, Lind P. Early response of lung in breast cancer irradiation: Radiologic density changes measured by CT and symptomatic radiation pneumonitis. Int J Radiat Oncol Biol Phys 2002; 52: 1196–206
- Geara FB, Komaki R, Tucker SL, Travis EL, Cox JD. Factors influencing the development of lung fibrosis after chemoradiation for small cell carcinoma of the lung: Evidence for inherent interindividual variation. Int J Radiat Oncol Biol Phys 1998; 41: 279–86
- Järvenpää R, Holli K, Pitkänen M, Hyödynmaa S, Rajala J, Lahtela SL, et al. Radiological pulmonary findings after breast cancer irradiation: A prospective study. Acta Oncol 2006; 45: 16–22
- Lind PA, Bylund H, Wennberg B, Svensson C, Svane G. Abnormalities on chest radiographs following radiation therapy for breast cancer. Eur Radiol 2000; 10: 484–9
- Rosen II, Fischer TA, Antolak JA, Starkschall G, Travis EL, Tucker SL, et al. Correlation between lung fibrosis and radiation therapy dose after concurrent radiation therapy and chemotherapy for limited small cell lung cancer. Radiology 2001; 221: 614–22
- Arriagada R, de Guevara JC, Mouriesse H, Hanzen C, Couanet D, Ruffie P, et al. Limited small cell lung cancer treated by combined radiotherapy and chemotherapy: Evaluation of a grading system of lung fibrosis. Radiother Oncol 1989; 14: 1–8
- Cox JD, Stetz J, Pajak TF. Toxicity Criteria of the Radiation-Therapy Oncology Group (Rtog) and the European-Organization-For-Research-And-Treatment-Of-Cancer (Eortc). Int J Radiat Oncol Biol Phys 1995; 31: 1341–6
- Pavy JJ, Denekamp J, Letschert J, Littbrand B, Mornex F, Bernier J, et al. EORTC Late Effects Working Group. Late Effects toxicity scoring: The SOMA scale. Int J Radiat Oncol Biol Phys 1995; 31: 1043–7
- Rubin P, Constine LS, Fajardo LF, Phillips TL, Wasserman TH. RTOG Late Effects Working Group. Overview. Late Effects of Normal Tissues (LENT) scoring system. Int J Radiat Oncol Biol Phys 1995; 31: 1041–2
- Kutcher GJ, Burman C. Calculation of complication probability factors for non-uniform normal tissue irradiation: The effective volume method. Int J Radiat Oncol Biol Phys 1989; 16: 1623–30
- Lyman JT. Complication probability as assessed from dose-volume histograms. Radiat Res Suppl 1985; 8: S13–S19
- Mannino DM, Ford ES, Redd SC. Obstructive and restrictive lung disease and functional limitation: Data from the Third National Health and Nutrition Examination. J Intern Med 2003; 254: 540–7
- Lebesque JV, Keus RB. The simultaneous boost technique: The concept of relative normalized total dose. Radiother Oncol 1991; 22: 45–55
- Burman C, Kutcher GJ, Emami B, Goitein M. Fitting of normal tissue tolerance data to an analytic function. Int J Radiat Oncol Biol Phys 1991; 21: 123–35
- Yorke ED. Modeling the effects of inhomogeneous dose distributions in normal tissues. Semin Radiat Oncol 2001; 11: 197–209
- Ooi GC, Kwong DL, Chan KN, Ngan H, Lock DT, Lam WK, et al. Serial HRCT lung changes after 3-field radiation treatment of breast cancer. Clin Radiol 2000; 55: 817–24
- Lind PA, Svane G, Gagliardi G, Svensson C. Abnormalities by pulmonary regions studied with computer tomography following local or local-regional radiotherapy for breast cancer. Int J Radiat Oncol Biol Phys 1999; 43: 489–96
- McDonald S, Rubin P, Phillips TL, Marks LB. Injury to the lung from cancer therapy: Clinical syndromes, measurable endpoints, and potential scoring systems. Int J Radiat Oncol Biol Phys 1995; 31: 1187–203
- Gopal R, Tucker SL, Komaki R, Liao Z, Forster KM, Stevens C, et al. The relationship between local dose and loss of function for irradiated lung. Int J Radiat Oncol Biol Phys 2003; 56: 106–13

