Abstract
Purpose. To monitor the contrast enhancement in spontaneous canine tumors during fractionated radiotherapy by Dynamic Contrast Enhanced Magnetic Resonance Imaging (DCEMRI). Methods and material. Six dogs with tumors in the oral or nasal cavity received fractionated conformal radiotherapy with 54 Gy given in 18 fractions. T1 weighted DCE imaging was performed prior to each treatment fraction. The tumor was manually delineated in the MR images following every imaging session, and the time dependence of the Relative Signal Intensity (RSI) in the tumor was extracted voxel by voxel. RSI images at the time of maximum enhancement were generated, in addition to images of the initial slope of the RSI curves. The dependence of the median RSI and median slope in the tumor on the accumulated radiation dose was investigated, and images obtained at different treatment fraction were compared by correlation analysis. Results. Five of the six tumors regressed during treatment. The dose dependence of the RSI varied between the tumors, with some showing an increase and others a decrease in RSI with dose. This was also the case for the initial slope of the RSI curves. The correlation between images acquired before the first treatment fraction and subsequent fractions was in general low, and decreased significantly with accumulated radiation dose for five of six tumors. Conclusions. Large individual variations in the dose response of tumor contrast enhancement were found. Decreasing image correlation resulted both from tumor regression and intratumoral changes in the RSI distribution during treatment. These findings may have consequences for treatment design in biological image-guided radiotherapy.
With the advent of non-invasive molecular and functional tumor imaging, there has been increasing interest in how to exploit this information for the benefit of individual cancer patients. Molecular and functional imaging may be used both to improve diagnosis and to guide the choice of therapy Citation[1], Citation[2]. Furthermore, the response to therapy may be monitored. Treatment may be adapted based on this response, and candidates for salvage procedures may be identified among the non-responders Citation[2].
In dynamic contrast-enhanced magnetic resonance imaging (DCEMRI), the tissue signal intensity is studied as a function of time after injection of a paramagnetic contrast agent. The time-intensity curves may be analyzed descriptively, providing parameters such as maximum signal enhancement and the initial enhancement rate. The values of these parameters will depend on tumor physiological factors such as perfusion, vascular density, permeability and the composition of the extracellular extravascular space Citation[3]. Intratumoral heterogeneity in these factors may indicate spatial variations in radiosensitivity. Hence, DCEMRI could potentially be used to identify subpopulations of cells that could be responsible for treatment failure Citation[1].
Several studies have investigated the relationship between DCEMRI parameters and tumor physiology and histopathology (see Zahra et al. Citation[3] for a review). In cervical carcinomas, significant positive correlations have been found between the signal enhancement and microvessel density Citation[4] and median oxygen pressure (pO2) Citation[5], Citation[6], while a negative correlation has been found between the signal enhancement and the proportion of readings with pO2<5 mmHg (that is, the hypoxic fraction) Citation[5]. Furthermore, a negative correlation has been found between the initial enhancement rate and the hypoxic fraction Citation[5]. In breast cancers, the signal enhancement has been shown to correlate positively with microvessel density and tumor grade Citation[7], while the initial enhancement rate correlated positively with microvessel density Citation[8].
The role of DCEMRI in predicting the outcome of radiation therapy has also been investigated (see Zahra et al. Citation[3] for a review). Pretreatment signal enhancement and initial enhancement rate have been found to correlate positively with local control for cervical carcinomas Citation[9], Citation[10]. Also, signal enhancement and mean change in enhancement after two weeks of radiotherapy correlated positively with local control and tumor regression Citation[9], Citation[11]. Thus, following pre- or early treatment DCEMRI of cervical carcinomas, a low enhancement could reflect suboptimal vascularization, leading to hypoxia and radioresistance. For other treatment sites, emphasis has often been on post treatment DCEMR imaging. In head and neck cancers, the enhancement post treatment correlated positively with treatment failure, residual tumor cells and tumor recurrence Citation[12–14], while signal enhancement and initial enhancement rate post treatment correlated positively with treatment failure in lung cancer Citation[15].
In biological image-guided dose escalation, images of tumor radiosensitivity are used to guide focal dose escalation within the tumor Citation[16]. Novel methods for dose delivery, together with advances in non-invasive biological imaging are expected to improve the outcome of radiation therapy for individual patients Citation[17]. Treatment response monitoring using non-invasive imaging is important for assessing the clinical value of biological image parameters, and may have an impact on treatment design.
In the present work, we have investigated tumor contrast agent kinetics, as described by the maximum signal enhancement and the initial enhancement rate of the time-intensity curve obtained by DCEMRI, in response to fractionated radiotherapy. The implications of these results for biological image-guided radiotherapy are discussed.
Materials and methods
Patients and treatment
Six dogs with spontaneous head and neck tumors were enrolled in a prospective study investigating tumor response to fractionated radiation therapy. Patient and tumor characteristics are summarized in . All patients received fractionated radiotherapy to a total dose of 54 Gy delivered in 18 fractions. Patients A–E were treated with 3D conformal radiation therapy using 5 MV photons, while patient F was treated with 12 MeV electrons. None of the dogs showed evidence of distant metastases at the time of diagnosis, and treatment was given with a curative intent. Follow-up examinations for local recurrences were conducted at three and six months after the completion of therapy. At the time of euthanasia, either due to tumor relapse or for unrelated reasons, necropsy was performed. The study was approved by the local research committee, and informed consent was obtained from the dogs’ owners.
Table I. Patient and tumor characteristics for the six dogs in the study. Patient age was at the start of treatment. Initial tumor size was estimated from the MR images.
Tumor imaging
DCEMRI was performed prior to start of radiotherapy and before most treatment fractions. The images were acquired on a 1.5 T scanner (Genesis Signa, GE Medical Systems) using a spoiled-gradient recalled T1-weighted sequence with TR = 200 ms, TE = 2.9 ms, and α = 80°. The resulting spatial resolution in the image plane was (0.7×0.7) mm2 for all dogs, while the slice thickness varied from 3 mm to 6 mm. The acquisition interval was 35 s. The contrast agent was Gd-DTPA (Magnevist 469 mg/ml, Schering AG), injected as a bolus dose of 0.4 ml kg−1 body weight. The dogs were under general anesthesia during image acquisition and radiotherapy. Anesthesia was induced with xylazin 0.3 mg kg−1 (Narcoxyl vet 20 mg ml−1, Intervet) and propofol 2 mg kg−1 (Recofol 10 mg ml−1, Leiras Oy) iv and maintained with propofol 8–12 mg kg−1 hour−1 iv.
Image analysis
For each imaging session, the tumor volume was delineated manually in the DCEMR images and the time dependence of the Relative Signal Intensity (RSI) was calculated voxel by voxel. The RSI is defined as:1 where SI(0) and SI(t) are the signal intensities before and at time t after contrast injection, respectively. The initial slope of the RSI was determined by linear regression of the first three points of the time-signal intensity curve. The maximum RSI of the time-intensity curve was also extracted. Consequently, two sets of parametrical images, initial slope and maximum RSI, were created of each tumor and for each treatment fraction. Furthermore, using anatomical landmarks, the images were rigidly coregistered. The estimated accuracy of the image registration was approximately 2 mm on average (data not shown). The region corresponding to the initial tumor volume could thus be identified in subsequent images for each patient. The initial slope and maximum RSI values were calculated voxel by voxel in this region as well. The correlation between the DCEMR parameters at the first treatment fraction and on the subsequent treatment fractions was calculated through the linear Pearson correlation coefficient. All image analysis and calculations were performed in IDL v.6.2 (Research Systems, Inc.). Statistical significance was taken at the 0.05 level.
Results
Coronal post-contrast MR images of the tumor location for the six patients are shown in . shows tumor size, estimated by post contrast MRI, as a function of radiotherapy treatment fraction. Significant tumor regression, ranging from −1.4%±0.5% to −3.6%±0.3% per treatment fraction (p ≤ 0.02) occurred during treatment for five of the six dogs (patients B–F), while a small, significant increase in tumor volume took place in patient A (p = 0.04). Responses to treatment at three months after completion of therapy and survival times are shown in . At follow-up after three months, a substantial decrease in tumor volume had occurred for patients B, C and E, while a modest reduction in tumor volume had taken place in patient D. No reduction in tumor volume had occurred in patient F, which had a benign disease. Four of six dogs were euthanized due to local relapse and/or distant metastasis, with survival times ranging from 1.5 to 14.5 months. Complete regression occurred in one patient (C), and this patient had no tumor regrowth at necropsy 62.5 months after the completion of radiotherapy.
Figure 1. Coronal, post contrast T1 weighted MR images in the central plane of the tumor (arrow) for the six dogs (A–F) included in the study.
Figure 2. The dependence of the tumor volume on the treatment fraction for the six dogs (A–F). First order linear regression lines are shown.
Table II. Response to treatment. ++/(+)/−: substantial/slight/no reduction in tumor volume compared to pretreatment, respectively.
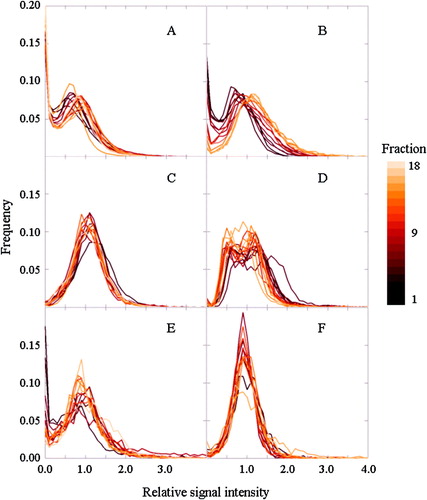
shows the median RSI in the tumor as a function of time for the different treatment fractions. After contrast injection, the RSI is in most cases seen to increase to a plateau level, at RSI values typically between 0.6 and 1.2. This plateau level was generally reached within 4 minutes after the injection of contrast agent. For patients C and F, a noticeable contrast wash-out could be observed after maximum enhancement. RSI was found to increase with increasing radiation dose for patient B, while for patients C and D, RSI decreased with increasing dose. No consistent changes in RSI with dose were observed for patients A, E or F. These findings are also reflected in , which shows histograms of the RSI distribution in the tumors at the time of maximum enhancement for the different treatment fractions. A shift in the histogram towards higher RSI values was observed for patient B, while shifts towards lower values were seen for patients C and D. Similar trends were seen in corresponding histograms of the initial slope of the time intensity curve (data not shown).
Figure 3. The time dependence of the relative signal increase for each of the six dogs (A–F) at different treatment fractions.
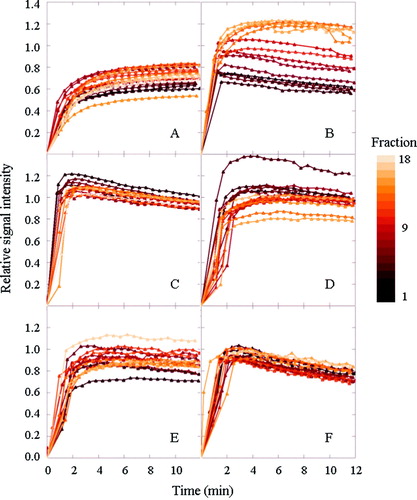
Figure 4. Histograms of the relative signal increase (at maximum enhancement) in the tumor for each of the six dogs (A–F), for each treatment fraction.
shows the maximum RSI and the initial slope of the median time-intensity curve as a function of treatment fraction for each of the patients. First order linear regression lines are also shown. The bars represent the range from the 20th to the 80th percentiles and reflect the heterogeneity in the tumor at any given treatment fraction. Both the maximum RSI and the initial slope increased significantly by 6.3%±0.5% (p < 0.001) and 4%±1% (p = 0.001) per treatment fraction, respectively, during treatment for patient B, while these two parameters decreased significantly by −0.5%±0.2% (p = 0.03) and −1.9%±0.6 (p = 0.004) per treatment fraction, respectively, with dose for patient C. For patient D, maximum RSI decreased significantly by −0.6%±0.2% with dose (p = 0.002). No significant changes in maximum RSI or initial slope were observed for the other patients.
Figure 5. The dependence of the relative signal increase (left ordinate, closed circles, at maximum enhancement) and the initial slope (right ordinate, open triangles) on the treatment fraction for each of the six dogs (A–F).
In , the correlation between parameter images obtained pre treatment and corresponding images during treatment is shown. Decreasing correlations, ranging from −1%±0.5% to −5%±1% per treatment fraction, were seen for both parameters for patients A, B, D, E, and F (p < 0.05). No significant change in correlation was found for patient C, but the correlation coefficient was in general low for this patient. This was also the case for patient F. Correlations between images from one fraction and the next one were in general higher than between the first fraction and subsequent fractions, but correlations remained moderate, with average correlations ranging from 0.2 to 0.4 (data not shown).
Figure 6. The dependence of the correlation coefficient between pre-treatment tumor images and images obtained at given treatment fractions for each of the six dogs (A–F). Closed circles correspond to the relative signal increase (at maximum enhancement), while open triangles correspond to the initial slope.
Discussion
In the present study we have shown that substantial inter- and intratumoral variations in contrast enhancement kinetics did occur during radiation therapy of spontaneous canine nasal and oral tumors. At any given treatment fraction, considerable variations in both maximum enhancement and slope of the enhancement occurred within and between tumors. Furthermore, both increased and decreased overall signal enhancement, as well as no changes in overall enhancement, took place during radiotherapy.
In the present work, the confounding effect of the interaction between a graft and a host on tumor vascularity seen in murine models is avoided. Furthermore, a fractionation scheme comparable to those seen in human radiation oncology was employed, and tumors were of a sufficient size that biological image-guided dose escalation with IMRT would be feasible. However, access to suitable patients was limited, and for ethical reasons, untreated controls could not be included in the study. In addition, tumor size and histology varied considerably among the patients. Thus, the statistical strength of the current study was low, and no comprehensive conclusion can be made on the basis of the current findings. In general, changes in contrast enhancement characteristics may be due to alterations in vascular supply, in capillary permeability, or in cell density Citation[3]. An absence of change in mean contrast enhancement in the tumor () does not imply that local physiological alterations were absent. For instance, radiation induced cell loss (increasing the leakage space, thus increasing the enhancement) and vascular damage (reducing the enhancement) may occur simultaneously. A detailed study of local alterations in contrast enhancement with accumulated radiation dose was not possible in the current work, as tumor shrinkage was observed in most cases (). The image correlation analysis () could potentially have revealed local changes, but includes other contributions as well (see below).
Previous studies investigating radiotherapy related changes in contrast enhancement have also found varying patterns in tumors responding to treatment. Increased tumor enhancement during early therapy has been found to correlate with tumor regression Citation[11] and to be a favorable prognostic factor for local control Citation[9]. However, at the completion of therapy, patients who achieved local control had significantly lower tumor signal enhancement than patients with local failure Citation[13], Citation[15]. It has been suggested that the different correlations between signal enhancement and treatment outcome represent different phases of the tumor physiological response to radiotherapy Citation[13]. Consequently, an increase in signal intensity during early therapy could reflect improved blood and oxygen supply leading to increased tumor cell radiosensitivity Citation[9], while increased signal intensity upon completion of therapy could indicate residual viable areas Citation[13]. In the present study, tumor regression was seen to occur in tumors showing both increasing and decreasing RSI and slope of enhancement during treatment. Furthermore, for patient B, a persistent increase in the maximum RSI and the slope of enhancement was found throughout treatment. However, in the present study, tumors were of diverse histological origins, which may explain some of the intertumoral heterogeneity in radiation response.
In the present study, interfraction heterogeneity in signal enhancement characteristics was quantified using the linear correlation coefficient between parameter images obtained at the first and subsequent treatment fractions. Such voxel-based correlations depend on tumor shrinkage, changes in the contrast enhancement pattern and inaccuracies in the image matching. The correlation coefficient was modestly increased when the images were smoothed by a 2×2 mm median filter (roughly corresponding to the match accuracy) prior to the computation of the coefficient (data not shown). It is interesting to note that for five of six tumors, the correlation coefficient decreased with accumulated dose (), while less consistent changes could be observed for the maximum RSI and the initial slope (). In general, the correlation coefficient between two parameter sets is not dependent on mean parameter levels, and it is thus not dependent on (unintended) interfraction variations in contrast bolus size and duration of injection. Therefore, the correlation coefficient may be more sensitive to intratumoral changes and could, hence, potentially be a useful predictor for treatment response.
Ideally, if biological image-guided dose escalation (“dose painting”) is contemplated based on DCEMR images, the dose modifying effect of the DCEMR parameter used to create the dose prescription map should be known. This would require a voxel- or regionbased correlation of the DCEMR parameter with treatment response for a wide range of doses and would hence not be feasible in clinical practice. However, an empirical approach, in which the signal enhancement pattern is correlated with treatment outcome, could be considered. Hence, dose would be escalated to regions showing an enhancement pattern negatively correlated with response to treatment. However, as this may be dependent on tumor type, the relevant pattern should first be identified for the tumor type in question.
Treatment planning studies on biological image-guided dose escalation have estimated the theoretical improvement in treatment outcome based on a single set of pretreatment images Citation[18–20]. Previously, we have demonstrated the potential benefits of repeated imaging and replanning during biologically adapted treatment Citation[21], even when there is no tumor regression. In the present study, we have shown that substantial inter- and intertumoral variations in signal enhancement patterns occurred during radiotherapy. Furthermore, low and/or decreasing voxel-based correlations between pretreatment images and images acquired at subsequent treatment sessions were found (). Here, both radiation induced changes in contrast enhancement within the tumor volume as well as tumor shrinkage contribute to the observed changes in RSI. Hence, if biological image-guided radiotherapy is to be based on DCEMR images, treatment response should be monitored during therapy and adjustments made to the dose plan so as to maintain the pre-determined treatment objectives.
In biological image-guided dose escalation, treatment monitoring will be particularly important if voxel-based dose prescriptions are employed. In this case, the prescribed dose to each voxel is determined by the voxel intensity in the biological image In contrast, compartmentalized dose prescriptions, where regions comprised by biological voxel intensity intervals are prescribed the same dose, may prove less sensitive to inter-fractional variations in enhancement pattern. The compartmentalized approach is also expected to be less prone to imaging errors, but the biological conformality of the treatment is reduced Citation[22]. Consequently, the need for frequent treatment monitoring and the wish to obtain maximum biological conformality must be balanced against each other.
Acknowledgements
This work was supported by the Norwegian Cancer Society. Magnevist contrast agent was provided by Schering AG, Germany and Recofol anesthetic by Leiras Oy, Finland.
References
- Padhani AR, Husband JE. Dynamic contrast-enhanced MRI studies in oncology with an emphasis on quantification, validation and human studies. Clin Radiol 2001; 56: 607–20
- Weber WA. PET for response assessment in oncology: Radiotherapy and chemotherapy. Br J Radiol 2005; S28: 42–7
- Zahra MA, Hollingsworth KG, Sala E, Lomas DJ, Tan LT. Dynamic contrast-enhanced MRI as a predictor of tumour response to radiotherapy. Lancet Oncol 2007; 8: 63–74
- Hawighorst H, Weikel W, Knapstein PG, Knopp MV, Zuna I, Schonberg SO, et al. Angiogenic activity of cervical carcinoma: Assessment by functional magnetic resonance imaging-based parameters and a histomorphological approach in correlation with disease outcome. Clin Cancer Res 1998; 4: 2305–12
- Cooper RA, Carrington BM, Loncaster JA, Todd SM, Davidson SE, Logue JP, et al. Tumour oxygenation levels correlate with dynamic contrast-enhanced magnetic resonance imaging parameters in carcinoma of the cervix. Radiother Oncol 2000; 57: 53–9
- Loncaster JA, Carrington BM, Sykes JR, Jones AP, Todd SM, Cooper R, et al. Prediction of radiotherapy outcome using dynamic contrast enhanced MRI of carcinoma of the cervix. Int J Radiat Oncol Biol Phys 2002; 54: 759–67
- Esserman L, Hylton N, Yassa L, Barclay J, Frankel S, Sickles E. Utility of magnetic resonance imaging in the management of breast cancer: evidence for improved preoperative staging. J Clin Oncol 1999; 17: 110–9
- Buadu LD, Murakami J, Murayama S, Hashiguchi N, Sakai S, Masuda K, et al. Breast lesions: Correlation of contrast medium enhancement patterns on MR images with histopathologic findings and tumor angiogenesis. Radiology 1996; 200: 639–49
- Mayr NA, Yuh WT, Magnotta VA, Ehrhardt JC, Wheeler JA, Sorosky JI, et al. Tumor perfusion studies using fast magnetic resonance imaging technique in advanced cervical cancer: A new noninvasive predictive assay. Int J Radiat Oncol Biol Phys 1996; 36: 623–33
- Mayr NA, Yuh WT, Arnholt JC, Ehrhardt JC, Sorosky JI, Magnotta VA, et al. Pixel analysis of MR perfusion imaging in predicting radiation therapy outcome in cervical cancer. J Magn Reson Imaging 2000; 12: 1027–33
- Gong QY, Brunt JN, Romaniuk CS, Oakley JP, Tan LT, Roberts N, et al. Contrast enhanced dynamic MRI of cervical carcinoma during radiotherapy: Early prediction of tumour regression rate. Br J Radiol 1999; 72: 1177–84
- Tomura N, Omachi K, Sakuma I, Takahashi S, Izumi J, Watanabe O, et al. Dynamic contrast-enhanced magnetic resonance imaging in radiotherapeutic efficacy in the head and neck tumors. Am J Otolaryngol 2005; 26: 163–7
- Hoskin PJ, Saunders MI, Goodchild K, Powell ME, Taylor NJ, Baddeley H. Dynamic contrast enhanced magnetic resonance scanning as a predictor of response to accelerated radiotherapy for advanced head and neck cancer. Br J Radiol 1999; 72: 1093–8
- Semiz OA, Ayanoglu E, Kodalli N, Oysu C, Uneri C, Erzen C. Dynamic contrast-enhanced MRI in the differentiation of posttreatment fibrosis from recurrent carcinoma of the head and neck. Clin Imaging 2005; 29: 307–12
- Ohno Y, Nogami M, Higashino T, Takenaka D, Matsumoto S, Hatabu H, et al. Prognostic value of dynamic MR imaging for non-small-cell lung cancer patients after chemoradiotherapy. J Magn Reson Imaging 2005; 21: 775–83
- Ling CC, Humm J, Larson S, Amols H, Fuks Z, Leibel S, et al. Towards multidimensional radiotherapy (MD-CRT): Biological imaging and biological conformality. Int J Radiat Oncol Biol Phys 2001; 47: 551–60
- Bentzen SM. Theragnostic imaging for radiation oncology: Dose-painting by numbers. Lancet Oncol 2005; 6: 112–7
- Vanderstraeten B, Duthoy W, Gersem WD, Neve WD, Thierens H. [(18)F]fluoro-deoxy-glucose positron emission tomography ([(18)F]FDG-PET) voxel intensity-based intensity-modulated radiation therapy (IMRT) for head and neck cancer. Radiother Oncol 2006; 79: 249–58
- Thorwarth D, Eschmann SM, Paulsen F, Alber M. Hypoxia dose painting by numbers: A planning study. Int J Radiat Oncol Biol Phys 2007; 68: 291–300
- Lee NY, Mechalakos JG, Nehmeh S, Lin Z, Squire OD, Cai S, et al. Fluorine-18-labeled fluoromisonidazole positron emission and computed tomography-guided intensity-modulated radiotherapy for head and neck cancer: A feasibility study. Int J Radiat Oncol Biol Phys 2008; 70: 2–13
- Sovik A, Malinen E, Skogmo HK, Bentzen SM, Bruland OS, Olsen DR. Radiotherapy adapted to spatial and temporal variability in tumor hypoxia. Int J Radiat Oncol Biol Phys 2007; 68: 1496–504
- Søvik Å, Malinen E, Bruland OS, Bentzen S, Olsen DR. Optimization of tumor control probability in hypoxic tumors by radiation dose redistribution: A modelling study. Phys Med Biol 2007; 52: 499–513