Abstract
Background. During external radiotherapy daily or even weekly image verification of the patient position might be problematic due to the resulting workload. Therefore it has been customary to perform image verification only at the first treatment fraction. In this study it is investigated whether the patient position uncertainty at the initial three treatment fractions is representative for the uncertainty throughout the treatment course. Methods. Seventy seven patients were treated using Elekta Synergy accelerators. The patients were immobilized during treatment by use of a customized VacFix™ bag and a mask of AquaPlast®. Cone beam CT (CBCT) scans were performed at fractions 1, 2, and 3 and at the 10th and 20th treatment fractions. Displacements in patient position, translational and rotational, have been measured by an image registration of the CBCT and the planning CT scan. The displacements data are evaluated retrospectively and the effect of Action Level (AL) image verification protocols based on sessions 1, 2, 3 are simulated. The resulting overall patient position uncertainties of the different protocols are evaluated at the 10th and 20th fractions. Results and conclusions. The differences between the addressed protocols are shown to be very small compared to the overall increase in patient position uncertainty during the treatment course. Thus the main problem in achieving the smallest possible uncertainty for the overall treatment is not the selection of ‘the best’ image verification protocol for the initial three fractions. The main challenge is that the overall patient position uncertainty increases during the treatment course. Information about the patient position during the first three fractions is therefore not representative for the overall patient position. For these types of patients and immobilization equipment it would consequently be an advantage to reduce the number of image verification sessions during the initial fractions and then compensate with additional imaging sessions during the remaining treatment course.
In external radiotherapy advanced radiation techniques, such as Intensity Modulated Radiation Therapy (IMRT) Citation[1] and Volumetric Modulated Arc Therapy (VMAT) Citation[2], have been developed during the last decade to increase the conformability of the high dose region to the Clinical Target Volume (CTV). The increasingly conformal treatments make it possible to reduce the toxicity to the normal tissues. This potentially allows dose escalation and thereby increased tumor control. In the treatment planning the high dose region is shaped to a Planning Target Volume (PTV), which is the CTV expanded by an appropriate PTV-margin accounting for geometrical inaccuracies, e.g. variations in the patient position. Reducing the
would lead to shrinkage of the irradiated volume, which could potentially reduce the toxicity of the treatment. It is therefore of great interest to measure and minimize these geometrical uncertainties in order to obtain the minimal appropriate
. The uncertainties due to patient positioning can possibly be dealt with by Image Guidance Radiation Therapy (IGRT) where the patient position is verified and corrected before treatment by utilization of x-ray imaging. The highest standard of image verification protocols is daily use of IGRT where the patient position is corrected at every single treatment fraction before dose is delivered. However in spite of the developments of advanced image verification techniques such as Electronic Portal Imaging Device (EPID) Citation[3] and Cone Beam Computed Tomography (CB-CT) Citation[4], daily IGRT is still too time consuming to be performed at every treatment centre for all patients. Image verification protocols, e.g. Non Action Level (NAL) Citation[5] protocol and the Shrinking Action Level (SAL) protocol Citation[6], have therefore been developed to ensure correct dose delivery of the more advanced treatments with reduced workload due to image guidance. Nevertheless for many treatment centres even weekly image verification of the patient position might be problematic due to the resulting workload. Therefore it has for some centres been customary to perform image verification only at the first treatment fraction and additionally once or twice during the rest of the treatment course. However it is not certain that the patient position at the initial three treatment fractions represents the overall patient position equally well.
In this study the representativeness of the patient position during the first three treatment fractions is investigated. Two aspects are considered. 1: Examination of whether can be estimated from the patient position during the first three fractions alone or if the margin should be changed during the treatment course. 2: It will be investigated at which of the first three fractions image verification should be done to achieve the optimal patient position during the entire treatment course.
Methods and materials
This study is based on 77 patients treated with curatively intended radiotherapy in the period October 2007 to May 2008. The utilized linear accelerator was an Elekta Synergy accelerator equipped with kV CB-CT. The patients are divided into two subgroups. A Thorax group, which consisted of 30 thorax patients with pulmonary or oesophagus cancers, and an H&N group which consisted of 47 patients with either head and neck cancer or brain cancer. The patients were immobilized during treatment by use of a customized VacFix™ bag and a mask of AquaPlast®. This type of immobilization technique is well known and similar equipment is provided by a number of other companies. All patients were treated in supine position, the thorax cancer patients with arms elevated. For H&N patient the thermoplastic mask covered the ventral part of the head and shoulders. For the thorax cancer patients the mask covered the ventral part of the body from the chin to the umbilicus. IMRT or 3D-conform treatment planning for each patient were performed in Pinnacle3® based on a kV-CT scan (CT) with 3 mm slice thickness. Each patient received between 27 and 33 fractions of radiotherapy.
Data acquisition
In our current daily clinical practice image guided treatments by use of CB-CT are scheduled to be performed at the first three treatment fractions and subsequently at the 10th and 20th treatment fraction. The CB-CT scan in the H&N region is a half rotation 70 kV CB-CT scan with duration of 60 s and 1.1 cGy dosage to the patient, in the thorax region it is a full rotation 120 kV CB-CT scan with duration of 120 s and 2.1 cGy dosage to the patient.
When a CB-CT scan is acquired, image registration with the planning CT is made to determine the displacement of the patient position relative to the planned position. The isocentric marks on the immobilization material are repositioned if the measured displacements are larger than specific action levels (AL) during the treatment course. Information about repositioning of the isocentric marks is automatically stored in a database by in-house developed software along with the measured displacements, fraction number and patient specific information. For each patient it is thereby possible to reconstruct a dataset of displacements
(f is the fraction number during the treatment course of N fraction) as they would have been if no repositioning of the isocentric marks had been made.
The image registration is performed automatically by the software X-ray Volume Imaging (XVI) by use of a gray value fusion algorithm within a diagnosis specific anatomical region of the patient Citation[4], Citation[7]. Each image registration is verified by the treatment staff, and corrected if needed. The described automatic procedures ensure a highly valid dataset of both rotational and translational displacements. Image guidance were made at fractions 1, 2, 3, 10, and 20. At these fractions the patient position is corrected automatically to the optimal position before treatment. The patient position is not corrected at fractions without image guidance. At the time of this study not all patients had yet completed their treatment course, thus IGRT at the first three, 10th, and 20th fractions were done for 77, 69 and 61 patients respectively. A total of 361 CBCT scans are therefore included in this study.
Notation
The displacement is separated into two components; the translational and rotational displacement denoted
and
. The translational displacement
has three components for translations along each of the AP, LR and CC directions, likewise
consists of three components for rotations around the same axes. In general parameters X with subscripts AP, LR and CC refer to the vectorial components of
(or
). When the effect of various image verifications protocols on
for each patient are simulated the related set of residual position errors are denoted
. Superscript P refers to the image verification protocol. An average of a set of displacements will be denoted as
. Based on the notation suggested by van Herk Citation[8], Citation[9] the Standard Deviation (SD) of the systematic and random errors for simulated protocol P based on image registration on consecutive fractions f are denoted
and
, respectively. The effective standard deviation of the patient population at specific fractions f is calculated as
. When a parameter is calculated for a specific fraction or fractions the subscript f will be replaced by the fraction number or e.g
to indicate the first, second and third fractions. Various subscripts and superscripts can be omitted when irrelevant in the given context.
Data analysis
Retrospectively the effect of four different AL protocols and one non-correcting (NC) protocol are simulated. The protocols are applied in order to achieve the optimal patient position at treatment fractions where image guidance is not performed. In the study the focus is on image verification at the initial three treatment fractions to see at which initial fractions image verification should be performed if no further image guidance is made during the rest of the treatment course. Thus in the simulated AL protocols only one correction of the patient position is performed during the treatment course and this correction is based on the displacements .
Pnc
In the NC protocol no corrections of the patient position are made during the treatment course. The set of residual translational position errors, , by which the patient would be treated if no IGRT were made thus equals
.
P1
In the P1 protocol registered translational displacements are corrected by the translational displacement
measured at the first treatment fraction if the length of the displacement
is larger than the action level AL. The residual errors are therefore given by
1
P2 and P3
The P2 and P3 protocols are similar to P1. The difference is that the translational displacements are corrected by
or
, respectively. Thus the residual errors are given by Equation 1 where
is replaced by
or
and f>1 is replaced by f>2 or f>3, in the case of P2 and P3, respectively.
Pm
Pm is a protocol in which is corrected by the mean displacement (
) measured during the first three treatment fractions if
. The residual errors are then given by Equation 1 where
is replaced by
and f>1 is replaced by f>3.
Endpoints
Based on the displacements for all patients in a patient group the group-specific residual systematic setup error
and the group-specific random setup error
can be estimated. It is an implicit assumption that a global distribution for the random errors exist for the patient population of interest. Thus all differences between the registered patient position and their mean position, i.e.
for each patient, are valid measurements of this global distribution.
is calculated as the SD of these differences measured for the all patients in the group of interest.
is the SD of the average positions
calculated for each patient in the group of interest.
After the third treatment fraction no further connected sequences of image guided fractions are performed and thus it is not possible to estimate and
. However the overall patient population inaccuracy
at fraction f, can be measured. The performances of the protocols are evaluated at the 10th and 20th treatment fraction by
and
respectively and are compared to
All parameters and their uncertainties are calculated by use of bootstrapping Citation[10]
Results
As described above serves as a baseline for the results found at 10th and 20th treatment fractions.
Translational results
For simplicity the baseline is only evaluated for AL=0.4 cm, as this corresponds to the action level used in our clinic. Thus the performance of the various protocols at fraction 10 and 20 relative to this baseline are evaluated for AL=0.4 cm in this study. The standard deviation of systematic and random uncertainties for Pm (AL=0.4 cm) and PNC are listed in (a) and (b) for the H&N and Thorax group, respectively. It is noted that the only substantial difference between the two groups are on
and
where statistically significantly higher values are observed for the Thorax group compared to the H&N group.
Table I. The standard deviation of the systematic error for the PNC protocol is denoted , the standard deviation of the residual systematic errors for a Pm (AL=0.4 cm) protocol is denoted
, and
is the standard deviation of the random errors. The effective variation in translational patient positional error for a protocol P is calculated as
. The values are calculated based on
measured in 231 CB-CT scans. All units in cm.
Because of the differences due to different immobilization techniques the H&N and Thorax groups are evaluated separately.
Translational results for H&N
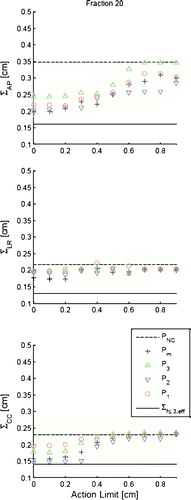
For the H&N group the of the translational displacements
at the 20th fraction with the five different protocols applied are displayed for AP, LR and CC in . The data for the 10th fraction is omitted due to their similarity with the data at the 20th fraction. The effective uncertainties in the patient position (
) found in are indicated by the solid lines as reference. No statistically significant differences are observed between the four AL protocols in any of the three directions at any action level. In the AP and CC direction there is a tendency of increased performance of the protocols when AL is decreased from 0.6 to 0.3 cm. In the AP direction it is beneficial to use an AL protocol compared to PNC, especially for AL <0.6 cm. In the LR direction there is no difference between the AL protocols and the PNC protocol. This is also the case in the CC direction for AL >0.3 cm. At AL=0.4 cm
increases by more than 0.08 cm in all directions compared to
. It should be noticed that this enhancement is substantial compared to the difference between the performance of the individual protocols.
Figure 1. The graphs show simulated for the addressed protocols for AL<1.0 cm in each of the three directions AP, LR and CC for the 20th fraction. The displayed values are based on 38 H&N patients. Error bars are omitted for simplicity, but have sizes of ∼13% for all data points. The solid line indicates baseline values
and the dashed lines indicate the simulated performance of the PNC protocol at the 20th fraction.
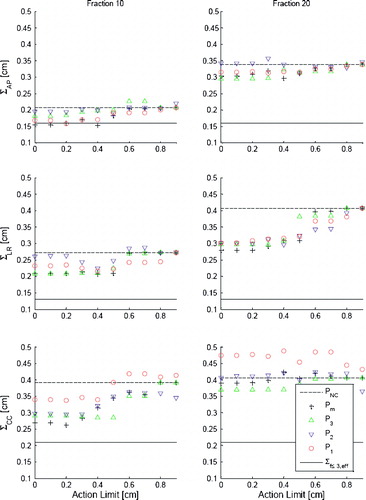
Translational results for Thorax
Data for the Thorax group for at the 10th and 20th fraction are displayed in . No statistical significant difference in the AP and LR direction between the four AL protocols are observed. In the CC direction however there is tendency at the 10th fraction that the P3 protocol performs better than the P1 protocol. The differences can be shown to be statistically significant at the 20th fraction (p<0.05, for AL=0.4 cm) in pair analysis. A similar pair analysis shows statistical significant difference between Pm and P1 for
(p<0.05, for AL=0.4 cm). It is emphasized that the difference in performance between the simulated protocols is negligible compared to the enhancement of
and especially
with respect to the baseline
. At the 20th fraction
is increased by approximately 0.2 cm for all protocols in all directions. Furthermore it is noted that for all action levels above 0.5 cm the PNC protocol performs equally to or better than any of the four AL protocols.
Figure 2. The graphs show (left column) and
(right column) simulated for the addressed protocols for AL<1.0 cm in each of the three directions AP, LR and CC. The simulations data is based on displacements measured for 27 and 23 Thorax patients at the 10th and 20th treatment fraction, respectively. Error bars are not displayed for simplicity, but have sizes of∼18% for all data points. The solid lines indicate baseline values
and dashed lines indicate the simulated performance of the PNC protocol at the 20th fraction.
Rotational results
The results for the rotational displacements are displayed in . As no significant differences are observed between the dataset from the 10th and 20th treatment fraction, only is shown along with
and
which serve as baselines.
indicates the rotational patient position uncertainty if the patient were rotated by
using a HexaPOD™ treatment tabel.
indicates the rotational position accuracy when no corrections are made.
Table II. is the SD of the random rotational error during the first three fractions.
is the effective variation of the rotational errors during the first three fractions when no corrections are made.
are the effective variations of the rotational errors at the 20th fraction simulated for the protocols P of interest which all are simulated with AL=0 deg. For AL=0 deg
equals
. The units of all values are in degrees.
Variation in AL has not shown significant effects on for the simulated AL protocols. Values for
are therefore only tabulated for AL=0 deg.
Rotational results for H&N
The rotational data for the H&N group in a shows no significant differences between the various protocols. The standard deviation of the effective rotational uncertainty is found to be in the order of one degree. Pm tends to perform better compared to the other AL protocols especially for rotation around the CC axis, however this benefit is less than 0.5 deg.
It is emphasized that none of the AL protocols showed to give any statistically significant benefit compared to the NC protocol ().
Rotational results for Thorax
No significant differences between the various protocols are found in the rotational data for the Thorax group displayed in b Similar to the H&N group none of the simulated protocols showed a significant benefit compared to the baseline . The largest effective rotational uncertainty in the order of 1.4 deg is observed for rotation around the CC axis.
Discussion
One of the main purposes of this study has been to investigate the benefit of changing from one of the addressed correction protocols to another. Secondly the aim has been to check whether PTV margins based on patient positioning during the three initial fractions is valid for the overall treatment course. Finally, workload has been of interest since most centres do not perform daily IGRT of all patients, due to lack of resources. The results presented are based on data acquired by use of 3 dimensional (3D) imaging but the study could in principle be made with 2D imaging. However the data would presumably be less accurate, due to interpretation of the projection images, and it would certainly be difficult to achieve a similar rotational data set.
Comparison of correction protocols
Overall the immobilization is working sufficiently well during the first three fractions. All the systematic and random standard deviations for the translations are in the order of 0.1 cm. However, in the longitudinal direction there is a tendency for the random deviation for the Thorax patients to be somewhat larger than the other values. This observation is likely related to the different characteristic of immobilization of patients in the H&N and Thorax groups. In the head and neck region there is a large number of anatomical landmarks which support the immobilization. This is not the case for the thorax region which can roughly be described by a cylinder.
Except for the longitudinal direction for the thorax patients no statistically significant differences could be found between the different protocols. Thus there is no strong argument for imaging at each of the first three treatment fractions, which increases the workload at the accelerators. Since differences between P1, P2 and P3 are only observed in CC direction for the Thorax group this is the only argument for selecting one of the protocols in favor of the others. Statistically significant benefits were found for P3 compared to the P1 protocol. The better performance of the P3 protocol is likely to be caused by the patients to be more relaxed at the third fraction compared to the first fraction.
As seen in and there are indications of improved patient position accuracy as the level of AL decreases. For AL<0.3 cm no increased performance is observed, which is similar to findings for breast cancers made by White et al. Citation[11]. Since manual changes of isocenter marks increase the workload, many centres will prefer an action level protocol compared to a NAL protocol, in which isocenter marks are changed at every image verification session. Likewise, the number of fractions in which a change of isocenter marks is needed for an action level protocol depends on the action level (AL). Keeping the workload in mind there is no argument to choose an action level protocol with a value of AL<0.3 cm.
Development over time
The differences in the performance between the protocols is, as previously described, vanishing compared to the enhancement of the patient position uncertainty during the treatment course. This is seen in and where the overall levels at the 10th and 20th fraction are significantly increased compared to the baseline obtained from the first three fractions (shown as a solid line). Therefore PTV margins which are defined based on the first three fractions will not be adequate for the overall treatment course.
The importance of the overall change in patient position accuracy depends on whether the increase is in the systematic or the random uncertainty. As an example did increase from 0.2 cm (the baseline) to 0.4 cm for the thorax group. Based on the van Herk margin recipes (
, typical a=2.5 and b=0.7) Citation[8], Citation[9] the longitudinal margin based on the first three fractions will be 0.4 cm. If the increase in
is only related to random uncertainties, the CC margin will be increased to 0.6 cm. However if the increase is related to systematic errors the PTV margin will be 1.0 cm. In the current study it is not possible to measure the systematic and the random uncertainty after the third fraction, as no consecutive IGRT fractions have been performed thereafter.
The time dependence of could be related to changes in 1) patient anatomy (weight loss) or 2) the immobilization equipment (changes in structure of the VacFix bag and the mask). Ongoing investigations on relations between weight loss and patient position uncertainty have not found any statistical significant correlations. Regarding the immobilization equipment; the daily stress of the VacFix bag is presumably larger for the thorax patients, as the bag supports the total body weight, compared to the H&N patients for which the bag only supports the head. This might explain the larger increases seen in
for thorax patients compared to H&N patients. These findings could therefore be closely related to the investigated patient groups and to our immobilization equipment and technique. However the principle of the vacuum cushion and thermoplastic mask is widely used and the results could therefore presumably apply to such immobilization equipment in general.
As for the translations no significant differences between the protocols are observed for the rotational data. Also none of the AL protocols perform statistically significantly better than the no correction protocol PNC. Thus there is no benefit in using a HexaPOD™ table, unless regular IGRT is performed throughout the treatment course.
Workload considerations
Since the average protocol Pm performs equally to the P3, workload considerations favors image verification at the third fraction only. However to prevent gross errors due to outliers it is not recommendable to omit image verification at the first fraction, and therefore the P3 protocol will effectively require image verification at the first and the third fractions. Thus only IGRT at the second fraction could be omitted compared to a Pm protocol. If workload is a major concern it could be argued that the disadvantage of P1 compared to P3 is so modest that P1 actually is preferred to P3. Without considering workload issues a choice of P1 in favor of P3 could actually be beneficial if the P1 protocol is combined with more image verification during the treatment course, since the development of the uncertainties during the time of the treatment course is larger than the differences between the individual protocols. Similar results are recently found for prostate cancers on 74 patients Citation[12] and in a somewhat smaller study on 24 patients in the head and neck region Citation[13]. Both of these studies are related to TomoTherapy® Citation[14].
An efficient way to reduce the amount of needed image verification is to improve the quality of the immobilization equipment. The observed differences in the development of the position uncertainties over time for the H&N patients and Thorax patients are likely to be related to differences in the quality of the immobilization of the two groups. Since it is not possible to produce the same immobilization quality for all patients it could be favorable to make diagnose specific image verification protocols e.g. moving of image guided sessions, and thereby workload, from the H&N group to the Thorax group.
Conclusions
Only small differences are seen between the four addressed image verification correction protocols (P1, P2, P3, and Pm). The only statistically significant result is that a protocol based on imaging at the first treatment fraction (P1) is inferior to both a protocol based on imaging at the third fraction (P3) and a protocol based on an average of the results from the three first fractions (Pm).
Compared to the overall increase in patient position inaccuracy the differences between the addressed protocols are shown to be very small. Thus the main problem in achieving the smallest possible uncertainty for the overall treatment is not the selection of ‘the best’ image verification protocol for the initial three fractions. The main challenge is that the overall patient position uncertainty increases during the treatment course. Information about the patient position during the first three fractions is therefore not representative for the overall patient position.
Thus it would be an advantage to reduce the number of image verification sessions during the initial fractions and then compensate with additional imaging sessions during the remaining treatment course. If workload is not a main concern it would certainly be recommendable to combine an action level protocol with regularly image guided session throughout the entire treatment courses. Declaration of interest: The authors report no conflicts of interest. The authors alone are responsible for the content and writing of the paper.
References
- Mohan R, Wang X, Jackson A, Bortfeld T, Boyer AL, Kutcher GJ, et al. The potential and limitations of the inverse radiotherapy technique. Radiother Oncol 1994; 32: 232–48
- Yu CX. Intensity-modulated arc therapy with dynamic multileaf collimation: An alternative to tomotherapy. Phys Med Biol 1995; 40: 1435–49
- Van de Steene J, Van den Heuvel F, Bel A, Verellen D, De Mey J, Noppen M, et al. Electronic portal imaging with on-line correction of setup error in thoracic irradiation: Clinical evaluation. Int J Radiat Oncol Biol Phys 1998; 40: 967–76
- Jaffray DA, Siewerdsen JH, Wong JW, Martinez AA. Flat-panel cone-beam computed tomography for image-guided radiation therapy. Int J Radiat Oncol Biol Phys 2002; 53: 1337–49
- de Boer HC, Heijmen BJ. A protocol for the reduction of systematic patient setup errors with minimal portal imaging workload. Int J Radiat Oncol Biol Phys 2001; 50: 1350–65
- Bel A, van Herk M, Bartelink H, Lebesque JV. A verification procedure to improve patient set-up accuracy using portal images. Radiother Oncol 1993; 29: 253–60
- Oldham M, Létourneau D, Watt L, Hugo G, Yan D, Lockman D, et al. Cone-beam-CT guided radiation therapy: A model for on-line application. Radiother Oncol 2005; 75: 271–8
- van Herk M. Errors and margins in radiotherapy. Semin Radiat Oncol 2004; 14: 52–64
- van Herk M, Remeijer P, Rasch C, Lebesque JV. The probability of correct target dosage: Dose-population histograms for deriving treatment margins in radiotherapy. Int J Radiat Oncol Biol Phys 2000; 47: 1121–35
- Petruccelli JD, Nandram B, Chen M. Applied Statistics for Engineers and Scientists. Prentice Hall; 1999.
- White EA, Cho J, Vallis KA, Sharpe MB, Lee G, Blackburn H, et al. Cone beam computed tomography guidance for setup of patients receiving accelerated partial breast irradiation. Int J Radiat Oncol Biol Phys 2007; 68: 547–54
- Kupelian PA, Lee C, Langen KM, Zeidan OA, Mañon RR, Willoughby TR, et al. Evaluation of image-guidance strategies in the treatment of localized prostate cancer. Int J Radiat Oncol Biol Phys 2008; 70: 1151–7
- Zeidan OA, Langen KM, Meeks SL, Manon RR, Wagner TH, Willoughby TR. Evaluation of image-guidance protocols in the treatment of head and neck cancers. Int J Radiat Oncol Biol Phys 2007; 67: 670–7
- Mackie TR. History of tomotherapy. Phys Med Biol 2006; 51: R427–R453