Abstract
Computer-based artificial intelligence methods for classification and delineation of the gross tumour volume (GTV) on computerised tomography (CT) and magnetic resonance (MR) images do not, at present, provide the accuracy required for radiotherapy applications. This paper describes an image analysis method for classification of distinct regions within the GTV, and other clinically relevant regions, on CT images acquired on eight bladder cancer patients at the radiotherapy planning stage and thereafter at regular intervals during treatment. Statistical and fractal textural features (N=27) were calculated on the bladder, rectum and a control region identified on axial, coronal and sagittal CT images. Unsupervised classification results demonstrate that with a reduced feature set (N=3) the approach offers significant classification accuracy on axial, coronal and sagittal CT image planes and has the potential to be developed further for radiotherapy applications, particularly towards an automatic outlining approach.
In radical radiotherapy planning, delineation of the GTV is primarily based on anatomical assessment of volumetric CT and MR images by a specialist radiation oncologist. This is a complex task that requires considerable clinical experience and expertise. As a result inter- and intra-clinician variability has been observed in the contouring of tumours on CT and MR image data Citation[1–3]. This variability has been shown to be significant and heavily correlated with the digital imaging modality used for examination. Accurate definition of the GTV is essential to limit radiation damage to normal tissue and to utilise the high radiation dose to tumour that techniques such as intensity modulated radiotherapy (IMRT) and image-guided radiotherapy offer.
In this work the potential of using computer-based image analysis methods for identifying the GTV, and organs at risk, on CT images acquired for radiotherapy planning of genitourinary (GU) cancer was investigated. Image analysis methods based on statistical and fractal texture analysis were used for identification of distinct regions on CT. This has the potential, longer-term, to be used as the basis for determining the size and shape of the GTV which, as stated by the International Commission on Radiation Units and Measurements (ICRU), may be different depending on what examination technique is used for evaluation Citation[4].
Texture analysis
To analyze an image using texture analysis the image is treated as a three-dimension (3D) textured surface. This is illustrated in , which shows an intensity surface representation of an axial MR image through the brain. Image texture is defined as a function of the spatial variation of pixel intensities and is not only a useful computational method for classification and segmentation of dissimilar image regions but, crucially for this study, has been proven to perform better than human eyesight at discriminating certain classes of texture Citation[5].
Figure 1. Three-dimensional textured intensity surface representation of a medical image. A: MR image through the brain. B: Pixel values of image plotted on the vertical axis.
Two-dimensional (2D) texture analysis approaches have been used to describe different image textures by unique features and have found application in many disparate fields such as: discrimination of terrain from aerial photographs Citation[6]; in vitro classification of tissue from intravascular ultrasound (IVUS) Citation[7]; identification of prion protein distribution (PrP) on light microscopy images in cases of variant Creutzfeldt-Jakob disease (CJD) Citation[8]; and classification of pulmonary emphysema by differentiating pathology on lung CT images Citation[9–11].
Texture analysis methods have also been used to assess multi-modality images of cancer patients. In a study using the local binary pattern (LBP) operator for texture classification, Kachouie and Fieguth Citation[12] demonstrated that the approach was sensitive to the weak underlying textures present in transrectal ultrasound (TRUS) prostate images. Furthermore, the authors demonstrated that the approach had the necessary discriminative attributes for segmentation of the prostate. In a study of 48 normal images and 58 cancer images of the colon, Esgiar et al., Citation[13] demonstrated that adding a fractal feature to traditional statistical textural features improved classification sensitivity. This is because fractal methods extract information on the self-similarity property of the image under investigation, a property that statistical methods do not explicitly calculate.
Here a 2D texture analysis methodology was developed to calculate textural features independently on the axial, sagittal and coronal CT image information at the radiotherapy isocentre. In this way the approach closely follows the manual approach used by clinicians to define the GTV on CT data. Classification of the bladder, rectum and a clinically relevant region defined as other was investigated using computational methods based on statistical and fractal texture analysis. The statistical methods used were: first-order (FOS), based on analysis of the image histogram; second-order, based on grey-tone spatial dependence matrices (GTSDM); higher-order, based on grey-tone run length matrices (GTRLM); and a fractal method, based on a modified box-counting approach.
Clinical data acquisition
Computerised tomographic images for eight bladder cancer patients (six male and two female), treated with a radiation dose of 52.5 Gy (20 fractions / 4 weeks), were acquired prior to treatment and twice weekly during the course of treatment. The age range of the patients was 63 to 81 years and the mean 74 years. Seven patients were scanned using a 3 mm CT slice thickness and one patient using a 5 mm CT slice thickness (IGE HiSpeed Fx/I, GE Medical Systems, Milwaukee, WI, USA). Pixel size in the image plane was 0.977 mm with a 2048 grey-level range. All repeat CT scans were registered against bony anatomy on the corresponding planning scan using the rigid registration function of the Advantage Fusion software package (version 1.15; GE Medical Systems, Milwaukee, WI, USA).
First-order statistics
The advantage of this approach is its simplicity through the use of standard descriptors (e.g. mean and variance) to characterise image data Citation[14]. However, in certain applications the power of the approach can be limited because the method does not consider the spatial relationship, and correlation, between pixels.
From the histogram containing the occurrence probability P(i) of a particular grey-level i seven features commonly used to describe the properties of the image intensity histogram were calculated and used to describe image texture. These were: mean; variance; coarseness; skewness; kurtosis; energy; and entropy.
Grey-tone spatial dependence matrices
The human visual system is unable to discriminate between texture, or pixel, pairs with matching second-order statistics, an observation that is valid for a large class of textures Citation[5]. Measures to detect second-order differences are based on the probability of finding a pixel that has grey-level i at a distance ds and angle α from a pixel that has grey-level j. Calculating the probability measure over an image forms a GTSDM. Here, four GTSDMs were calculated in the directions, 0°; 45°; 90°; 135° with ds=1. A set of 14 textural features was computed from the GTSDMs Citation[15].
Grey-tone run length matrices
In this higher-order approach, GTRLMs contain information on the run of a particular grey-level combination (i, j) in a direction α. The number of pixels contained within a run is the run-length. Here, four GTRLMs were calculated in the directions 0°,45°,90°,135° on linearly adjacent pixels in the specified directions. A set of five textural features was computed from the GTRLMs Citation[16].
Fractal texture analysis
Fractal geometry provides a succinct and accurate way for describing unordered and complex real-world shapes and surfaces. Prior to the introduction of fractals primitive shape descriptors, such as spheres, cylinders and cubes, were used to describe the morphology of complex scenes Citation[17]. However because these descriptors are smooth they are inadequate for tracing and modelling the 3D surface detail of complex objects. Mandelbrot first used a single non-integer measure to describe structures too complex for description by Euclidean geometry Citation[17]. This measure, the fractal dimension, describes the degree of irregularity of a textured surface. The rougher or more irregular a structure, the greater is its fractal dimension Citation[18], Citation[19].
A bespoke box-counting approach was used to estimate the fractal dimension of the tumour regions investigated by dividing each region of interest (ROI) into smaller elements, each a replica of the original structure Citation[18]. For the bounded set A in Rn the box counting dimension Db is defined as,1
This was implemented by placing A, in the form of CT image data, onto a grid made up of boxes of size r×r. Grid boxes containing pixels within an empirically defined intensity range were counted. The total number of boxes in the grid containing structure was Nr(A). The algorithm continued by altering r to progressively smaller sizes and counting Nr(A). The slope of the line fitted through the plot of log(1/r) against log Nr(A) was the fractal dimension of the tumour region investigated.
Feature calculation algorithm
Regions of interest, defined by selection of the smallest square region that adequately covered the rectum and would fit within the bladder, were identified at unique positions on the axial, coronal and sagittal slices of the planning and repeat CT data. The control region, referred to as other, was chosen to contain multiple pathology. On average eight CT data sets were available for each patient. shows a 3 mm axial CT image through the pelvis on which the ROIs are clearly visible. On each ROI, features (N = 27) were calculated using the FOS, GTSDM, GTRLM and the fractal approach described.
Figure 2. Axial CT image through the pelvis showing: 1. Bladder, 2. Rectum, 3. Other. The image was acquired using a 3mm slice thickness with a pixel size in the image plane of 0.977 mm.
Feature reduction
The principle of feature reduction is to take a set of candidate features and to select a subset of features that retain most of the information needed for pattern classification. In some cases it is possible to derive a set of features that forfeit none of the information needed for classification. Such a subset is referred to as an optimal set and results in no increase in the minimum probability of error when a Bayes’ decision rule is applied in both the observation and subset space.
To reduce the complexity of the 27×3 feature matrix, features with limited classification power were removed using the sequential forward search (SFS) approach Citation[20]. For the original set of candidate features the reduced feature set
was selected by optimising the criterion function J(.), which was chosen to be the minimum probability of error. For
the probability of correct classification ξ with respect to any combination was,
. From this the minimum probability of error for the space spanned by ξ for each class ωi was calculated from,
2
Feature clustering and visualisation
The K-means algorithm belongs to the collection of multi-variate methods used for classifying or clustering data according to some element of similarity. In this work this was represented by the statistical and fractal feature values. The K-means algorithm performs classification without the aid of a training set and without a priori knowledge of the data being examined, thus creating a completely unsupervised approach to the classification problem. The algorithm starts with a partition of the observations, or feature values, into clusters. At each stage the algorithm moves an observation from one cluster to another if the move will increase the overall similarity within clusters. The algorithm ceases when the similarity within clusters can no longer be increased.
Sammon plotting was used to generate a 2D representation of the multi-dimensional feature space and to assess the classification possible from different combinations of textural features. For a set {xi} of n d–dimensional patterns, where dij represents the distance between patterns xi and xj in d–dimensional pattern space, there exists a mapping to a lower dimensional pattern space m, where (m<d), and Dij is the distance between xi and xj in m–dimensional pattern space Citation[21]. The mean-square-error between the two distance measures was used to establish the optimum mapping for m=2. This is defined as,3 where ΣΣ are over the set
Results
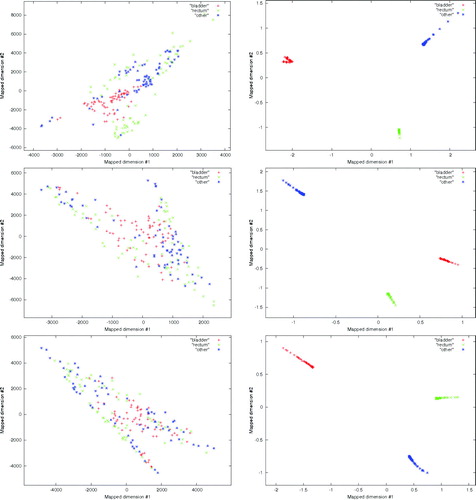
The performance of the technique was investigated under two unsupervised test conditions. In the first all of the available features (N = 27) were used to classify bladder, rectum and other pathology on axial, coronal and sagittal CT image slices at the treatment isocenter. In the second a reduced feature set (N = 3) was used to classify the same data. The classification results achieved using all of the available features are shown in the left hand column of . The classification results achieved using the three most significant features are shown in the right hand column of .
Figure 3. Classification results obtained from image features calculated on the bladder, rectum, and a region of multiple pathology identified as other on axial CT images through the pelvis. Left (top: axial, middle: coronal: bottom: sagittal) plot showing the classification between the three groups using all available image features. Right (top: axial, middle: coronal: bottom: sagittal) plot showing that discrimination of the three groups is possible using the three image features with the most significant discriminatory power.
Discussion
The texture analysis approach presented has been specifically designed to deal with classification of calibrated CT image data, which guarantees the relationship between CT Hounsfield units and electron densities used in radiotherapy planning. No significant discrimination was observed for the classification of the bladder, rectum and other region on the axial, coronal and sagittal images using all of the available features. This is shown in the left hand column of . Significant discrimination between the three groups was achieved using the reduced feature set as shown in the right hand column of . The best three features, all from the GTSDM approach, were: f1, angular second moment (ASM); f3, correlation; and f4 variance. The ASM feature, which is a measure of the grey-level homogeneity, proved effective at identifying pathology from the grey-level transitions characteristic of each region analysed. The linear dependence of image grey-levels was measured by f3. This feature responds to grey-level structure in a given direction.
The fractal method used in this study was selected because of the convenience of using only a single feature to characterise distinct image regions and because of the proven record of the method in medical image analysis problems Citation[13]. However, as reported by Mandelbrot in the characterisation of the surface of the earth by a single dimension, it should be realised that assigning a single dimension to an entire surface may not be appropriate. In this study, because the amount of urine in the bladder and air in the rectum may have influenced the different distributions of grey-levels on the acquired image, more research is required to establish a fractal method that is insensitive to these physical variations.
The approach presented appears to be insensitive to CT slice thickness and resolution and importantly for this work coincident classification of the textural feature data in each orthogonal plane has the necessary sensitivity and specificity for radiotherapy applications. With further investigation this could be extended to MR, however, it is recognised that considerable research effort is required to develop the approach into one that is suitable for fully automatic outlining of the GTV and incorporation into the radiotherapy planning workflow. Work has already begun to determine the classification achievable using smaller ROIs because of the increased segmentation accuracy at the interface between distinct tissue groups that such a reduction offers. More work is required however to find the optimum ROI size for a given data set and to investigate the possibility of using adaptive ROIs, which could be altered in size depending on the tumour, or tissue, properties under investigation.
One particular area in which the work would benefit from further development is in the extension of the methodology to 3D. Despite the majority of texture analysis research studies focusing on 2D methods, some researchers have made algorithmic advancements in this area Citation[10], Citation[22–24]. Xu et al., Citation[10] showed in a study of 34 patients that calculating 24 features on 3D volumes of interest could enhance the ability to differentiate normal lung from subtle pathologies on multi-detector row CT data. They noted that 3D texture analysis was significantly more sensitive and specific than 2D texture analysis in discriminating between small differences in smoking related lung pathology. Jafari-Khouzani et al., Citation[22] compared 2D and 3D wavelet features for discriminating between normal and abnormal hippocampi on MR images. They concluded that features derived from the 2D wavelet transform provide higher separability compared to 3D wavelet features. The small number of 3D texture analysis publications suggest that this is a promising area of research that requires much further investigation, particularly with increased access to multi-slice CT and the widespread availability of image data with near isotropic resolution. Declaration of interest: The authors report no conflicts of interest. The authors alone are responsible for the content and writing of the paper.
References
- Steenbakkers RJHM., Duppen JC, Fitton I, Deurloo KEI., Zijp L, Uitterhoeve ALJ, et al. Observer variation in target volume delineation of lung cancer related to radiation oncologist-computer interaction: A big brother evaluation. Radiother Oncol 2005; 77: 182–90
- Yamamoto M, Nagata Y, Okajima K, Ishigaki T, Murata R, Mizowaki T, et al. Differences in target outline delineation from CT scans of brain tumours using different methods and different observers. Radiother Oncol 1999; 50: 151–6
- Coles CE, Hoole ACF, Harden SV, Burnet NG, Twyman N, Taylor RE, et al. Quantitative assessment of inter-clinician variability of target volume delineation for medulloblastoma: Quality assurance for the SIOP PNET 4 trial protocol. Radiother Oncol 2003; 69: 189–94
- International Commission on Radiation Units and Measurements. ICRU Report 62: Prescribing, Recording and Reporting Photon Beam Therapy (Supplement to ICRU 50). Bethesda, Oxford University Press; 1999.
- Julesz B. Experiments in the visual perception of texture. Sci Am 1975; 232: 34–43
- Conners R, Harlow C. Theoretical comparison of texture algorithms. IEEE Trans Pattern Anal Mach Intell 1980; 12: 204–22
- Nailon WH. Tissue characterisation from intravascular ultrasound using texture analysis [Ph.D. thesis]. The University of Edinburgh; 1997.
- Nailon WH, Ironside JW. Variant Creutzfeldt-Jakob disease: Immunocytochemical studies and image analysis. Microsc Res Tech 2000; 50: 2–9
- Uppaluri R, Mitsa T, Sonka M, Hoffman EA, McLennan G. Quantification of pulmonary emphysema from computed tomography images. Am J Respir Crit Care Med 1997; 156: 248–54
- Xu Y, Sonka M, McLennan G, Junfeng G, Hoffman EA. MDCT-based 3D texture classification of emphysema and early smoking related lung pathologies. IEEE Trans Med Imag 2006; 25: 464–75
- Prasad MN, Sowmya A. Multilevel emphysema diagnosis of HRCT lung images in an incremental framework. SPIE Med Imag 2004; 5370: 42–50
- Kachouie NN, Fieguth P. A medical texture local binary pattern for TRUS prostate segmentation. Proceedings of 29th Annual Int Conf of the IEEE EMBS; 2007 Aug 23–26; Lyon, France.
- Esgiar AN, Naguib RNG, Sharif BS, Bennet MK, Murray A. Fractal analysis in the detection of colonic cancer images. IEEE Trans Inf Technol Biomed 2002; 6: 54–8
- Press W, Flannery B, Teukolsky S, Vetterling W. Numerical recipes in C: The art of scientific computing, Cambridge University Press; 1998.
- Haralick RM, Shanmugan K, Dinstein I. Texture features for image classification. IEEE Trans Pattern Anal Machine Intell 1973; 3: 610–21
- Galloway MM. Texture analysis using grey-level run lengths. Comp Graph Image Proc 1975; 4: 172–9
- Mandlebrot B. Fractals: Form, chance and dimension. New York: W H Freeman & Co; 1977
- Feder J. Fractals. New York: Plenum Press; 1988
- Peitgen H, Jurgen H, Saupe D. Chaos and fractals: New frontiers of science. New York; Springer-Verlag; 1992
- Devijver P, Kittler J. Pattern recognition: A statistical approach. Prentice Hall; 1982.
- Sammon J. A nonlinear mapping for data structure analysis. IEEE Trans Comput 1969; C-18: 401–9
- Jafari-Khouzani K, Soltanian-Zadeh H, Elisevich K, Patel S. Comparison of 2D and 3D wavelet features for TLE laterization. SPIE Med Imag 2004; 5369: 593–601
- Kurani AS, Xu DH, Furst J, Raicu DS. Co-occurrence matrices for volumetric data. Proceedings of 7th IASTED Int. Conf. On Computer Graphics and Imaging; 2004 Aug 16–18; Kauai, Hawaii, USA.
- Kovalev VA, Kruggel F, Gertz H, von Cramon DY. Three-dimensional texture analysis of MRI brain datasets. IEEE Trans Med Imag 2004; 20: 424–33