Abstract
Background and purpose. To improve the outcome in bladder radiotherapy by improving treatment conformation, we have investigated various adaptive treatment strategies involving on-board tumour/target visualisation for the bladder. The strategies are compared in terms of the amount of normal tissue enclosed within the PTV and the percentage volume overlap between the CTVs (i.e. bladders) on planning and repeat CT scans. Materials and methods. Five male bladder cancer patients having a planning and either 7 or 8 repeat scans during treatment were included in this study. Tumour positions were simulated on the sup/inf/ant/post/left/right wall and were identified in the repeat scans based on a reference coordinate system. The reference origin was positioned on an axis joining the centres of mass of the prostate and the bladder at a point mid way between the centre of mass of the bladder and the inferior bladder wall. Tumour positions on the repeat CTVs were overlapped using translation with corresponding positions on the planning CTV, after which the required isotropic and anisotropic margins were determined using a previously published margin calculation algorithm. Calculations were performed to find the margins required to enclose the envelope covering all repeat CTVs and those enclosing the repeat CTVs one by one, i.e. simulating adaptation on daily basis. These results were compared to optimising the margins for all repeat scans, firstly without any positional correction of the CTV and secondly after applying the optimum translation for the whole bladder. Results. Compared with optimisation of all scans, daily adaptation increased the average percentage volume overlap by 20% to 79–82% for the various tumour positions. The volume overlap achieved was similar for no translation of the isocentre (average 79%), and slightly higher with optimal translation (average 85%). Conclusion. Translation of the isocentre according to tumour position did not compromise the normal tissue irradiation compared with no translation of the isocentre. Optimal translation of the isocentre is superior in terms of normal tissue sparing.
A major challenge in radiotherapy (RT) of bladder cancer is the large internal variation in position and shape of the bladder. To ensure target coverage during a treatment course, CTV (i.e. bladder)-to-PTV margins of up to 25 mm have been shown to be required Citation[1]. The large PTV volume implies unnecessary irradiation to healthy tissue and the organs at risk, mainly the rectum and intestine. This risk for complications in these organs limits the prescribed dose and hence the tumour control probability that can be achieved.
During the last year bladder cancer patients referred to Aarhus University Hospital (AUH) have been treated with intensity modulated radiotherapy (IMRT) Citation[2]. IMRT enables high precision dose shaping, including the possibility of delivering different prescribed doses to various parts of the target and the elective volume. This both reduces the irradiation of the surrounding tissues and opens the possibility for dose escalation in the treatment of pelvic tumours Citation[3], Citation[4]. To improve treatment accuracy and ultimately enable tumour dose escalation, an ongoing study at AUH is evaluating the use of fiducial markers for bladder tumours. To further enable a reduction of the treatment margins used, Burridge et al. Citation[5] and Pos et al. Citation[6] have both suggested individual adaptation of the PTV based on multiple imaging of the CTV. In addition, a previous study has shown that correction of the isocentric position based on image guided RT (IGRT) could reduce the volume needed to enclose both planning and repeat CTVs Citation[7].
The aim of this study was to investigate the normal tissue sparing potential for various IGRT strategies involving PTV adaptation by correction of the isocentric position. As in the previous studies, these strategies are methods for adaptation of the PTV to the CTV consisting of the bladder, without including the elective volume. Besides strategies aimed at minimising the volume of normal tissue inside the PTV, we investigated the volumetric effect on normal tissue irradiation when considering a tumour boost guided by fiducial tumour markers. To investigate if the location of the tumour affects the normal tissue irradiation, we simulated six potential tumour positions on the bladder wall for each patient.
Materials and methods
Patient and CT material
Five male bladder cancer patients with average age of 74 years (range age: 63 to 81 years), treated at Edinburgh Cancer Centre (ECC), were included in this study. All patients were scheduled for twice-weekly repeat CT scanning of the pelvis. The slice thicknesses of both the planning and repeat scans were 3 mm, apart from one patient with a slice thickness of 5 mm. All scans were acquired without contrast or any tumour markers. The patients were instructed to void their bladder prior to scanning and treatment. The repeat scans were registered on bony anatomy to the corresponding planning scan using Advantage Fusion software (GE Medical Systems, Milwaukee, WI, USA), effectively isolating the internal bladder motion. Subsequently, the bladder and the prostate were outlined on all scans on all relevant slices. All bladder CTVs were outlined by a physician in training in radiation oncology, while the prostate CTV outlining was done by a physicist and verified by a radiation oncologist. The outlines were stored as DICOM RT structure sets using the same coordinate system as the corresponding planning scan. The patient specific variation in the bladder volumes is given in .
Table I. Bladder volume variation (upper) and the standard deviations for the reference axis (lower). CTV 0 is the bladder for the planning scan, while CTVr is a bladder from a repeat scan. The range is given for the repeat CTVs.
Determination of tumour positions
The planning CT and the related bladder and prostate volumes (planning and repeat scan outlines) were imported into in-house developed planning software Citation[8]. Based on a reference coordinate system we simulated six potential tumour positions (sup/inf/ant/post/right/left) on the bladder wall in all repeat scans. The reference origin was positioned on an axis joining the centres of mass of the prostate and the bladder at a point mid way between the centre of mass of the bladder and the inferior bladder wall, as shown in . To ensure the stability of the system, the standard deviations for the lateral and anterior/posterior angles defining this axis were investigated for all scans and for all patients as shown in . Tumour positions were defined as the most sup/inf/ant/post/right/left points of the bladder on the planning scan. To locate the same points on the repeat scans, the projection angles in the sagittal and transverse planes were used as defined in . By first overlapping the planning and the repeat scans such that the origins coincided, the tumour position in a repeat scan was determined as the point on the repeat CTV outline closest to a line, defined by the sagittal and transverse angles, joining the tumour position and the reference point on the planning scan. Based on the simulated tumour positions, the translations required to overlap the planning and repeat scans at the tumour positions were calculated and applied. The result of a shift to the right tumour position is shown in .
Figure 1. Definition of the reference point. The top and bottom ellipses represents the bladder and the prostate respectively. The axis goes through the centres of mass (CM), marked with x, of the two organs. The reference point, marked with a black circle, is located half-way between the bladder CM and the edge between the bladder and prostate.
Figure 2. Definition of the projection angles. The counter clockwise anterior/posterior-angle (left) is 0° on the (positive) right axis. The clockwise lateral angle (right) is 0° on the (positive) inferior axis.
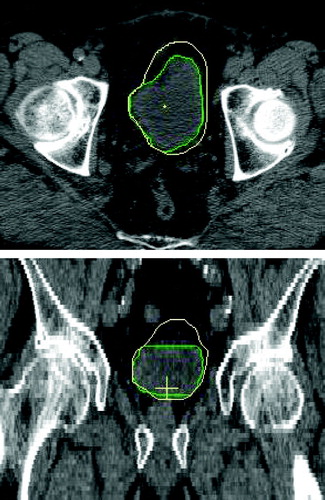
Figure 3. Transverse (upper) and coronal (lower) views of the bladder shape variation for one patient. The green contour is the planning CTV while the yellow contour is a repeat CTV translated to the (patient) right tumour position.
The adaptive strategies
The adaptive strategies investigated in this study involved image guided correction of the CTV position and/or individual determination of the optimum treatment margins. All strategies were purely translational, partly due to the rotational stability of the reference system () and partly since translational correction has been shown to be far more important than rotational correction in the pelvis Citation[9]. Three main strategies for correction of the isocentre were investigated: a) no translation of isocentre – i.e. no correction of the CTV position, b) optimal translation – i.e. translation of the CTV to its optimal position (explanation in next paragraph) and c) translation to a tumour position. The last considers 6 different possible locations and is the most relevant strategy when a tumour boost is considered. Clinically, translational correction of the isocentre is performed by moving the patient, and thus the CTV, in the three possible directions.
The optimal CTV position used in strategy b) was found using a previously developed algorithm Citation[7]. Starting with translation of two CTV structures such that their mid points coincided, the algorithm calculated if any further shifting of the repeat CTV relative to the planning CTV would increase the percentage volume overlap between the planning and the repeat CTV.
Margin calculations
For all three strategies, i.e. a) no translation of isocentre, b) optimal translation and c) translation to a tumour position, margins were calculated for: 1) the PTV enclosing the planning CTV and the envelope enclosing all CTVs from the repeat scans and 2) the PTV enclosing the planning and one repeat CTV at the time, i.e. daily adaptation. Both isotropic and non-isotropic margins were found for each case. This resulted in a total of 128 or 144 sets of margins for each patient, depending on whether they had either 8 or 9 CT scans. The margins for all cases were determined with aid of a previously described algorithm Citation[10]. Briefly, the method found the optimum anisotropic margins using a stochastic iteration process to minimize the volume between the resulting PTV and the repeat CTVs. To find the optimal result the algorithm was run 3 000 times for each case. Isotropic margins were found by a stepwise decrease of an initial margin, that when applied to the planning CTV ensured full coverage of the repeat CTV. For each case the resulting anisotropic and isotropic margins, the volume of normal tissue between the PTV and repeat CTV and the percentage volume overlap of the repeat CTV by the planning CTV were all recorded. For the determination of the PTV enclosing the envelope of the CTVs from all repeat scans, the excess volume was calculated as the difference in volume between the resulting PTV and the average CTV volume for the repeat CT scans.
Results
Percentage volume overlap
Without any isocentre translation, the average percentage volume overlap between the planning CTV and the envelope enclosing all repeat CTVs was 60%, with a range of 47–70%. With optimal translation the volume overlap was increased to 65% (range 49–75%). Adaptation of the PTV to the repeat CTVs one by one, i.e. daily adaptation, increased the average volume overlap to 79% (range 52–96%) for no isocentre translation and 85% (range 55–96%) for optimal translation respectively, as shown in .
Figure 4. Comparison of the percentage volume overlap between no translation of isocentre and optimal translation. The lines represent the ranges, while the square is the mean value for each case. ‘All’ denotes adaptation to the envelope of all repeat CTVs, while ‘daily’ denotes daily adaptation to one repeat CTV at the time.
Depending on position, translation to the 6 tumour positions resulted in an average volume overlap between 60–62% for the planning CTV with the envelope of all repeat CTVs. Ranges and mean values for the percentage volume overlap for all tumour positions are shown in . Minimum and maximum values varied from 43–48% and 68–74%, respectively. The lowest average and minimum volume overlaps were found for translation to the superior position, while translation to the posterior position resulted in the highest average and maximum values. When considering daily adaptation to the six tumour positions the average volume overlap increased to 79–82%. As for the envelope enclosing all repeat CTVs, the superior position resulted in the lowest minimum (42%), but this time also in the highest maximum (96%).
Figure 5. Comparison of the percentage volume overlap between no translation of isocentre and translation to tumour positions; upper: sup/inf, middle: right/left and lower: ant/post. The lines represent the ranges, while the square is the mean value for each case. ‘All’ denotes adaptation to the envelope of all repeat CTVs, while 'daily’ denotes daily adaptation to one repeat CTV.
Isotropic margins
The average isotropic margin required to cover the planning and all repeat CTVs was 20 mm for no isocentre translation and 14 mm for optimal translation, respectively (). These two isotropic margins lead to average volumes of normal tissue within the PTV of 486 cc and 280 cc (ranges 234–922 cc and 157–561 cc respectively). With daily adaptation the required average isotropic margin reduced to 13 mm and 9 mm, respectively, with corresponding average normal tissue volume within the PTV of 252 cc (range 74–867 cc) and 169 cc (range 58–508 cc) respectively.
Table II. Average isotropic PTV margins and average and range of volume of normal tissue (NT vol.) enclosed within the PTV following isotropic margin optimisation for left: the envelope of all repeat CTVs and right: one repeat CTV at the time. Averages in the left column are calculated per patient (a total of 5 values), while averages in the right column are calculated over the corresponding values for each repeat scan (a total of 39).
The required average isotropic margin to enclose all scans when translating to the tumour positions depended on position and varied between 16–18 mm, which resulted in 358–418 cc of normal tissue enclosed by the PTV on average. Daily adaptation resulted on average in isotropic margins of 11–12 mm and in 199–242 cc excess volume of normal tissue as shown in .
Anisotropic margins
Anisotropic margin optimisation including all repeat CTVs resulted on average in 208 cc (range 119–416cc) and 176 cc (range 112–311 cc) of normal tissue inside the PTV for no isocentre translation and optimal translation, respectively. After daily adaptation the average excess volumes of normal tissue decreased to 107 cc (range 54–245cc) and 95 cc (range 43–227 cc) respectively as shown in (upper).
Table III. Average and range of the volume of normal tissue (NT vol.) enclosed within the PTV following anisotropic margin optimisation for left: the envelope of all repeat CTVs and right: one repeat CTV at the time. Averages in the left column are calculated per patient (a total of 5 values), while averages in the right column are calculated over the corresponding values for each repeat scan (a total of 39).
For the translation to the tumour positions the anisotropic margins enclosing all scans resulted on average in volumes of 190–227 cc normal tissue inside the PTV depending on the position. Adaptation on a daily basis decreased this volume to 100–114 cc as shown in (lower).
Discussion
In this study we have quantified the differences in normal tissue irradiation resulting from various adaptive image-guided strategies in bladder RT. The strategy of optimal translation was superior, both regarding the percentage volume overlap between the planning and repeat CTV as well as the excess volumes resulting from adaptation to all repeat CTV positions. This applied to both the optimisation of the envelope of all repeat CTVs and daily for one CTV at the time. With adaptation on the envelope enclosing all repeat CTVs, the volume overlap between no translation of the isocentre and translation to a tumour position (in ) is similar. Adaptation to the individual CTVs shows an increase of approximately 20% for all strategies. Translation to a tumour position does not imply any loss in terms of average volume overlap, although the minimum volume overlap is lower for the superior and posterior positions. From and we conclude that translation to a tumour position results in a similar volume of normal tissue in the high dose region compared with no translation, i.e. no correction, of the CTV position. With isotropic margins translation to a tumour position reduces the average excess volume of normal tissue.
For anisotropic adaptation to the envelope of all repeat CTVs on all scans the excess volumes of normal tissue are reduced in 6 of 8 cases compared with those achieved with daily isotropic optimisation (right and left). Even without any correction, the anisotropic optimisation on individual CTVs reduces the volume of normal tissue within the high dose region by half. Previous studies have only investigated or implemented adaptation of the PTV based on multiple CT scans Citation[5], Citation[6], Citation[11]. This study shows, as Burridge et al. Citation[5] indicated, that individual daily adaptation of the PTV is superior to adaptation to a series of repeat scans.
For clinical implementation of the findings of this study, the optimisation time should also be taken into account. Isotropic optimisation is obviously much faster than anisotropic, which usually requires up to 2 500 iterations taking approximately 15 minutes. Since the iteration process is stochastic it can never be certain that the result obtained is the true optimum. However, an interchange of 1–2 mm in two of the margins has only a small impact on the resulting volume of normal tissue enclosed by the PTV. With this in mind, it would be possible to reduce the number of iterations to where a ‘good enough’ result is found, i.e. when the volume of normal tissue enclosed by the PTV is very close to its optimum value. Further, considering daily RT optimisation according to the true position and shape of the CTV makes the traditional PTV concept out-of-date. In that case the percentage volume overlap should be regarded with greater importance than the excess volumes of normal tissue. However, for the various tumour positions these show similar results apart from the lower minimum value for the superior position. The larger variation found in the superior direction is consistent with the findings in the Burridge et al. Citation[5] and Pos et al. Citation[6].
It should also be mentioned that the simulation of various tumour locations includes uncertainties. These consist of both the determination of the correct position on the bladder contour and the possible deformation of the bladder due to the tumour. Lotz et al. have shown that shape variation for a tumour-bearing bladder does not notably differ from that for a healthy bladder Citation[12]. Their study also showed that geometrical variation in tumour position is mainly caused by translation of the bladder wall, and that this is largest for the anterior and superior directions. Other studies have also shown that linear models may be used to predict the bladder wall movement and to correct for the whole bladder deformation during a treatment course Citation[9], Citation[13]. Further, for those patients that had a visible tumour, the simulated tumour positions agreed with the true positions, hence we expect the results of the model used to correlate well with isocentre translation guided by fiducials. Overall there is little variation in the excess volume depending on the tumour position. Therefore it is possible that the anterior and superior variation seen by Lotz et al. Citation[12] can be partly compensated by translation of the repeat CTV to a tumour position.
A study using fiducial tumour markers with the aim to escalate the bladder tumour dose is underway in Aarhus. When considering the clinical implementation of isocentre translation to a tumour position in combination with a boost to the tumour, it should also be taken into account were the tumour (and therefore the highest dose volume) is located. In spite of the sharp dose gradients achieved with IMRT, the dose to the healthy volume closest to the target is still notable. Together with the requirement of an extra margin due to short term bladder expansion Citation[14] a translation to a superior or posterior tumour could increase the intestinal and the rectal morbidity. This margin is in any case needed with or without daily adaptation, and thus the normal tissue sparing effect of daily adaptation remains.
Conclusions
Daily anisotropic adaptation in bladder RT would lead to a reduction of the normal tissue irradiation and hence also the treatment-induced morbidity. A ‘plan of the day’ approach would also enable translation of the isocentre to at least non-superior and non-posterior tumours within the limits on the side effects achieved with today's treatment. If delivering a homogenous dose to the whole bladder the strategy of optimal translation is superior in sparing the normal tissue.
Acknowledgements
The authors acknowledge the assistance of the Clinical Oncologists at Edinburgh Western General Hospital (Hannah Lord) for outlining of the prostate and bladder structures on the CT scans used in this study. Further, this work has been supported by research grants from the Danish Cancer Society, the Danish Postgraduate School for Clinical Oncology and Varian Medical Systems (Palo Alto, California).
References
- Muren LP, Smaaland R, Dahl O. Organ motion, set-up variation and treatment margins in radical radiotherapy of urinary bladder cancer. Radiother Oncol 2003; 69: 291–304
- Søndergaard J, Høyer M, Petersen JB, Wright P, Grau C, Muren LP. The normal tissue sparing obtained with simultaneous treatment of pelvis lymph nodes and bladder using intensity-modulated radiotherapy. Acta Oncol (submitted).
- Muren LP, Redpath AT, McLaren D, Rørvik J, Halvorsen OJ, Høstmark J, et al. A concomitant tumour boost in bladder irradiation: Patient suitably and the potential of intensity-modulated radiotherapy. Radiother Oncol 2006; 80: 98–105
- Liu Y-M, Shiau C-Y, Lee M-L, Huang P-I, Hsieh C-M, Chen P-H, et al. The role and strategy of IMRT in radiotherapy of pelvic tumours: Dose escalation and critical organ sparing in prostate cancer. Int J Radiat Oncol Biol Phys 2007; 67: 1113–23
- Burridge N, Amer A, Marchant T, Sykes J, Stratford J, Henry A, et al. Online adaptive radiotherapy of the bladder: Small bowel irradiated-volume reduction. Int J Radiat Oncol Biol Phys 2006; 66: 892–7
- Pos FJ, Hulshof M, Lebesque JV, Lotz H, van Tienhoven G, Moonen LM, et al. Adaptive radiotherapy for invasive bladder cancer: A feasibility study. Int J Radiat Oncol Biol Phys 2006; 64: 862–8
- Redpath AT, Muren LP. CT-guided intensity-modulated radiotherapy for bladder cancer: Isocentre shifts, margins and their impact on target dose. Radiother Oncol 2006; 81: 276–83
- Redpath AT. A beam model for three-dimensional radiotherapy planning. Br J Radiol 1995; 68: 1356–63
- Redpath AT, Wright P, Muren LP. The contribution of on-line correction for rotational organ motion in image-guided radiotherapy of the bladder and prostate. Acta Oncol ( submitted).
- Redpath AT, Muren LP. An optimisation algorithm for determination of treatment margins around moving and deformable targets. Radiother Oncol 2005; 77: 194–201
- Foroudi F, Wong J, Roxby P, Paneghel A, Laferlita M, Rolfo A, et al. The role of CBCT in treatment field positioning and plan adaptation in an online setting for bladder cancer. Poster presented at Varian Research Partner Symposium, Austin, Tx, April 28–May 1, 2008.
- Lotz HT, Pos FJ, Hulshof MC, Hulshof MCCM, van Herk M, Lebesque JV, et al. Tumor motion and deformation during external radiotherapy of bladder cancer. Int J Radiat Oncol Biol Phys 2006; 64: 1551–8
- Nijholt JLM, Betgen A, Lotz HT, van Herk M, Remeijer P. Prediction of the bladder wall location in presence of a varying urinary inflow. Radiother Oncol 2007;84(Suppl.1):304. (Abstract).
- Mangar SA, Scurr E, Huddart RA, Sohaib SA, Horwich A, Dearnaley DP, et al. Assessing intra-fractional bladder motion using cine-MRI as initial methodology for Predictive Organ Localization (POLO) in radiotherapy for bladder cancer. Radiother Oncol 2007; 85: 207–14