Abstract
Introduction. Dynamic contrast enhanced magnetic resonance imaging (DCE-MRI) allows in vivo characterization of tumour vasculature. As such, it is applicable for monitoring the effects of treatments targeting vasculature. The aims of this study were to evaluate the properties of tumour areas segmented-out by DCE-MRI parameters and to evaluate the changes induced by the vascular disrupting agent (VDA) combretastatin A-4 disodium phosphate (CA4DP), a leading VDA in clinical trials, in these areas. Material and Methods. Two tumour models previously shown to respond differently to CA4DP were chosen. The C3H mammary carcinoma and the KHT sarcoma were grown in the right rear foot of CDF1 and C3H/km mice, respectively, and treated when at 200 or 800 mm3 in size. DCE-MRI, using the contrast agent Gd-DTPA, was performed on a 7 T spectroscopy/imaging system before and 3 hours after i.p. CA4DP administration at a dose of 100 mg/kg. From the voxel concentration-time curves, the semiquantitative parameter of initial area under the curve (IAUC), the model parameters transfer constant Ktrans, interstitial volume ve, and blood plasma volume vp, were calculated. Tumour images were segmented into three groups based on the DCE-MRI model parameters using the K-means algorithm, and the groups were ranked by IAUC. Results. The resulting voxels of the tumour segments were mainly spatially connected structures. Initial DCE-MRI parameter values showed different dependencies on tumour model and size in the regions. For all regions in all tumour groups, the treatment reduced IAUC by 36–51%, whereas the model parameters showed more dependencies on tumour model and size. Discussion. This segmentation technique identifies tumour regions with different microenvironmental characteristics responding differently to CA4DP and may be valuable in the optimization of combined VDA with radiotherapy or chemotherapy. The method may also prove useful for optimization and monitoring of local treatment such as radiotherapy.
Noninvasive imaging of tumours before and during treatment is important for optimizing treatments for individual tumour physiology and evaluation of response. Dynamic contrast enhanced magnetic resonance imaging (DCE-MRI) is an noninvasive and nonionizing approach, which describes different aspects of tumour vasculature and interstitial volume. It is used both preclinically and clinically to assess tumour physiology and response to treatment (for review see Citation[1]). As DCE-MRI mainly describes vasculature, it has very high value in monitoring treatments targeting tumour vasculature.
The tubulin binding agent combretastatin A-4 disodium phosphate (CA4DP) is a leading vascular disrupting agent (VDA) in clinical trials (for review see Citation[2]). It has cytotoxic and antiproliferative effects against dividing endothelial cells and thereby induces vascular damage and perfusion changes in various tumour types. Its efficacy, however, varies significantly among different types of tumour Citation[3]. Despite the induced vascular damage, the drug has only a small impact on tumour growth. It is general for VDAs that a substantial effect is seen in central tumour regions, whereas peripheral tumour cells form a viable rim which get their nutrient supply from the surrounding tissue's physiological vessels that are unaffected by the treatment Citation[2]. As VDAs do not typically induce tumour regressions, clinically translatable noninvasive imaging methods are being exploited. DCE-MRI has been used in both experimental and clinical evaluation of tumour response to CA4DP Citation[4–13]. For the full potential of CA4DP as an anticancer agent to be achieved, the drug must be combined with treatments that affect the viable tumour rim. Radiation is one such therapy, and several studies have shown that giving VDAs with radiation is an effective combination Citation[2]. Another combination is VDAs and chemotherapy, and here DCE-MRI may also help optimizing timing and doses. We have previously investigated the effect of CA4DP on radiotherapy efficacy and found a complex dose response relationship Citation[13]. Additional studies suggest that the vasculature may also be a target for radiation damage Citation[14], an effect we explored for different radiation schedules using DCE-MRI Citation[15].
DCE-MRI parameters have also been investigated as predictors for outcome to radiotherapy (for review see Citation[16]). Besides the vascular parameters, which relate to oxygenation, the parameter estimating interstitial volume relates to cellularity, which is important for radiotherapy. Different results have been obtained, and more standardized data acquisition and analysis will improve the comparison of such results. Thus, DCE-MRI provides information regarding different aspects of the tumour microenvironment with high spatial resolution. We hypothesized that the high spatial resolution can be used for segmentation of tumours into regions with different microenvironments by taking into account three DCE-MRI parameters, and that these areas will respond differently to CA4DP. Different segmentation methods are available, including the K-means algorithm which minimizes the sum of the within-group point to centre distances for voxel parameter vaules. This approach is insensitive to the spatial distribution of the voxels.
The aims of this study were to evaluate the properties of tumour areas segmented-out by DCE-MRI parameters using the K-means algorithm and to evaluate the effect of CA4DP by DCE-MRI in the identified regions in two tumour models previously shown to respond differently to CA4DP.
Material and methods
Animal and tumour model
C3H mammary carcinomas grown in female CDF1 mice and KHT sarcomas grown in female C3H/km mice were used for all experiments. Derivation and maintainance of the tumour models have been described previously Citation[17], Citation[18]. All tumours were implanted into the right rear foot of the animals. Experiments were performed when tumours had reached 200 or 800 mm3 in size, which typically occurred 3–4 weeks after inoculation. Tumour volume was calculated from the formula D1×D2×D3×π/6, where the D values represent the three orthogonal diameters. All experiments were performed under national and European Union-approved guidelines for animal welfare.
Drug preparation
CA4DP was supplied by OXiGENE, Inc. (Waltham, MA, USA). The drug was dissolved in saline immediately prior to each experiment; it was kept cold and protected from light. The stock solution was further diluted in saline so that it could be given as a single intraperitoneal (i.p.) injection at a constant volume of 0.02 ml/g at a dose of 100 mg/kg mouse body weight.
Dynamic contrast enhanced MRI
A 7 Tesla spectroscopy/imaging system (Varian, Palo Alto, CA) was used for the DCE-MRI. The mice were restrained in specially constructed lucite jigs. The tumour-bearing legs were then exposed and loosely attached to the jig with tape without impairing the blood supply to the foot. The tail was restrained by tape, and a cannula connected via a 0.38 mm inner diameter line to a syringe primed with contrast agent solution was applied intravenously (i.v.) in a tail vein. An i.p. line similar to the i.v. line was connected to a syringe primed with CA4DP solution. The jig was positioned in a cradle containing an 11 mm surface coil and tuning box; the tumour was located under the coil, and a warm water tube was wrapped around the jig.
The imaging protocol included an inversion recovery sequence for T1 mapping with FOV = 25×25 mm, slice thickness = 2 mm, matrix size = 128×64 reconstructed to 128×128, TR=2430 ms, TI=100; 400; 800; 1600; 2400 ms, and TE=13 ms, followed by dynamic image acquisition using a fast spoiled gradient echo sequence with FOV = 25×25 mm, slice thickness = 2 mm, matrix size = 128×100 reconstructed to 128×128, flip angle = 70°, TR=60 ms, and TE=3 ms. This gave a time resolution of 6 s for the dynamic images. During the initial 4 s of the 6th image acquisition, Gd-DTPA (Magnevist, Schering, Berlin, Germany) was administered i.v. at a dose of 0.1 mmol/kg and concentration of 0.02 mmol/ml. One hour after the Gd-DTPA administration, CA4DP was administered i.p. The imaging protocol was repeated with the dynamic imaging acquisition starting 3 hours after the CA4DP administration.
For each tumour, a region of interest (ROI) containing the whole tumour was drawn by hand for the data analysis. T1 maps were calculated from the pre and post CA4DP inversion recovery sequence. We assumed a relaxivity r1=3980 M−1s−1 Citation[19]. Signal intensity was related to R1 by the signal equation for the T1-weighted fast spoiled gradient echo sequence for voxel-by-voxel calculation of Gd-DTPA concentration at each time point.
Voxel concentration-time curves were used to calculate maps of vascular parameters. The semiquantitative parameter initial area under the curve (IAUC) was calculated by trapezoidal integration of the Gd-DTPA concentration over the first 90 s post administration. Tumour voxels with a low initial contrast agent uptake cannot be used for model analysis and are assumed necrotic. Therefore voxels with initial IAUC values less than 0.0005 Ms were excluded from IAUC ROIs and the following quantitative analysis for supporting consistency between IAUC and model ROIs.
The standard DCE-MRI model including a vascular term (three-parameter model) was fitted to the curves for quantitative estimation of the transfer constant, Ktrans, the rate constant, kep, the extravascular extracellular space, ve=Ktrans/kep, and the plasma volume fraction, vp Citation[20]:1 where Ct(t) was the tissue concentration of Gd-DTPA and Cp(t) was the plasma concentration of Gd-DTPA. The same model without the vascular term (two-parameter model) was also applied. Tracer plasma concentration
was based on measurements by Furman-Haran et al. Citation[21] and adapted in this experiment. The published m1=0.00717 s−1, m2=0.00095 s−1, and a1/a2=1.3437 were used along with the current dose D = 0.0001 mol/kg and mass per plasma a1+a2=30.17 kg/l, assuming a blood volume of 65 ml/kg and a previously measured hematocrit of 0.49 Citation[22].
All data analysis was performed in MATLAB 7.4 (The MathWorks, Inc., Natick, MA, USA). Fitting was performed using nonlinear least squares minimization, and both models were fitted for each voxel in the IAUC ROI in which voxels with low contrast uptake were excluded. The criteria for an acceptable fit were positive parameter values and a mean fit point distance to the measured points larger than or equal to 0.5 M. Voxels not satisfying these criteria were excluded from the model ROIs. In voxels where a two-parameter fit was superior to a three-parameter fit, this was most likely due to low plasma volume. Therefore the values of the two-parameter model were adopted into the three-parameter model with vp set to zero. When voxels showed an acceptable fit pre treatment only, this was most likely due to complete vascular shutdown post treatment making model parameter estimation impossible. However, exclusion of these voxels would underestimate the drug effect. Therefore such voxels were included with post treatment Ktrans, kep, and vp set to 0. However, the model parameter ve=Ktrans/kep was then indeterminate post treatment in these voxels, and therefore we compared pre and post treatment ve by ROIs, in which only voxels having satisfying model fits at both time points were included.
Segmentation was performed by the K-means algorithm using the squared euclidean distance measure. Outlier points strongly influenced the resulting region size (data not shown). Therefore, parameter values which differed from the median by more than 9 times the interquartile range were removed before the segmentation. Following this, the parameter values were divided by their standard deviations such that these were normalized. Based on the model parameters Ktrans, ve, and vp, each tumour was segmented into three regions, which were ranked by their IAUC median value.
Pre and post treatment parameter maps were then compared with respect to median values of identical ROIs by one-way ANOVA with p < 0.05 considered significant.
Results
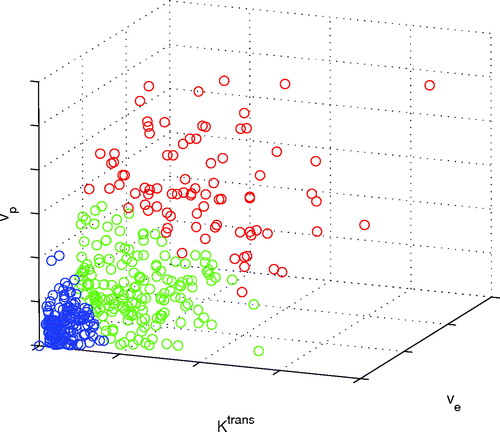
shows the voxel segmentation of an example tumour. From this view, the differently coloured groups are visually separated. The red group has the highest IAUC, and the blue group has the lowest.
Figure 1. Voxels of a 200 mm3 KHT tumour divided into three regions with different DCE-MRI model parameter characteristics by the K-means algorithm.
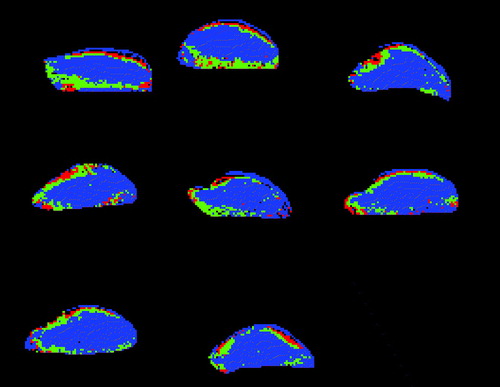
In are shown the spatial distribution of the regions resulting from the segmentation for all eight 200 mm3 KHT tumours in this study. Generally, the grouped voxels form connected structures, and there is a trend that the highst perfused areas are close to the tumour edge. The blue areas, which have the lowest degree of vascularization, make up the largest part of the tumours.
Figure 2. Regions with different vascular characteristics defined in the eight 200 mm3 KHT tumours. Red, green, and blue areas are regions with initially high, medium, and low IAUC, respectively.
The mean (±1 s.e.) for the estimated parameters in each region are shown in . The initial DCE-MRI parameters showed different dependencies on tumour model and size in the three regions. In region a, having the highest IAUC, vp was significantly higher in the C3H tumour than in the KHT tumour (p < 0.01), and Ktrans was significantly higher in the KHT tumour than in the C3H tumour (p < 0.05). These parameters were more homogeneous in region b, and in region c the C3H tumour showed size dependent IAUC (p < 0.01) and Ktrans (p < 0.01), and the C3H tumour showed size dependent vp (p < 0.05). In region c, vp was highest in the C3H tumour (p < 0.01), and Ktrans is highest in the KHT tumour (p < 0.01).
Figure 3. Initial parameter values and relative parameter change measured three hours after CA4DP treatment (mean±1 s.e.) in 200 or 800 mm3 C3H mammary carcinomas or KHT sarcomas. Parameters are shown for three tumour regions, which are sorted by the initial IAUC. Regions a, b, and c show results for initially high, medium, and low IAUC, respectively. The parameters shown are IAUC (black), 20×Ktrans (blue), ve/10 (green), and vp/2 (red). The scaling fits the initial parameters into the same scale for visualization. IAUC describes general vascularization, Ktrans depends on perfusion and vascular permeability, ve is interstitial volume fraction, and vp is blood plasma volume fraction.
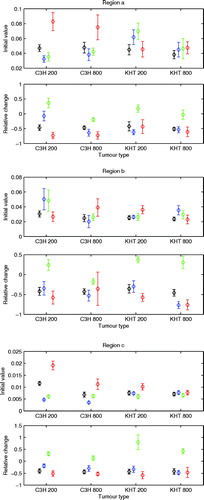
For all regions in all tumour groups, the treatment reduced IAUC by 36–51%, whereas the model parameters showed more dependencies on tumour model and size. In general, the vascular parameters were reduced following treatment, but not all parameters for all tumour groups in each region showed significance. ve showed an increase or no change. In regions a and b, ve change was tumour model dependent (p < 0.05), and in region b, Ktrans change was tumour size dependent (p < 0.05).
Discussion
DCE-MRI provides parameters, which describe different aspects of tumour vasculature and interstitial volume. This in vivo method is noninvasive, nonionizing, and generally available in both preclinical and clinical settings. Another MRI method providing microenvironmental information is diffusion weighted MRI, which can provide apparent diffusion coefficient (ADC) maps. This method is sensitive to edema and necrosis, and a comparison with DCE-MRI in evaluating CA4DP induced microenvironmental changes showed that ADC had a good reproducibility Citation[23]. However, DCE-MRI provides several different parameters related to different aspects of the microenvironment. In this study, an attempt was made to objectively segment murine tumours into regions of common microenvironmental properties by three DCE-MRI parametric maps. The spatial location of the segmented voxels tended to produce connected structues indicating that relatively large tumour areas have common microenvironmental characteristics. The post treatment values were estimated in the exact same regions because the animals were restrained during the whole experiment. In a clinical setting, repositioning becomes an issue, but here the use of landmarks and multislice imaging can help overcome such a problem.
Before the K-means algorithm was applied on the parameter values, outlier parameters were excluded as they influenced the region sizes strongly. Rather than absolute thresholding of parameter values, distance measured as interquartile range from the median value was chosen and gave a good performance. Still, one striking issue is that one region constitutes the majority of the tumour.
The identified regions showed different dependencies of the DCE-MRI parameters on tumour model and size. Also, the response to CA4DP was different in the three regions. This indicates that regions of certain microvascular characteristics have been identified. We have previously found complex CA4DP dose dependencies in the optimization of CA4DP and radiotherapy Citation[13], and regional tumour responses may in part be responsible for this. Therefore segmentation may be useful in the optimization of combined VDA and radiotherapy or chemotherapy where regional responses play a role.
The region characteristics are not based on absolute values of the physiologically interpretable DCE-MRI parameters, but results of individual tumour segmentation by a method which minimizes the sum of the within-group point to centre distances. Strict interpretations of common vascularity or cellularity in a group may therefore not apply. Still, validation of physiological properties of the tumour regions may be obtained by comparison with histology in future studies. The fact that the regions make up connected areas rather than spread-voxels facilitates this, and clinically the region size could allow optimization and monitoring of local treatment such as radiotherapy. Potential predictive information in this kind of segmentation can be obtained from clinical DCE-MRI studies.
Conclusions
The demonstrated segmentation technique identifies tumour regions with different microenvironmental characteristics. These respond differently to CA4DP, and the method may therefore be valuable in the optimization of combined VDA and radiotherapy or chemotherapy. The method is also potentially useful in in vivo tumour characterization for radiotherapy treatment planning and monitoring. This segmentation technique identifies tumour regions with different microenvironmental characteristics responding differently to CA4DP and may be valuable in the optimization of combined VDA with radiotherapy or chemotherapy. The method may also prove useful for optimization and monitoring of local treatment such as radiotherapy.
Acknowledgements
The authors would like to thank Ms. Inger Marie Horsman, Ms. Dorthe Grand, and Mr. Mogens J. Johannsen for excellent technical assistance, and the Danish Cancer Society and the Danish Research Agency for financial support.
References
- Padhani AR, Dzik-Jurasz A. Perfusion MR imaging of extracranial tumor angiogenesis. Top Magn Reson Imaging 2004; 15: 41–57
- Horsman MR, Siemann DW. Pathophysiologic effects of vascular-targeting agents and the implications for combination with conventional therapies. Cancer Res 2006; 66: 11520–39
- Murata R, Siemann DW, Overgaard J, Horsman MR. Interaction between combretastatin A-4 disodium phosphate and radiation in murine tumors. Radiother Oncol 2001; 60: 155–61
- Dowlati A, Robertson K, Cooney M, Petros WP, Stratford M, Jesberger J, et al. A phase I pharmacokinetic and translational study of the novel vascular targeting agent combretastatin a-4 phosphate on a single-dose intravenous schedule in patients with advanced cancer. Cancer Res 2002; 62: 3408–16
- Galbraith SM, Maxwell RJ, Lodge MA, Tozer GM, Wilson J, Taylor NJ, et al. Combretastatin A4 phosphate has tumor antivascular activity in rat and man as demonstrated by dynamic magnetic resonance imaging. J Clin Oncol 2003; 21: 2831–42
- Stevenson JP, Rosen M, Sun W, Gallagher M, Haller DG, Vaughn D, et al. Phase I trial of the antivascular agent combretastatin A4 phosphate on a 5-day schedule to patients with cancer: Magnetic resonance imaging evidence for altered tumor blood flow. J Clin Oncol 2003; 21: 4428–38
- Beauregard DA, Hill SA, Chaplin DJ, Brindle KM. The susceptibility of tumors to the antivascular drug combretastatin A4 phosphate correlates with vascular permeability. Cancer Res 2001; 61: 6811–5
- Beauregard DA, Pedley RB, Hill SA, Brindle KM. Differential sensitivity of two adenocarcinoma xenografts to the anti-vascular drugs combretastatin A4 phosphate and 5,6-dimethylxanthenone-4-acetic acid, assessed using MRI and MRS. NMR Biomed 2002; 15: 99–105
- Maxwell RJ, Wilson J, Prise VE, Vojnovic B, Rustin GJ, Lodge MA, et al. Evaluation of the anti-vascular effects of combretastatin in rodent tumours by dynamic contrast enhanced MRI. NMR Biomed 2002; 15: 89–98
- Bentzen L, Vestergaard-Poulsen P, Nielsen T, Overgaard J, Bjørnerud A, Briley-Saebø K, et al. Intravascular contrast agent-enhanced MRI measuring contrast clearance and tumor blood volume and the effects of vascular modifiers in an experimental tumor. Int J Radiat Oncol Biol Phys 2005; 61: 1208–15
- Salmon BA, Salmon HW, Siemann DW. Monitoring the treatment efficacy of the vascular disrupting agent CA4P. Eur J Cancer 2007; 43: 1622–9
- Salmon BA, Siemann DW. Characterizing the tumor response to treatment with combretastatin A4 phosphate. Int J Radiat Oncol Biol Phys 2007; 68: 211–7
- Nielsen T, Murata R, Maxwell RJ, Stødkilde-Jørgensen H, Ostergaard L, Horsman MR. Preclinical studies to predict efficacy of vascular changes induced by combretastatin a-4 disodium phosphate in patients. Int J Radiat Oncol Biol Phys 2008; 70: 859–66
- Garcia-Barros M, Paris F, Cordon-Cardo C, Lyden D, Rafii S, Haimovitz-Friedman A, et al. Tumor response to radiotherapy regulated by endothelial cell apoptosis. Science 2003; 300(5622)1155–9
- Horsman MR, Nielsen T, Østergaard L, Overgaard J. Radiation administered as a large single dose or in a fractionated schedule: Role of the tumour vasculature as a target for influencing response. Acta Oncol 2006; 45: 876–80
- Zahra MA, Hollingsworth KG, Sala E, Lomas DJ, Tan LT. Dynamic contrast-enhanced MRI as a predictor of tumour response to radiotherapy. Lancet Oncol 2007; 8: 63–74
- Overgaard J. Simultaneous and sequential hyperthermia and radiation treatment of an experimental tumor and its surrounding normal tissue in vivo. Int J Radiat Oncol Biol Phys 1980; 6: 1507–17
- Kallman RF, Silini G, Putten LMV. Factors influencing the quantitative estimation of the in vivo survival of cells from solid tumors. J Natl Cancer Inst 1967; 39: 539–49
- Pedersen M, Mørkenborg J, Jensen FT, Stødkilde-Jørgensen H, Djurhuus JC, Frokiaer J. In vivo measurements of relaxivities in the rat kidney cortex. J Magn Reson Imaging 2000; 12: 289–96
- Tofts PS, Brix G, Buckley DL, Evelhoch JL, Henderson E, Knopp MV, et al. Estimating kinetic parameters from dynamic contrast-enhanced T(1)-weighted MRI of a diffusable tracer: Standardized quantities and symbols. J Magn Reson Imaging 1999; 10: 223–32
- Furman-Haran E, Grobgeld D, Degani H. Dynamic contrast-enhanced imaging and analysis at high spatial resolution of MCF7 human breast tumors. J Magn Reson 1997; 128: 161–71
- Horsman MR, Finch A, Overgaard J. Erythropoietin improves the oxygen carrying capacity of mouse blood without changing hypoxia in a murine tumour model. Eur J Cancer Suppl 2003; 1: S13
- Thoeny HC, Keyzer FD, Vandecaveye V, Chen F, Sun X, Bosmans H, et al. Effect of vascular targeting agent in rat tumor model: Dynamic contrast-enhanced versus diffusion-weighted MR imaging. Radiology 2005; 237: 492–9