Abstract
Purpose. To investigate how the use of volumetric image-guidance using an on-board cone-beam computed tomography (CBCT) system impacts on the frequency of adaptive re-planning. Material and methods. Treatment courses of 146 patients who have undergone a course of external beam radiation therapy (EBRT) using volumetric CBCT image-guidance were analyzed. Target locations included the brain, head and neck, chest, abdomen, as well as prostate and non-prostate pelvis. The majority of patients (57.5%) were treated with hypo-fractionated treatment regimens (three to 15 fraction courses). The frequency of image-guidance ranged from daily (87.7%) to weekly or twice weekly. The underlying medical necessity for adaptive re-planning as well as frequency and consequences of plan adaptation to dose-volume parameters was assessed. Results. Radiation plans of 34 patients (23.3%) were adapted at least once (up to six time) during their course of EBRT as a result of image-guidance CBCT review. Most common causes for adaptive planning were: tumor change (mostly shrinkage: 10 patients; four patients more than one re-plan), change in abdominal girth (systematic change in hollow organ filling; n=7, two patients more than one re-plan), weight loss (n=5), and systematic target setup deviation from simulation (n=5). Adaptive re-plan was required mostly for conventionally fractionated courses; only 5 patient plans undergoing hypo-fractionated treatment were adjusted. In over 91% of adapted plans, the dose-volume parameters did deviate from the prescribed plan parameters by more than 5% for at least 10% of the target volume, or organs-at-risk in close proximity to the target volume. Discussion. Routine use of volumetric image-guidance has in our practice increased the demand for adaptive re-planning. Volumetric CBCT image-guidance provides sufficient imaging information to reliably predict the need for dose adjustment. In the vast majority of cases evaluated, the initial and adapted dose-volume parameters differed to a degree that was considered clinically significant.
To ensure adequate target coverage, unnecessary high doses may be given to surrounding normal tissues due to the planning target volume margins required. On the other hand, if margins are too tight, the risk for geographic miss increases. Irrespective of the margins set, many patients receiving fractionated radiotherapy have marked anatomic changes during their course of treatment, including shrinking of the primary tumor or nodal masses, resolving postoperative changes and/or edema, and changes in overall body contour due to weight loss Citation[1], Citation[2]. Not infrequently, these changes are not compensated for by the assigned PTV margins, which are inherently not designed to account for such changes.
Implementation of the concept of adaptive radiotherapy in such circumstances enables an individualized response to any intra-treatment change, typically through repeating the entire care cycle with re-simulation, new treatment planning, and repeat-QA processes. Occasionally, the observed change may be accounted for through re-optimization of treatment plans. In the adaptive radiotherapy process Citation[3], Citation[4], measured on-treatment patient-specific variations are used to modify the patient setup and treatment plan, potentially multiple times during the treatment course, with the goal of permitting greater dose delivery to targeted areas and sparing of normal structures. The goal of these plan adaptations is the potential for superior clinical outcomes.
Measuring on-treatment patient-specific variations objectively has become more readily possible with the advent of volumetric imaging modalities associated with the treatment delivery devices. Today, these capabilities include megavoltage (MV) imaging, kilovoltage (kV) imaging, and solutions using non-ionizing radiation Citation[5–8]. At Oregon Health and Science University, on-board kV cone-beam CT (CBCT) imaging is being utilized routinely to provide volumetric information on patient anatomy at treatment conditions in the sense of image-guidance studies.
In this review, we evaluate whether changes in anatomical information on serial CBCT scans could be indicative of the need for adaptive radiotherapy. The frequency and the dose-volume-based merits of CBCT-prompted adaptive radiotherapy during treatment at our institution will also be assessed.
Methods and materials
Since the clinical implementation of two on-board imaging equipped linear accelerators (Trilogy, Varian Medical Systems, Palo Alto, CA, USA) in June of 2007, 146 patients have undergone a course of definitive EBRT at the Department of Radiation Medicine at Oregon Health and Science University who were subjected to various schedules of volumetric CBCT image-guidance. Target locations included the brain, head and neck, chest, abdomen, and prostate, as well as non-prostate, pelvis.
For virtual radiation therapy planning, each patient underwent CT simulation on a dedicated multi-slice helical big-bore simulator with slice spacing equal or smaller than 3 mm (Brilliance CT Big-bore Configuration; Philips Medical Systems, Cleveland, OH, USA). Typical immobilization devices were used (various mask systems, VacLok). Patients who underwent stereotactic body radiation therapy (SBRT) or other hypo-fractionated treatment courses were immobilized using a double vacuum whole-body immobilization system (BodyFix; Medical Intelligence, Schwabmuenchen, Germany). Target volumes and normal structures were manually contoured on the axial slices of the CT simulation scan. The gross tumor volume (GTV) or clinical target volume (CTV) was then expanded to form a planning target volume (PTV) according to the clinical protocol per anatomical site and the validated accuracy parameters specific to our institution. Treatment planning was performed either on a Pinnacle3 treatment planning system (Philips Medical Systems, Andover, MA), using the adaptive convolution superposition algorithm, or on the Eclipse planning platform (Varian Medical Systems, Palo Alto, CA), using the anisotropic analytical algorithm.
Prior to treatment, patients were immobilized in a similar manner as during CT simulation. After immobilization, a volumetric CBCT of each patient was acquired for image-guidance purposes only. The frequency of image-guidance ranged from daily to once weekly; 87.7% of patients underwent daily image-guidance, the remainder were scheduled for weekly or twice weekly CBCT image-guidance.
Without following a specific protocol, the responsible radiation oncologist ordered a re-simulation when anatomical changes were observed on CBCTs used for image-guidance that in his or her opinion would have impacted on the delivered dose to target and normal/critical structures. In these patients the previously outlined care cycle was repeated. All patients underwent a new CT re-simulation, and a new treatment plan was generated. If a comparison between original and re-simulation CT revealed only minor anatomy changes, no new adaptive plan was generated (4 cases). Individually, patients underwent up to six re-simulations with subsequent generation of a respective series of anatomy adapted treatment plans. We explicitly excluded patients undergoing a previously scheduled re-simulation for boost treatment from this analysis, even when an adjustment would have been justified by review of CBCT or the boost simulation CT.
For purpose of this analysis the simulation CT and the re-simulation CT were imported into the planning system used to generate the original treatment plan. It is noteworthy that this may deviate from actual clinical practice in which an original plan may have been generated on one planning system while another was used to generate the adapted treatment plan. Targets and normal structures were re-contoured in the secondary data sets, and the dose profile derived from the original treatment plan was re-computed onto the re-simulation CT to assess changes in target and normal tissue dose-volume parameters.
The frequency with which adaptive re-planning was conducted, as well as the medical validity of adaptive re-planning, was assessed quantitatively by evaluating dose-volume histograms (DVHs) of the superimposed original fluence map on the re-simulation CT.
Owing to a lack of validated parameters to classify adaptive re-planning cohorts, and the encountered variability in underlying causes for adaptive re-planning, as well as the associated wealth of dose-volume findings associated with each individual patient case, we report four case scenarios that highlight rationale, clinical value, but also limitations of such analyses.
Results
In the population studied, a re-simulation was prompted by image-guidance review in 37 patients. Of those, radiation plans of 34 patients (91.9%) were adapted at least once (up to 6 times, owing to systematic continued shrinkage) during their course of EBRT. Co-registration of re-simulation CT to the original simulation CT revealed only minor anatomy changes in 3 patients, and no plan adaptation was conducted as the defined PTV was judged to appropriately account for those variations. Most common causes for adaptive planning were: tumor change (mostly shrinkage; 10 patients; 4 patients more than 1 plan change), change in abdominal girth (systematic change in hollow organ filling; n = 7, 2 patients more than 1 change), weight loss (n = 5), and systematic setup deviation from simulation (n = 5). Adaptive plan change was required mostly for conventionally fractionated courses; only 5 patient plans undergoing hypo-fractionated treatment were adjusted.
In over 91% of re-simulation (31 of 34 cases), the dose-volume parameters did deviate from the prescribed plan dose by more than 5% for at least 10% of the target volume, or organs-at-risk in close proximity to the target volume.
Case studies
In the following paragraphs we demonstrate scenarios of CBCT findings, and provide the physician's rationale to re-simulate, and potentially re-plan the respective patients. In the cases selected, we will also discuss impact of adaptive re-planning on changes of both targets and normal tissues dose-volume parameters. three plans will be reviewed for each case: 1) the original plan on the planning CT scan, 2) the original CT plan applied to the anatomy of the re-simulation CT scan with no re-optimization, and 3) the re-optimized plan on the re-simulation CT scan (also called adapted plan).
Case 1: Tumor location change
Clinical information
Male, metastatic malignant melanoma, solitary metastasis in the infra-renal fossa. Treatment was prescribed as SBRT (3 fractions of 12 Gy to 95% of the PTV; PTV was defined as internal target volume (ITV) plus 5 mm margins). Organs at risk delineated and considered in plan DVH review were the spinal cord (length delineated, 2 cm cranial to 2 cm caudal to the PTV), as well as the right and left kidney.
Image-guidance findings and rational for adaptive re-planning
The CBCT acquired immediately before delivery of the second SBRT fraction revealed a location change of the GTV from medially between kidney and the psoas muscle to posterior/inferior to the kidney. While the distance to the spinal cord was increased, it was considered that positional adjustment by image-guidance alone – while technically feasible – may have caused normal tissue dose changes of unknown extent and re-simulation was ordered.
Clinically, two potential strategies were discussed. (1) Assessment of the resulting deviation in dose-volume parameters due to image-guidance-prompted positional adjustment, with particular focus on target dose coverage, as well as organ at risk dose exposure changes. (2) Adaptive re-planning, assuming that the targets location would be consistent for the outstanding 2 fractions.
Adaptive plan volumetric dose findings
Under the image-guidance approach, where the original plan dose distribution was optimally centered over the centroid of the new tumor location, PTV coverage by the prescribed dose (PD) marginally increased from 98.8 to 99.8% and ITV coverage remained at 100%. Mean PTV doses increased from 116.2% of PD in the original plan to 136.9% with no re-plan. Associated with this change, both minimum and maximum dose increased by 9.9 and 22.3%, respectively. Maximum ITV doses increased from 127.3 to 149.3%. Mean and maximum spinal cord doses were reduced by up to 58%, while mean right kidney doses increased from 2.2 to 2.6 Gy. Dose to 33% of the right kidney increased from 1.8 to 3 Gy ().
Table I. Dose-volume parameter comparisons of original plan, original plan on re-simulation CT (no re-plan), and adapted plan on re-simulation CT for Case 1. Doses are based on a fractional dose of 12 Gy. D33 is the dose to 33% of a structure if interest.
Re-optimization of the treatment plan on the re-simulation CT scan resulted in a PTV coverage of 95.3% and ITV coverage 100% by the PD. summarize the DVH parameters for the target volumes and the critical structures.
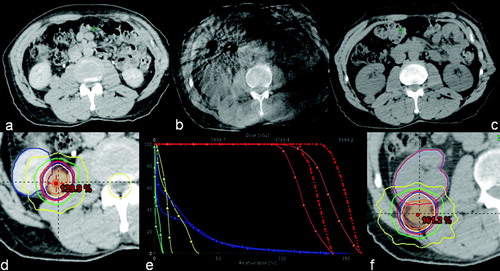
Thus, target positional changes resulted in improved PTV and GTV coverage, as well as an increase in maximum tumor doses. This increase may actually have been favorable, as this treatment was delivered in ablative intent. Owing to increased distance between tumor and spinal cord, the respective dose exposure was lowered. Although the anatomic relationship between tumor and the right kidney had changed quite dramatically, the doses received by the right kidney were not changed very much. Nonetheless, a new treatment plan was created, partially to avoid any clearance issues a more lateral position of the tumor may have caused. documents tumor position at simulation, at image-guidance and in the re-simulation CT. Also, original plan dose and re-simulation dose reconstruction, as well as a comparison DVH are displayed.
Figure 1. Tumor position at simulation, at image-guidance and in the re-simulation CT including original plan dose and re-simulation dose reconstruction, as well as a comparison DVH. PTV is orange-colored, GTV is red, right kidney is blue and spinal is cord yellow The lines with square markings denote the original plan, while the lines with triangles represent the original plan on the re-simulation CT.
Case 2: Abdominal Organ filling change A
Clinical information
Male, lumbar vertebral body 2 (L2) metastasis of neuroendocrine tumor. Treatment was prescribed as SBRT (5 fractions of 5 Gy to 95% of the PTV; the PTV was defined as GTV plus 3 mm margins). Organs at risk delineated and considered in plan DVH review were the spinal cord/cauda equina (length delineated, 2 cm cranial to 2 cm caudal to the PTV). During simulation significant bowel gas, and residual large bowel contrast from an earlier radiological exam was noted; consistent with the patient's complaints of persistent bloating over some period of time.
Image-guidance findings and rational for adaptive re-planning
CBCT analysis revealed an excellent target setup. However, it was also observed that both the high-density bowel contrast as well as air content had decreased quite dramatically. Consequently, the distance from anterior patient surface to mid vertebral body had decreased from initial 17 to 11.5 cm. A re-simulation was ordered for adaptive re-planning. documents imaging findings at time of simulation and image-guidance.
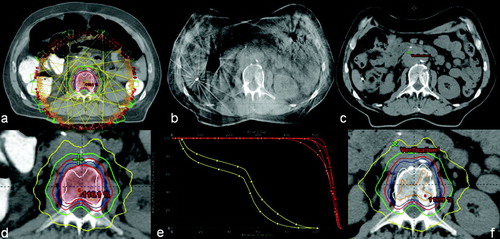
Figure 2. Patient geometry at simulation (a), at image guidance (b), and in the re-simulation CT (c), including original plan dose (d), the original plan applied to the anatomy of the re-simulation CT scan with no re-optimization, as well as a comparative DVH. DVH lines with square markings denote the original plan, while the lines with triangles represent the original plan applied to the re-simulation CT. PTV is orange-colored, GTV is red, and spinal is cord yellow.
Adaptive plan volumetric dose findings
PTV coverage by the prescribed dose (PD) was reduced from 95 to 84%, and GTV coverage decreased from 100 to 96%. Associated reduction in minimum target doses were 16.2 and 20.4% for PTV and GTV, respectively. Mean PTV doses were 109% of PD in the original plan, and would have been marginally reduced to 107.9% of PD. Mean GTV doses were virtually identical at 111.3 and 111.1% of PD, with maximum doses of 118.1 and 118.9% of PD, respectively. Mean and maximum spinal cord doses of 50.6%, and 102.6% of PD were reduced to 42 and 97.1%, respectively.
Re-optimization of the treatment plan on the re-simulation CT scan resulted in PTV coverage of 95% and GTV coverage 98.5% by the PD. summarize the DVH parameters for the target volumes and the critical structures.
Table II. Dose-volume parameter comparisons of original plan, original plan on re-simulation CT (no re-plan), and adapted plan on re-simulation CT for Case 2. Doses are based on a fractional dose of 5 Gy.
Thus, patient anatomy changes caused by changes in bowel air and contrast media excretion resulted in lowered PTV and GTV coverage by the PD, while mean target doses were not significantly changed. Interestingly, the spinal cord dose exposure would have been lower if treatment had continued without plan adjustments. documents dose distributions at simulation and dose reconstruction into the re-simulation, as well as a comparison DVH.
Case 3: Abdominal Organ filling change B
Clinical information
Male, pancreatic carcinoma (pT3N1M0), post Whipple operation. Treatment was prescribed in 1.8 Gy daily fraction for a total dose of 54 Gy to 95% of the PTV. The CTV comprised the tumor bed and nodal resection area; the PTV added margins of 5 mm axially and 10 mm craniocaudally. Organs at risk delineated and considered in plan DVH review were the spinal cord (length delineated, 2 cm cranial to 2 cm caudal to the PTV), both kidneys, and the liver. During simulation significant stomach filling was noted. Thus, a systematic reduction in stomach filling over the course of radiation therapy was anticipated, which in part provided the rationale for daily image-guidance.
Image-guidance findings and rational for adaptive re-planning
CBCT analysis revealed a difficult setup to operative clips over the first days of the radiation course. Contrary to expectations, it appeared that the patient's stomach filling was consistently larger than during CT simulation. A re-simulation was ordered for adaptive re-planning.
Adaptive plan volumetric dose findings
PTV coverage by the prescribed dose (PD) dropped significantly from 95 to 55%, while CTV coverage decreased from 100 to 62%. Associated reduction in minimum target doses were 53.3 and 38.2% for PTV and CTV, respectively. Mean CTV and PTV doses were 103.6 and 103% in the original plan, and 100.3 and 96.7% in the re-simulation plan. No significant changes were observed for organs at risk. Re-optimization of the treatment plan on the re-simulation CT scan resulted in PTV coverage of 95% and GTV coverage 98% by the PD. summarize the DVH parameters for the target volumes and the critical structures.
Table III. Dose-volume parameter comparisons of original plan, original plan on re-simulation CT (no re-plan), and adapted plan on re-simulation CT for Case 3. Doses are based on a fractional dose of 1.8 Gy. D33 is the dose to 33% of a structure if interest.
Thus, patient anatomy changes observed, and caused by changes in stomach filling, impact significantly on PTV and CTV coverage by the PD, as well as the minimum doses, which were also lowered. It is noteworthy that re-simulation CTV and PTV were delineated/created smaller than the original simulation structures by 9.3 and 2.7%, respectively. Nonetheless, although variation in target delineation may explain why only minor changes in maximum and mean target dose-volume parameters were observed, deformation and positional change in target geometry accounted for the discrepancy seen in the minimum target dose-volume parameters.
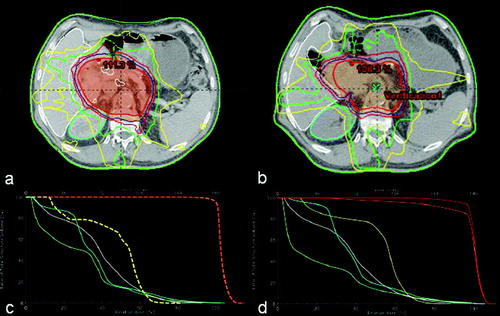
Had adaptive plan adjustment been foregone, the computed increase in spinal cord dose may impact on long term toxicity avoidance probability. Since this re-simulation was initiated following 7 days of consistently increased stomach filling, and stomach filling state was rather increasing than declining until the end of the patients treatment course, increased spinal cord dose exposure would not have factored into the boost plan creation. At the same time, actual dose exposure of kidneys and the liver were lower than predicted; following early adaptive planning, this finding did afford more boost planning flexibility. documents target volumes and organs at risk delineation at the level of clinical relevant operative clips based on simulation and re-simulation CT, as well as a comparison DVH.
Figure 3. Target volumes and organs at risk delineation at the level of clinical relevant operative clips based on simulation (a) and re-simulation with no re-optimization (b) CTs, as well as comparative DVHs (c and d corresponding to original simulation and re-simulation CTs, respectively). PTV is orange-colored, GTV red, and spinal cord yellow, right kidney teal, and left kidney pale green.
Case 4: Tumor shrinkage and weight loss
Clinical information
Male, T3N3 squamous cell carcinoma of the left tonsil with a 6-cm level II node. Treatment was prescribed in 2-Gy daily fraction for a total dose of 70 Gy to 97% of the PTV; the PTV was defined as GTV plus 1 cm margins. Organs at risk delineated and considered in plan DVH review were the brainstem, spinal cord (length delineated, contiguous with brainstem to 2 cm caudal to the PTV), both parotid glands, and the mandible. The patient was scheduled for routine weekly CBCT to monitor setup accuracy and changes in tumor volume.
Image-guidance findings and rational for adaptive re-planning
Weekly volumetric image-guidance was performed. In the 5th week of radiation treatment, significant tumor shrinkage and change in the patient's skin contour was observed. The patient was re-simulated after the 23th fraction of treatment course.
Adaptive plan volumetric dose findings
PTV coverage by the prescribed dose (PD) improved from 97.7 to 98.1%, while the GTV coverage remained at 100%. The mean PTV doses where virtually identical in both original and re-simulation plans (see ) Thus, patient anatomy changes observed, and caused by weight loss, did improve PTV coverage by the PD. It is noteworthy that re-simulation PTV was delineated/created smaller than the original simulation structure; which may explain why there was virtually no difference in the target dose-volume parameters.
Table IV. Dose-volume parameter comparisons of original plan, original plan on re-simulation CT (no re-plan), and adapted plan on re-simulation CT for Case 4. Doses are based on a fractional dose of 2 Gy. D50 is the dose to 50% of a structure if interest.
The most pronounced changes on organs-at-risk were observed on the left parotid gland, situated close to the primary site of the disease. The mean left parotid gland dose decreased from 77.5 to 54%, while the dose 50% of the left parotid gland decreased from 90 to 35% of the PD. The mean dose to the right parotid gland dose, on the other hand increased only marginally by about 7%, while the maximum dose decreased by about 1% of the PD. Doses to 50% of the right parotid gland was virtually unchanged. As for the brainstem, its maximum dose increased from 63.8 to 71%, while its mean dose decreased from 20.3 to 16.7% (see ).
Re-optimization of the treatment plan on the re-simulation CT scan resulted in PTV coverage of 92% and GTV coverage 98% by the PD. summarize the DVH parameters for the target volumes and the critical structures.
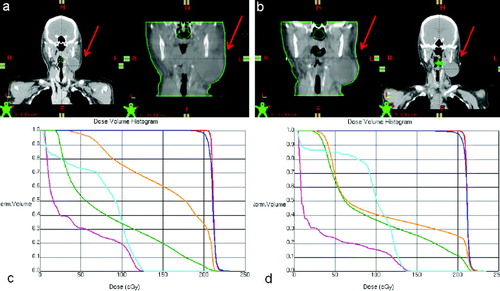
documents changes in target volume and skin contours, as observed on planning CTs and CBCTs, as well as a comparison DVH. Despite the fact that there was little change in PTV coverage, there was a significant change in at least the left parotid gland DVH that warranted plan adaptation. Had adaptive plan adjustment not been performed, the computed increase in mean left parotid dose Citation[9] and maximum spinal cord and brainstem doses may impact on long term toxicity avoidance probability. The patient was subsequently re-planned for 10 fractions to complete treatment course.
Figure 4. Patient geometry at simulation (a, left) with corresponding image-guidance CT prior to treatment fraction 1 (a, right), and at re-simulation (b, right) with corresponding CBCT at treatment fraction 23 (b, left). Comparative DVHs are presented below corresponding CT data sets with PTV in blue, GTV in red, spinal cord in teal, brainstem in pink, right parotid in green, and left parotid in orange.
Discussion
Radiation therapy is typically planned on the basis of a pretherapy-acquired single set of CT scans on which clinical and planning target volumes are delineated in anticipation of potential microscopic spread (CTV) and daily setup variation and intrafractional organ motion (PTV) of the gross tumor volume. Nevertheless, these margins do not specifically address ongoing, and potentially measurable, alterations in patient anatomy that typically occurs gradually and continuously throughout the course of a patient's therapy Citation[1], Citation[7], Citation[10]. Daily image-guided setup corrections have been shown to not only significantly reduce target dose variation and lower dose to critical structures, but can also detect changes in patient anatomy that can potentially impact the latter doses. Kupelian and colleagues Citation[11] and Siker and colleagues Citation[12] used MVCT image sets, generated by helical tomotherapy, to measure tumor volume to document interfractional radiation responses in short time periods. kVCT scans have also been used to evaluate tumor volume changes during radiotherapy Citation[13–15], as well as portal images to monitor tumor position, size, and movement Citation[2]. One thing peculiar to all these studies is that the investigators did observe tumor volume shrinkage to varying degrees during the course of fractionated treatment, suggestive of the fact that tumor volume changes may be clinically relevant as demonstrated by implementation of adaptive dosimetric planning in response to tumor volume changes.
The current presentation of select cases from a larger series of patients that underwent a course of radiation therapy using volumetric image-guidance, documents potential benefits but also some of the limitations of recognizing an anatomic change, and the subsequent approximation of the dosimetric impact on the consistency between prescribed and actually delivered radiation dose. Our early experience in the use of kV CBCT image-guidance confirms that the imaging quality of the used imaging modality was sufficient to detect patient or tumor changes. The data presented are also supportive of our position that these imaging findings justified the significant resource commitment of adaptive re-planning, as the majority of cases benefited from such adjustments in the sense of a more predictable dose delivery. While it has been suggested, and studies have been performed to support that claim, that CBCT image sets can be used to accurately predict dosimetric results Citation[7] and, hence, its feasibility to determine dosimetric implications of tumor and patient geometric alterations Citation[16], Citation[17], it is noteworthy to indicate here that, contrary to such evidence, re-planning in the present study was performed strictly on conventional CT image sets. Despite the usefulness of CBCT volumetric anatomy information for patient positioning and verification, a reliable relationship between the HU and relative electron density is needed; otherwise, in the presence of significant tissue heterogeneity, the dosimetric verification will be flawed. Furthermore, in the presence of motion-induced artifacts, as potentially is in two of the four cases presented here, dosimetric errors become more pronounced, rendering the dosimetric accuracy of CBCT-based dose computation unacceptable.
The actual benefit of dosimetric improvement through adaptive re-planning may be exaggerated by computing the dose of the original treatment plan into the re-simulation CT. Obviously, most of the time, at least a part of the prescribed course of radiation had already been delivered. Compounding dose distributions, by adding the dose delivered through the original radiation dose plan to the adapted scenario may be more appropriate. However, this approach also fails to depict a clear picture, as actual delivered dose leading up to the adaptive plan change, deviated likely to some smaller or larger degree from the prescribed dose. Unless a change was sudden and distinct, as in the case with tumor location changes, the actual delivered dose will still elude our assessment. All clinically adapted plans did not only attempt to re-create the original treatment dose, but also accounted for excess or lower dose exposure going forward. Thus, clinical adaptive planning aimed to compensate or took advantage of dosimetric changes observed. Despite the complexity associated with reporting such data in meaningful detail, we report as above dosimetric changes as if they were sudden and distinct.
The rationale for ordering a re-simulation based on the review of image-guidance CBCT scans was entirely physician dependent. While the frequency of adaptive plan adjustments demands a critical assessment in terms of achieved improvement in plan quality, no clear guidelines exist to benchmark such a clinical decision. While it is unfortunate that non-positional geometric changes in tumor volumes are difficult to predict quantitatively based on patient or tumor characteristics, it is encouraging that in the event of such changes occurring, there are points in time during the treatment course when it may be appropriate to adapt the plan in order to improve sparing of normal tissues. In such instances, guidelines such as a >30% decrease in GTV at any point in the first 20 fractions of a hyperfractionated treatment to prompt adaptive planning Citation[13] could be instituted. Among the cases presented, the two SBRT scenarios showed quite significant anatomy changes. Arguably, the vast majority of treating physicians would have been compelled to order a re-simulation. However, had the actual deliverable dose been known, it may have been just as defendable to utilize the original treatment plan following image-guidance optimization of target setup. The situation was slightly different for the 2 presented conventionally fractionated case. While, target dose-volume parameters overall did not obviously suffer much with anatomy changes, the significantly lowered minimum doses to the PTV yield at least the risk for subsequent impact on local tumor control. Arguably the largest change in actual dose-volume parameters was again observed for organ at risk dose exposure. Having updated knowledge of organ at risk doses during the course of treatment affords safer boost planning, or at least avoids excessive normal tissue complications.
In the present series, more conventionally fractionated than hypofractionated cases were subjected to adaptive re-planning. While this study represents a retrospective data analysis, our preliminary assessment of causes for this finding is based on the volumes of targets; most hypofractionated courses represented targets treated by SBRT. Inherently, patient selection for SBRT stipulates an upper size limit (diameter smaller 5 cm) and restricts dose exposure of organs at risk, partially achieved by selection of targets distant to organs at risk. Thus, even when image-guidance required systematic shifts, organ at risk dosimetry was not likely affected to a significant degree. Furthermore, owing to the fact that hypofractionated treatments courses are inherently short, such clinically significant target positional and geometric time-dependent trends, and, hence, potential dosimetric consequences, may not be observable during a course of therapy Citation[12], Citation[18]. This nevertheless should not preclude the implementation of image-guidance. On the other hand, cases treated by conventional fractionation radiation courses constituted a typical array of cases encountered in an academic institution, with a substantial number of large volume, complex shaped target volumes in close proximity to organs at risk. Any image-guidance-detected systematic change would more likely impact on target or normal tissue dose-volume parameters to a clinically relevant degree Citation[19], Citation[20].
The impact of treatment plan modification on actual clinical outcomes has yet to be determined; in part because in most cases re-simulation was followed by plan adaptation. Hence, the clinical impact of continued dose delivery using the original plan is not captured. Although doses to tumor volumes may (though not always) decrease, and doses to normal structures may (though not consistently) increase without re-planning, it is unknown whether these dosimetric changes would translate into decreased rates of local-regional control or increased rates of normal tissue complications.
In summary, the routine use of volumetric image-guidance has in our practice increased the demand for adaptive re-planning. CBCT image-guidance provided sufficient imaging information to predict dosimetric deviations in the majority of cases studied. Our results suggest that CBCT-prompted re-simulation and adaptive plan adjustments may aid to adequately deliver radiation doses to target volumes, while affording safe dose exposure of normal structures for patients who have clinically identifiable anatomic changes during the course of EBRT.
Declaration of interest: The authors report no conflicts of interest. The authors alone are responsible for the content and writing of the paper.
References
- Barker JL, Jr., Garden AS, Ang KK, O'Daniel JC, Wang H, Court LE, et al. Quantification of volumetric and geometric changes occurring during fractionated radiotherapy for head-and-neck cancer using an integrated CT/linear accelerator system. Int J Radiat Oncol Biol Phys 2004; 59: 960–70
- Erridge SC, Seppenwoolde Y, Muller SH, van Herk M, De Jaeger K, Belderbos JS, et al. Portal imaging to assess set-up errors, tumor motion and tumor shrinkage during conformal radiotherapy of non-small cell lung cancer. Radiother Oncol 2003; 66: 75–85
- Yan D, Lockman D, Brabbins D, Tyburski L, Martinez AA. An off-line strategy for constructing a patient-specific planning target volume in adaptive treatment process for prostate cancer. Int J Radiat Oncol Biol Phys 2000; 48: 289–302
- Martinez AA, Yan D, Lockman D, Brabbins D, Kota K, Sharpe M, et al. Improvement in dose escalation using the process of adaptive radiotherapy combined with three-dimensional conformal or intensity-modulated beams for prostate cancer. Int J Radiat Oncol Biol Phys 2001; 50: 1226–34
- Forrest LJ, MacKie TR, Ruchala K, Turek M, Kapatoes J, Jaradat H, et al. The utility of megavoltage computed tomography images from a helical tomotherapy system for setup verification purposes. Int J Radiat Oncol Biol Phys 2004; 60: 1639–44
- Langen KM, Zhang Y, Andrews R, Hurley ME, Meeks SL, Poole DO, et al. Initial experience with megavoltage (MV) CT guidance for daily prostate alignments. Int J Radiat Oncol Biol Phys 2005; 62: 1517–24
- Ding GX, Duggan DM, Coffey CW, Deeley M, Hallahan DE, Cmelak A, et al. A study on adaptive IMRT treatment planning using kV cone-beam CT. Radiother Oncol 2007; 85: 116–25
- Wen N, Guan H, Hammoud R, Pradhan D, Nurushev T, Li S, et al. Dose delivered from Varian's CBCT to patients receiving IMRT for prostate cancer. Phys Med Biol 2007; 52: 2267–76
- Eisbruch A, Ten Haken RK, Kim HM, Marsh LH, Ship JA. Dose, volume, and function relationships in parotid salivary glands following conformal and intensity-modulated irradiation of head and neck cancer. Int J Radiat Oncol Biol Phys 1999; 45: 577–87
- Hansen EK, Bucci MK, Quivey JM, Weinberg V, Xia P. Repeat CT imaging and replanning during the course of IMRT for head-and-neck cancer. Int J Radiat Oncol Biol Phys 2006; 64: 355–62
- Kupelian PA, Ramsey C, Meeks SL, Willoughby TR, Forbes A, Wagner TH, et al. Serial megavoltage CT imaging during external beam radiotherapy for non-small-cell lung cancer: Observations on tumor regression during treatment. Int J Radiat Oncol Biol Phys 2005; 63: 1024–8
- Siker ML, Tome WA, Mehta MP. Tumor volume changes on serial imaging with megavoltage CT for non-small-cell lung cancer during intensity-modulated radiotherapy: How reliable, consistent, and meaningful is the effect?. Int J Radiat Oncol Biol Phys 2006; 66: 135–41
- Han C, Chen YJ, Liu A, Schultheiss TE, Wong JY. Actual dose variation of parotid glands and spinal cord for nasopharyngeal cancer patients during radiotherapy. Int J Radiat Oncol Biol Phys 2008; 70: 1256–62
- Ding GX, Duggan DM, Coffey CW, Deeley M, Hallahan DE, Cmelak A, et al. A study on adaptive IMRT treatment planning using kV cone-beam CT. Radiother Oncol 2007; 85: 116–25
- Woodford C, Yartsev S, Dar AR, Bauman G, Van Dyk J. Adaptive radiotherapy planning on decreasing gross tumor volumes as seen on megavoltage computed tomography images. Int J Radiat Oncol Biol Phys 2007; 69: 1316–22
- Yoo S, Yin FF. Dosimetric feasibility of cone-beam CT-based treatment planning compared to CT-based treatment planning. Int J Radiat Oncol Biol Phys 2006; 66: 1553–61
- Yang Y, Schreibmann E, Li T, Wang C, Xing L. Evaluation of on-board kV cone beam CT (CBCT)-based dose calculation. Phys Med Biol 2007; 52: 685–705
- Haasbeek CJ, Lagerwaard FJ, Cuijpers JP, Slotman BJ, Senan S. Is adaptive treatment planning required for stereotactic radiotherapy of stage I non-small-cell lung cancer?. Int J Radiat Oncol Biol Phys 2007; 67: 1370–4
- Underberg RW, Lagerwaard FJ, van Tinteren H, Cuijpers JP, Slotman BJ, Senan S. Time trends in target volumes for stage I non-small-cell lung cancer after stereotactic radiotherapy. Int J Radiat Oncol Biol Phys 2006; 64: 1221–8
- Yamada K, Iwai K, Kawamorita R, Okuno Y, Nakajima T. Change in dose distribution of three-dimensional conformal radiotherapy during treatment for lung tumor. Radiat Med 2006; 24: 122–7