Abstract
Introduction. The objective of this study was to examine the accuracy of the Anisotropic Analytical Algorithm (AAA). A variety of different field configurations in homogeneous and in inhomogeneous media (lung geometry) was tested for the AAA algorithm. It was also tested against the present Pencil Beam Convolution (PBC) algorithm. Materials and methods. Two dimensional (2D) dose distributions were measured for a variety of different field configurations in solid water with a 2D array of ion chambers. The dose distributions of patient specific treatment plans in selected transversal slices were measured in a Thorax lung phantom with Gafchromic dosimetry films. A Farmer ion chamber was used to check point doses in the Thorax phantom. The 2D dose distributions were evaluated with a gamma criterion of 3% in dose and 3 mm distance to agreement (DTA) for the 2D array measurements and for the film measurements. Results. For AAA, all fields tested in homogeneous media fulfilled the criterion, except asymmetric fields with wedges and intensity modulated plans where deviations of 5 and 4%, respectively, were seen. Overall, the measured and calculated 2D dose distributions for AAA in the Thorax phantom showed good agreement – both for 6 and 15 MV photons. More than 80% of the points in the high dose regions met the gamma criterion, though it failed at low doses and at gradients. For the PBC algorithm only 30–70% of the points met the gamma criterion. Conclusion. The AAA algorithm has been shown to be superior to the PBC algorithm in heterogeneous media, especially for 15 MV. For most treatment plans the deviations in the lung and the mediastinum regions are below 3%. However, the algorithm may underestimate the dose to the spinal cord by up to 7%.
Before a new calculation algorithm can be utilized clinically, a comprehensive validation is necessary. The accuracy of the dose calculated is very important for the quality and reliability of radiotherapy planning. Thus, an overall accuracy of maximum 5% in the delivery of absorbed dose is required Citation[1]. This has resulted in an extensive research and development of more sophisticated calculation algorithms over the years. Simple calculation algorithms fail in calculating the dose to inhomogeneous media, due to a very simplified modelling of electron transport. Huge deviations may be observed, especially in the lung tissue, as it deviates substantially from water Citation[2].
Numerous studies have tested and compared different types of calculation algorithms Citation[3–6]. Some of these studies have arranged the algorithms in two groups: type a and type b. The type a group covers the algorithms which do not account for lateral electron transport. The type b group includes the effect of lateral electron transport to some extent. The studies all show that when dealing with heterogeneous media, especially low density media, the lateral electron transport is important to include. Therefore, the type b algorithms are recommended.
The Anisotropic Analytical Algorithm (AAA) Citation[7–10], which is implanted in the Eclipse treatment planning system, is a type b algorithm. The behaviour of the algorithm in homogeneous media has recently been addressed by Fogliata et al. Citation[11] and Van Esch et al. Citation[12]. A few simple tests in heterogeneous media have been reported in Van Esch et al., Bragg and Conway and Ding et al. Citation[12–14].
The objective of this present study was to test the AAA algorithms performance in heterogeneous media for clinical realistic treatment plans. We used dosimetric films to measure the two dimensional dose in a phantom which imitates the thoracic region of a lung cancer patient. After simple tests were performed in homogeneous media, we tested ten different treatments plans at both high and low energy. The algorithm was also tested against the present Pencil Beam Convolution (PBC) Citation[15–17] algorithm which is a type a algorithm.
Material and methods
All the tested fields have been calculated in the Eclipse treatment planning system (Varian Oncology Systems, Ca) using both the AAA and the PBC algorithms. A Varian Clinac 2100C/D accelerator delivering 6 and 15 MV photons was used for all measurements.
Homogeneous media
The dose distributions for a variety of fields were measured in solid water (Gammex, Wi) at Source Surface Distance, SSD = 95 cm and depth, d = 5 cm with the 2D ion chamber array seven29 (PTW Freiburg, Germany) for a gantry angle of G = 0o.
The uncertainty of the dose measurement of the 2D array seven29 was tested. It was found to be less than 0.5%, with minor variations between different ion chambers.
The dose distributions for symmetric fields of size 2×2 cm2 to 20×20 cm2 were measured with the 2D array. Likewise, dose distributions were obtained for symmetric and asymmetric fields with Enhanced Dynamical Wedges (EDW). The field size of the symmetric fields with EDW ranged from 4×4 cm2 to 20×20 cm2 with wedges of 15o, 30o, 45o and 60o. For the asymmetric wedged fields, the field size ranged from 5×10 cm2 to 10×15 cm2, and the centre of the fields was offset from the isocenter in the direction of the wedge. All the wedges for the asymmetric fields were 60o. See . Patient specific treatment plans were created and the dose distribution of static and dynamic fields were measured for each separate field for G = 0o.
Table I. Asymmetric fields with wedges.
When AAA is configured, it is possible manually to optimize three parameters to improve the calculations of fields with EDW Citation[11], Citation[18]. We optimized these parameters.
Heterogeneous media and lungs
The dose distributions in inhomogeneous media were measured in a CIRS Model 002LFC IMRT Thorax Phantom (CIRS, Va) for selected transversal slices with Gafchromic EBT dosimetry films (ISP, NJ). The Thorax Phantom imitates the thoracic region of a lung cancer patient, with water, fat, muscle (ρ = 1.03 g/cm3), bone (ρ = 1.60 g/cm3) and lung (ρ = 0.21 g/cm3) tissue Citation[19].
The calibration of the Gafchromic EBT dosimetry films was performed with three separate films irradiated with known doses from 1 to 4 Gy. The films were mounted parallel to the beam between two slabs of box shaped 30×30 cm2 solid water each of thickness 10 cm. Irradiation in this position gave rise to depth dose curves and the calibration curve was determined from a comparison of points on these curves to the similar points determined by Eclipse.
The uncertainty for the Gafchromic EBT dosimetry films was ∼1.5% depending on the handling of the films Citation[20–22].
In one end of the Thorax Phantom ten rods are available for inserting a Farmer ion chamber. The other half of the phantom is divided into twelve slabs each 1 cm wide where the films for 2D dose distribution measurements can be mounted.
We have tested ten different treatment plans in the Thorax Phantom at both energies. They consisted for instance of one Anterior-Posterior (AP) or one lateral field, a four field box technique, Stereotactic Body Radiotherapy (SBRT) and Intensity Modulated Radiotherapy (IMRT) plans. All plans were tested for the AAA and PBC algorithms. The films where inserted in three different slices: the isocenter, plus 3 cm and plus 6 cm from the isocenter in the cranial or caudal directions. In total we had 20 film measurements for each energy.
To check the accuracy and reliability of the film measurements we used a Farmer Type chamber (FC65-G, Scanditronix Wellhöfer, Germany) to measure twelve point doses at two different sites in the mediastinum. In addition, we measured the point dose in the spinal cord for ten plans – five for each energy. All the measurements with the Farmer ion chamber were performed in the isocenter section and compared to the dose measured with the films in the same points. We have found the uncertainty for the Farmer Ion Chamber to be less than 0.1%. In order to rely on the film measurements, the deviation between film measurements and the point dose measurement should be below 3% and preferably below 2%.
Evaluation program
All the measurements were compared with the Eclipse calculations for both the AAA and the PBS algorithm. The 2D dose distributions were evaluated in VeriSoft (PTW Freiburg, Germany) with a gamma criterion Citation[23] of 3% in dose and 3 mm distance to agreement (DTA) for the 2D array seven29 measurements and for the film measurements.
All treatment plans tested in the Thorax Phantom were calculated with the same number of Monitor Units (MU) for AAA and PBC.
Results
Homogeneous media
Comparison of measured and calculated dose distributions for simple symmetric geometries showed a maximum deviation of 2% for the AAA algorithm. The algorithm slightly underestimated the dose for MLC shaped and asymmetric fields. The PBC algorithm showed deviations below 1.5% for symmetric fields and below 3% for symmetric fields with wedges. Furthermore, the PBC algorithm had a small tendency to overestimate the dose for symmetric fields and asymmetric fields with wedges.
The relative difference between measured and calculated values for a 20×20 cm2 field with a 60o wedge after the optimization is shown in . Before the adjustment of the wedge parameters, the differences between measured and calculated doses in wedged fields was op to 5% and the AAA algorithm had a tendency to underestimate the dose. After the adjustment the differences were generally below 3%, except at low doses (<0.4 Gy). AAA however, still had a small tendency to overestimate the dose in the high dose end and underestimates the dose in the low dose end. The results for all the other symmetric fields with wedges were similar to or better than the one presented in . For the PBC algorithm the maximum deviation for symmetric fields with wedges was below 3% for 6 MV photons and below 4% for 15 MV. The central deviation was up to 3.5% for 15 MV.
Figure 1. Relative differences between measured and calculated values for a wedged field of 60o and 20×20 cm2 after the optimization. The dose at the isocentre is 1 Gy. The high dose end of the wedge is to the left in the figure and the low dose end to the right. The relative deviation were calculated as (measured-calculated)/measured.
AAA calculated the doses more correctly with 15 MV than with 6 MV, for the asymmetric fields with wedges. The deviations of the planar dose distributions for 15 MV fulfilled the gamma criterion except in the penumbra region and at very low doses. For 6 MV the gamma criterion failed even in the centre of the fields and the deviation could reach 5%. Moreover, in the main part of the fields, AAA underestimated the dose at 6 MV. The PBC algorithm had a maximum deviation of 3% for asymmetric fields with wedges.
Generally, the gamma criterion was fulfilled for the static patient specific fields for AAA. Here it is also worth mentioning that the maximum deviation of small (3×3 cm2) asymmetric fields was below 2.5%. For the IMRT fields the majority of the points passed the gamma criterion and the largest discrepancy was 4%. IMRT fields are very modulated which means that even a small discrepancy in the alignment of the phantom could cause some considerable deviations.
Heterogeneous media and lungs
For the film measurements of all the treatment plans, more than 80% of the points calculated with AAA in the high dose regions met the gamma criterion. It failed at low doses (<0.1 Gy) and at gradients, where AAA over- and underestimated the dose, respectively. For PBC the gamma criterion was only fulfilled for 30–70% of the points in the high dose region depending on the field configuration in the treatment plan and on the energy.
The two set of data from the film measurements and the point dose measurements were consistent within 3%. Half of the point dose measurements were within 2% of the dose measured with the films.
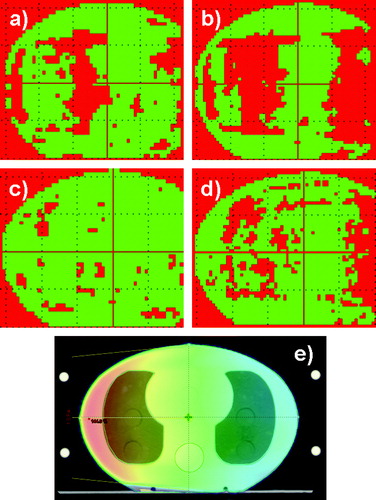
The dose distribution in the transverse section at the isocentre for one lateral field is shown in . Likewise, the gamma evaluation for both energies and algorithms are shown. For AAA at 15 MV more than 80% of the points fulfilled the gamma criterion. For AAA at 6 MV it was only 60%. In the mediastinum, AAA overestimated the dose by 5–7%. In the tissue before the first lung media is reached by the radiation, AAA underestimated the dose by 5–7%. Compared to PBC the results for the lungs (6–10% overestimation) were improved by AAA, whereas the results for the mediastinum were similar.
Figure 2. One lateral field from the left. The slice in the isocentre was selected. a) 2D dose distribution calculated with AAA at 6 MV. In the mediastinum the dose is 5–7% too high, to the left the dose is 5–7% too low. b) Calculated with PBC at 6 MV. In the lungs the dose is up to 10% too high. c) Calculated with AAA at 15 MV. d) Calculated with PBC at 15 MV. At the lungs the dose is 6–7% too high. e) The field configuration and the dose colour wash are shown for 6 MV. The dose colour wash is displayed in percents.The red colour is an indication of the areas where the gamma criteria of 3% in dose and 3 mm in DTA were not fulfilled. The green areas represent the regions where the criteria were fulfilled.
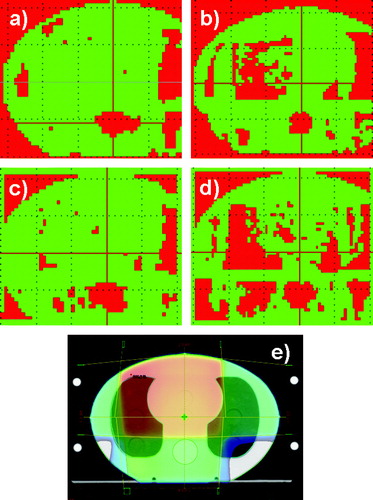
The gamma evaluation of a four field box technique is shown in . For AAA at 15 MV 80% of the points fulfilled the gamma criterion. The majority of the points which failed the criterion were located in the spinal cord. Here AAA underestimated the dose by 7%. Moreover, the gamma criterion failed for a small part of the right lung. The results were very similar for 6 MV apart from the right lung in which a bigger area did not fulfill the criteria. The PBC algorithm failed both in the spinal cord and in the lungs. At the spinal cord, PBC calculated 5–7% too low a dose, whereas in the lungs it calculated 6–14% too high a dose for both energies.
Figure 3. Four field box technique. The slice in the isocentre was selected. a) 2D dose distribution calculated with AAA at 6 MV. At the spinal cord the dose is 7% too low. b) Calculated with PBC at 6 MV. At the spinal cord the dose is 5–7% too low, at the lungs 6–14% too high dose. c) Calculated with AAA at 15 MV. At the spinal cord the dose is 7% too low. d) Calculated with PBC at 15 MV. At the spinal cord the dose is 6–7% too low, at the lungs the dose is 6–14% too high. e) The field configuration and the dose colour wash are shown for 6 MV. The dose colour wash is displayed in percents.The red colour is an indication of the areas where the gamma criteria of 3% in dose and 3 mm in DTA were not fulfilled. The green areas represent the regions where the criteria were fulfilled.
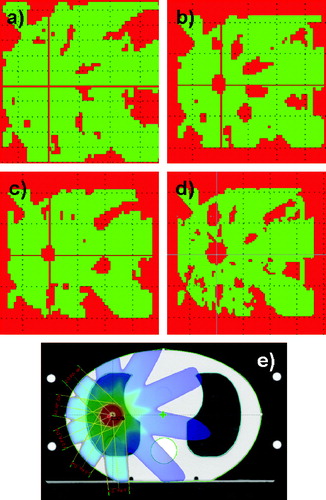
The gamma analysis of the SBRT plans is shown in . The results for AAA at 6 MV were below the criterion of 3%. At 15 MV, AAA overestimated the dose in the high dose regions by 9%. PBC overestimated the dose in the high dose regions by 17% for 6 MV and by 32% for 15 MV.
Figure 4. Five field SBRT treatment plan. The slice in the isocentre was selected. a) 2D dose distribution calculated with AAA at 6 MV. b) Calculated with PBC at 6 MV. In the isocentre the dose is up to 17% too high. c) Calculated with AAA at 15 MV. In the isocentre the dose is 9% too high. d) Calculated with PBC at 15 MV. In the isocentre the dose is 32% too high. e) The field configuration and the dose colour wash are shown for 6 MV. The dose colour wash is displayed in percents.The red colour is an indication of the areas where the gamma criteria of 3% in dose and 3 mm in DTA were not fulfilled. The green areas represent the regions where the criteria were fulfilled.
We have only shown the results for a few treatment plans. The treatment plans tested, included wedges, asymmetric fields and IMRT fields. The results of all the treatment plans, except the SBRT plans may be summarized as follows: For the AAA algorithm, nearly all of the points in the lung tissue fulfils the gamma criterion. The results for 15 MV being superior to those of 6 MV. For the PBC algorithm, huge areas failed the gamma criterion, and overestimations of dose by up to 7% were seen for both energies. The results in the mediastinum were very similar for the two algorithms and most of the points fulfil the gamma criterion for the majority of the treatment plans.
Generally AAA underestimated or calculated the correct dose to the spinal cord. For the worst case AAA underestimated the dose by 7%. The PBC algorithm overestimated the dose to the spinal cord by up to 5% for 6 MV, and underestimated the dose up to 4% for 15 MV. For some treatment plans the correct dose to the spinal cord was calculated by PBC.
When an identical dose to the tumour was prescribed, AAA generally delivered more MU than PBC. For lung tumours including madiastinal lymph nodes, the increment in MUs was 4–7%. However, for small lung tumours (∼3 cm in diameter) treated with SBRT, the increment was up to 20%. The value depends strongly on the field configuration and the amount of lung tissue irradiated. In the homogeneous tissue, the number of additional MUs was between 0–3%.
Discussion
This study has shown that the AAA algorithm is superior to the PBC algorithm in heterogeneous media and that in homogeneous media, the AAA algorithm agrees within a few percent with measurements.
In the basic study of AAA Fogliata et al. Citation[11], deviations below 2% at the central axis were reported for open symmetric and asymmetric fields. For these simple fields, we do also find deviations below 2%. For the wedged fields, we found deviations up to 3% in the 2D dose distribution, in accordance to the findings of Caprile et al. Citation[18]. Finally, Van Esch et al. Citation[12] found deviations below 1.5 and 3% for asymmetric wedged fields and IMRT fields, respectively. We saw deviations up to 5% with 6 MV for asymmetric wedged fields, and deviations below 3% for 15 MV. For the IMRT plans the maximum deviation was below 4%. Thus, our findings are supported by the results reported in Refs. Citation[11], Citation[12], Citation[18].
For inhomogeneous media, the AAA calculations corresponded well with the measurements, for both 6 and 15 MV photons. The AAA algorithm is superior to the PBC algorithm in heterogeneous media. These results are similar to the findings presented in Van Esch et al. and Bragg and Conway Citation[12], Citation[13]. Here deviations below 5% are reported in the mediastinum and in the lungs, in accordance to our findings.
Generally the results in the lung tissue for the AAA algorithm fulfilled the gamma criterion. The agreements between measured and calculated values were noticeably better for 15 MV than for 6 MV. This is in contrast to the results for the PBC algorithm where the deviations in the lung region could be up to 7%, and the agreements between measured and calculated values were better for 6 MV than for 15 MV.
The dose calculation in the AAA model is split into a depth dependent component and a lateral scatter component Citation[10]. The first part considers the photon interactions along the incident beamlet. The second part models the lateral dose scattering due to photons and electrons in a plane perpendicular to the beamlet. The improvement in calculation accuracy for 15 MV compared to 6 MV photons is due to the fact that the AAA algorithm calculates forward scattering of high energy photons better than divergent scattering of low energy photons.
Both algorithms were inaccurate in calculating the dose to the spinal cord. The AAA algorithm underestimated the dose by up to 7% for some of the treatment plans and calculated the correct dose for only 33% of the treatment plans. The PBC algorithm overestimated the dose for some plans by up to 5% and underestimated it by up to 4% for others. If the absorbed dose to medulla spinalis is higher than the expected value it may cause paralysis. Therefore, caution should be obtained when doses calculated by AAA are evaluated in the spinal cord. In a study of Bragg and Conway Citation[13] an identical CIRS thorax phantom was irradiated by two opposing anterior-posterior fields. They found that AAA underestimated the dose in the spinal cord by 1%. This is in accordance with our finding for two opposing anterior-posterior fields, where we found an underdosage of 3%. One other treatment plan was analysed in Ref. Citation[13] and it was found that AAA did underestimate the dose by 3%. No similar plan was tested in this study.
The SBRT treatment plan consisted of five fields of field size 3×3 cm2, see e. Thus very narrow fields are used unlike the setup for the other nine plans. The results found for the AAA algorithm, deviated from the other plans as AAA performed better for 6 MV than for 15 MV. The comparison of calculated and measured film data for 6 MV showed a difference below 3% in the high dose region, whereas at 15 MV the difference was up to 9%. For all other lung plans, AAA generally gave the best results in the lung region at the high energy. The huge difference in calculated and measured dose for 15 MV is due to the low density of lung tissue as the deviations of small fields in homogeneous media is generally below 3%. The PBC algorithm was inaccurate at calculating the correct dose distribution for a SBRT plan at both high and low energy.
Ding et al. Citation[14] found that the AAA calculations at 6 MV agreed very well with their measurements, whereas the calculations at high energy overestimated the dose delivered to the lung. They also found that PBC overestimated the dose in the lungs with up to 12–25%.
All tests in heterogeneous media were performed in the thorax phantom. The shape of this phantom is oval, meaning that different SSDs were tested. Likewise, the algorithm was tested for all depths in the range from d = 0 cm to d = 19 cm. A variety of field configurations were tested and for the majority of the treatment plans, the match between measured dose and calculated dose was satisfactory for AAA. This is in accordance to the findings in homogeneous media, where deviations were shown to be within a few percent.
Accurate dose calculation in heterogeneous tissue is of great importance for all treatment plans. If the calculation model is changed from PBC to AAA, the dose delivered to the lung tissue is determined more accurately. However, the change of algorithm will increase the number of MUs and therefore, the dose delivered to lung tumours will increase by 4–7% if the prescription of dose is unchanged. An even larger increase in dose (up to 20%) may be obtained for small (∼3 cm in diameter) lung tumours. Thus, it is important to decide if the dose prescription should remain unaltered. Alternatively the dose prescription could be lowered by approximately 5% in order to be able to use all the accumulated knowledge on the curability rate versus complication rate for a given dose level. However, this is not possible for small lung tumours as the difference in dose calculated by AAA and PBC depends strongly on the field configuration. Thus for SBRT treatments, the actual dose delivered to the patients varies considerably when the PBC algorithm is used. For the spinal cord, the difference in dose calculated by AAA and PBC may be up to 7%. This demands lowering the maximum tolerable dose to this organ.
In a forthcoming study, we will analyse the impact of changing from PBC to AAA on the dose volume histograms of organs at risk. The treatment plans of a cohort of lung cancer patients will be calculated by both algorithms and the dose to all organs will be compared. Hereby, it will be possible to adjust the constrains for the organs at risk. Furthermore, measurements in a head and neck phantom are planned to evaluate the AAA algorithm in this region consisting of bone, muscle and air.
In conclusion the AAA algorithm has been shown to be superior to the PBC algorithm in heterogeneous media, especially for 15 MV. For most treatment plans the deviations in the lung and the mediastinum regions are below 3%. However, the algorithm may underestimate the dose to the spinal cord by up to 7%.
Acknowledgements
The authors acknowledge Ludvig Muren (Department of Medical Physics, Aarhus University Hospital, Denmark) for contributing to the preparation of the manuscript.
References
- International Commission on Radiation Units and Measurements (ICRU). Determination of absorbed dose in a patient irradiated by beams of X or gamma rays in radiotherapy procedures. ICRU Report 24. Washington (DC): ICRU; 1976. p 67.
- Engelsman M, Damen EMF, Koken PW, van't Veld AA, van Ingen KM, Mijnheer BJ. Impact of simple tissue inhomogeniety correction algorithms on conformal radiotherapy of lung tumours. Radiother Oncol 2001; 60: 299–309
- Knöös T, Wieslander E, Cozzi L, Brink C, Fogliata A, Albers D, et al. Comparison of dose calculation algorithms for treatment planning in external photon beam therapy for clinical situations. Phys Med Biol 2006; 51: 5785–807
- Fogliata A, Vanetti E, Albers D, Brink C, Clivio A, Knöös T, et al. On the dosimetric behaviour of photon dose calculation algorithms in the presence of simple geometric heterogeneities: Comparison with Monte Carlo calculations. Phys Med Biol 2007; 52: 1363–85
- Fogliata A, Nicolini G, Vanetti E, Clivio A, Winkler P, Cozzi L. The impact of photon dose calculation algorithms on expected dose distributions in lungs under different respiratory phases. Phys Med Biol 2008; 53: 2375–90
- Polednik M, Madyan YA, Schneider F, Wolff D, Bannach B, Lambrecht U, et al. Evaluation of calculation algorithms implemented in different commercial planning systems on an anthropomorphic breast phantom using film dosimetry. Strahlenther. Onkol 2007; 12: 667–72
- Ulmer W, Harder D. A triple Gaussian pencil beam model for photon beam treatment planning. Z Med Phys 1995; 5: 25–30
- Ulmer W, Harder D. Applications of a triple Gaussian pencil beam model for photon beam treatment planning. Z Med Phys 1996; 6: 68–74
- Ulmer W, Pyyry J, Waissl W. A 3D photon superposition/convolution algorithm and its foundation on results of Monte Carlo calculations. Phys Med Biol 2005; 50: 1767–90
- Sievinen J, Ulmer W, Kaissl W. AAA photon dose calculation model in EclipseTM, Varian Medical Systems, 2004. ( The white paper).
- Fogliata A, Nicolini G, Vanetti E, Clivio A, Cozzi L. Dosimetric validation of the anisotropic analytical algorithm for photon dose calculation: Fundamental characterization in water. Phys Med Biol 2006; 51: 1421–38
- Van Esch A, Tillikainen L, Pyykkonen J, Tenhunen M, Helminen H, Siljamäki S, et al. Testing of the analytical anisotropic algorithm for photon dose calculation. Med Phys 2006; 33: 4130–48
- Bragg CM, Conway J. Dosimetric verification of the anisotropic analytical algorithm for radiotherapy treatment planning. Radiother Oncol 2006; 81: 315–23
- Ding GX, Duggan DM, Lu B, Hallhan DE, Cmelak A, Malcolm A, et al. Impact of inhomogeneity corrections on dose coverage in the treatment of lung cancer using stereotactic body radiation therapy. Med Phys 2007; 34: 2985–94
- Storchi P, Woudstra E. Calculation of the absorbed dose distribution due to irregularly shaped photon beams using pencil beam kernels derived from basic beam data. Phys Med Biol 1996; 41: 637–56
- Storchi PRM, van Battum LJ, Woudstra E. Calculation of a pencil beam kernel from measured photon beam data. Phys Med Biol 1999; 44: 2917–28
- Storchi P, Woudstra E. Calculation models for determining the absorbed dose in water phantoms in off-axis planes of rectangular fields of open and wedged photon beams. Phys Med Biol 1995; 40: 511–27
- Caprile P, Venencia CD, Besa P. Comparison between measured and calculated dynamic wedge dose distributions using the anisotropic analytic algorithm and pencil-beam convolution. Med Phys 2007; 8: 47–54
- CIRS Tissue Simulation & Phantom Technology, www.cirsinc.com, Virginia: c2008 [sited 2008 May 14] Available from: www.cirsinc.com/002lfc_rad.html.
- Lynch BD, Kozelka J, Ranade MK, Li JG, Simon WE, Dempsey JF. Important considerations for radiochromic film dosimetry with flatbed CCD scanners and EBT Gafchromic® Film. Med Phys 2006; 33: 4551–6
- Paelinck L, De Neve W, De Wagter C. Precautions and strategies in using a commercial flatbed scanner for radiochromic film dosimetry. Phys Med Biol 2007; 52: 231–42
- International Specialty Products (ISP), www.ispcorp.com, New Jersey c2007 [sited 2008 may 14] Available from: http://online1.ispcorp.com/_layouts/Gafchromic/content/products/ebt/pdfs/EBTwhitepaper.pdf. Gafchromic® EBT self-developing film for radiotherapy dosimetry, ISP, 2007. ( The white paper).
- Low DA, Dempsey JF. Evaluation of the gamma dose distribution comparison method. Med Phys 2003; 30: 2455–64