Abstract
We present up to 45 years of cancer incidence data by occupational category for the Nordic populations. The study covers the 15 million people aged 30–64 years in the 1960, 1970, 1980/1981 and/or 1990 censuses in Denmark, Finland, Iceland, Norway and Sweden, and the 2.8 million incident cancer cases diagnosed in these people in a follow-up until about 2005. The study was undertaken as a cohort study with linkage of individual records based on the personal identity codes used in all the Nordic countries.
In the censuses, information on occupation for each person was provided through free text in self-administered questionnaires. The data were centrally coded and computerised in the statistical offices. For the present study, the original occupational codes were reclassified into 53 occupational categories and one group of economically inactive persons.
All Nordic countries have a nation-wide registration of incident cancer cases during the entire study period. For the present study the incident cancer cases were classified into 49 primary diagnostic categories. Some categories have been further divided according to sub-site or morphological type. The observed number of cancer cases in each group of persons defined by country, sex, age, period and occupation was compared with the expected number calculated from the stratum specific person years and the incidence rates for the national population. The result was presented as a standardised incidence ratio, SIR, defined as the observed number of cases divided by the expected number. For all cancers combined (excluding non-melanoma skin cancer), the study showed a wide variation among men from an SIR of 0.79 (95% confidence interval 0.66–0.95) in domestic assistants to 1.48 (1.43–1.54) in waiters. The occupations with the highest SIRs also included workers producing beverage and tobacco, seamen and chimney sweeps. Among women, the SIRs varied from 0.58 (0.37–0.87) in seafarers to 1.27 (1.19–1.35) in tobacco workers. Low SIRs were found for farmers, gardeners and teachers.
Our study was able to repeat most of the confirmed associations between occupations and cancers. It is known that almost all mesotheliomas are associated with asbestos exposure. Accordingly, plumbers, seamen and mechanics were the occupations with the highest risk in the present study. Mesothelioma was the cancer type showing the largest relative differences between the occupations. Outdoor workers such as fishermen, gardeners and farmers had the highest risk of lip cancer, while the lowest risk was found among indoor workers such as physicians and artistic workers.
Studies of nasal cancer have shown increased risks associated with exposure to wood dust, both for those in furniture making and for those exposed exclusively to soft wood like the majority of Nordic woodworkers. We observed an SIR of 1.84 (1.66–2.04) in male and 1.88 (0.90–3.46) in female woodworkers. For nasal adenocarcinoma, the SIR in males was as high as 5.50 (4.60–6.56).
Male waiters and tobacco workers had the highest risk of lung cancer, probably attributable to active and passive smoking. Miners and quarry workers also had a high risk, which might be related to their exposure to silica dust and radon daughters. Among women, tobacco workers and engine operators had a more than fourfold risk as compared with the lung cancer risk among farmers, gardeners and teachers. The occupational risk patterns were quite similar in all main histological subtypes of lung cancer.
Bladder cancer is considered as one of the cancer types most likely to be related to occupational carcinogens. Waiters had the highest risk of bladder cancer in men and tobacco workers in women, and the low-risk categories were the same ones as for lung cancer. All this can be accounted for by smoking. The second-highest SIRs were among chimney sweeps and hairdressers. Chimney sweeps are exposed to carcinogens such as polycyclic aromatic hydrocarbons from the chimney soot, and hairdressers’ work environment is also rich in chemical agents.
Exposure to the known hepatocarcinogens, the Hepatitis B virus and aflatoxin, is rare in the Nordic countries, and a large proportion of primary liver cancers can therefore be attributed to alcohol consumption. The highest risks of liver cancer were seen in occupational categories with easy access to alcohol at the work place or with cultural traditions of high alcohol consumption, such as waiters, cooks, beverage workers, journalists and seamen.
The risk of colon cancer has been related to sedentary work. The findings in the present study did not strongly indicate any protective role of physical activity. Colon cancer was one of the cancer types showing the smallest relative variation in incidence between occupational categories. The occupational variation in the risk of female breast cancer (the most common cancer type in the present series, 373 361 cases) was larger, and there was a tendency of physically demanding occupations to show SIRs below unity. Women in occupations which require a high level of education have, on average, a higher age at first child-birth and elevated breast cancer incidence. Women in occupational categories with the highest average number of children had markedly lower incidence. In male breast cancer (2 336 cases), which is not affected by the dominating reproductive factors, there was a suggestion of an increase in risk in occupations characterised by shift work. Night-shift work was recently classified as probably carcinogenic, with human evidence based on breast cancer research.
The most common cancer among men in the present cohort was prostate cancer (339 973 cases). Despite the huge number of cases, we were unable to demonstrate any occupation-related risks. The observed small occupational variation could be easily explained by varying PSA test frequency.
The Nordic countries are known for equity and free and equal access to health care for all citizens. The present study shows that the risk of cancer, even under these circumstances, is highly dependent on the person's position in the society. Direct occupational hazards seem to explain only a small percentage of the observed variation – but still a large number of cases – while indirect factors such as life style changes related to longer education and decreasing physical activity become more important.
This publication is the first one from the extensive Nordic Occupational Cancer (NOCCA) project. Subsequent studies will focus on associations between specific work-related factors and cancer diseases with the aim to identify exposure-response patterns. In addition to the cancer data demonstrated in the present publication, the NOCCA project produced Nordic Job Exposure Matrix (described in separate articles in this issue of Acta Oncologica) that transforms information about occupational title histories to quantitative estimates of specific exposures. The third essential component is methodological development related to analysis and interpretation of results based on averaged information of exposures and co-factors in the occupational categories.
| Abbreviations | ||
| CI | = | Confidence Interval |
| ICD | = | International Classification of Diseases |
| ICD-O | = | International Classification of Diseases for Oncology |
| ISCO | = | International Standard Classification of Occupation |
| NYK | = | Nordisk Yrkesklassifisering (Nordic Classification of Occupation) |
| PY | = | Person years |
| Obs | = | Observed number of cancer cases |
| SIR | = | Standardised Incidence Ratio |
| NHL | = | Non-Hodgkin's lymphoma |
Introduction
A study published in 1999 reported occupational cancer risk estimates in four Nordic countries based on data from the 1970 censuses in Denmark, Finland, Norway and Sweden, and a subsequent follow-up of cancer incidence of 20 years Citation[1]. Those data have been extensively used in both Nordic and international contexts, and there was an evident need to update and extend the results. In addition, a need has been expressed to develop analytic approaches to utilise the data, which is unique both in terms of size and accuracy, for tracing exposure-response associations between work-related variables and cancer. That was the reason to start the Nordic Occupational Cancer (NOCCA) project which aims at joining the Nordic data and researcher skills (http://www.cancerregistry.fi/eng/research/AID159.html). As the first output of the NOCCA project, we present here a study similar to the previous Nordic study Citation[1] but updated and extended in several dimensions.
Tabulation of cancer by occupational categories builds on tradition from the occupational mortality studies, and therefore also the term “occupational cancer” is often used in studies where the information on occupation and industry comes from the data collected for each citizen in a census. To ensure correspondence between numerator and denominator, these studies should preferably be based on linkage between individual census and cancer registration records. The use of unique personal identity codes given to all residents and systematically recorded in every register including personal data facilitates such a record linkage in the most accurate way. In the Nordic countries personal identity codes have been widely used since the 1960s for administrative purposes such as payment of salaries, taxation, bank accounts, social security, health insurance, hospitalisation, etc. The use of the personal identity codes is thus a part of daily life ensuring a high quality of the data. All five countries have computerised central population registers with daily updates on births, deaths, immigrations and emigrations.
The computerised registration of census data by personal identity codes started in Norway and Sweden in 1960, in Finland and Denmark in 1970, and in Iceland in 1981. Because central administrative registers also include much demographic information, the incentive to undertake traditional censuses has diminished by time. The detailed information on occupation and industry for each citizen is, however, difficult to obtain from routine registers. Denmark was the first country in the world to abolish traditional censuses. In the first register-based census in Denmark from 1981 the information on occupation came primarily from tax-forms, and 5% of the work force ended up being registered only as wage-earners without further information Citation[2]. The Danish part of the present study is therefore based solely on the 1970 census. Sweden kept the traditional censuses throughout the 20th century, and the present study includes data from the 1960, 1970, 1980, and 1990 censuses. In Finland, data from the 1960 census only exists in manual forms and could not be used, and in Norway the 1990 census included only a sample of the Norwegian population and was therefore excluded from the present study. Iceland has a long census tradition, but the only census available with computerised data is from 1981.
National cancer registration started in 1943 in Denmark, in 1953 in Finland and Norway, in 1955 in Iceland, and in 1958 in Sweden. The first linkage study of occupational cancer was based on the 1960 census from Sweden, with the creation of the so-called Cancer-Environment Register Citation[3]. A linkage has also been performed between the Swedish 1970 census and the cancer register Citation[4]. Comprehensive studies on occupational cancer based on data from the 1970 censuses have been published in Denmark Citation[5] and Finland Citation[6]. In Norway, studies for selected occupational categories have been undertaken based on the 1970 census Citation[7], Citation[8]. This is the first time the Icelandic census is used as a study base.
The standardisation of occupations for the present studies was facilitated by the previous Nordic collaborative projects on occupational cancer mortality Citation[9] and incidence Citation[1].
The occupational cancer study presented here includes 1) data from five Nordic countries, 2) data from up to four consecutive decennial censuses, 3) data for main cancer sites, as well as for several specific histological categories and subsites, and for a number of rare cancer sites seldom studied by occupation, and 4) data from a follow-up period of up to 45 years (1961–2005). The study cohort covers 15 million residents of Nordic countries, followed for a total of 385 million person years, and developing 2.8 million cancer cases during the follow-up. It thus constitutes the largest cohort study on occupational cancer incidence ever published.
This is the first publication to come out from the extensive study Nordic Occupational Cancer (NOCCA) project and should be considered as a base document for the numerous subsequent studies focusing on associations between specific work-related factors and well-defined cancer diseases with the aim to identify exposure-response patterns. In addition to the cancer data demonstrated in the present publication, the NOCCA project produces the Nordic Job Exposure Matrix (JEM) that transforms information of occupational title histories to quantitative estimates of specific exposures. The third essential component is methodological development targeted at better interpretation of results based on averaged information of exposures and co-factors in the occupational categories. The JEM work is described in a separate article in this issue of Acta Oncologica.
The Nordic countries
The Nordic countries comprise five states: Denmark, Finland, Iceland, Norway and Sweden, and three autonomous territories, the Faroe Islands, Greenland and Åland. The Faroe Islands and Greenland are both part of the kingdom of Denmark, but are not included in the present study. Åland is part of the republic of Finland, and is included in the Finnish data. Denmark, Norway and Sweden are monarchies whereas Finland and Iceland are republics.
The Nordic countries share a long history. Iceland came under the Norwegian king in 1262. The three kingdoms of Denmark, Norway and Sweden (including Finland), dating back to the 10–13th centuries, were united in the Kalmar Union in 1397. After Sweden had broken out in 1523, Denmark and Norway were in a political union, including also the Norwegian dependencies of Iceland, the Faroe Islands, and Greenland. This Dano-Norwegian union was dissolved in 1814. Norway then entered a union with Sweden, while Iceland, the Faroe Islands, and Greenland remained with Denmark. The Swedish-Norwegian union was dissolved in 1905. Finland, formerly constituting the eastern third of Sweden, in 1809 became an autonomous Grand Duchy within the Russian Empire, but declared its independence in 1917. Iceland was until 1944 part of the Danish monarchy. The Faroe Islands and Greenland are today autonomous provinces of Denmark with home rule. Denmark joined the European Union in 1973, Finland and Sweden in 1995. Iceland and Norway are not EU members.
In the Second World War (WWII), Norway and Finland were combat zones, while the other Nordic countries did not participate directly in the warfare. The living conditions in Norway and Finland were thus heavily affected by the war, whereas this was not the case to the same extent in the other countries. Norway and Denmark were occupied by the Germans. Finland fought the Winter War and the continuation war against the Soviet Union. Iceland was occupied by Great Britain in May of 1940 (a friendly occupation) but one year later made a defense agreement with USA. Sweden kept its neutrality.
The Nordic countries cover a total area of 3.5 million km2. If Greenland and the islands of Svalbard and Jan Mayen are excluded, the remaining part of the Nordic countries covers an area of 1.2 million km2. The northernmost parts of Norway, Finland, and Sweden are located north of the Arctic Circle, and thus experience winter without sunrise and midnight sun in summertime. This area is sparsely populated. Denmark and Finland are flat countries, whereas mountainous areas are found in the central and northern parts of Norway and in the northern part of Sweden. Iceland is a mountainous island situated in the North Atlantic with glaciers, volcanoes, and geothermal activity.
Climate
The climate in the Nordic countries is determined by two factors, their northern latitude and the existence of the Gulf Stream in the Atlantic Ocean. The climate is temperate but with variation between the southern and northern parts and between the coastal and inland areas. During winter, average temperatures are fairly low. The five capitals, Copenhagen, Helsinki, Reykjavik, Oslo, and Stockholm, are all located by the sea, which reduces the temperature variation () Citation[10].
Table 1. Mean temperature in five Nordic capitals in the years 1961–1990 Citation[10].
Annual exposure to carcinogenic UV light at sea level in the southernmost regions of the Nordic countries (southern Denmark, latitude 55°N) is about 30% and in the northernmost parts of the other Nordic countries (latitude about 70°N) approximately 20% of the respective exposure at equator Citation[11].
Population
The total population in the Nordic countries has doubled during the last hundred years, comprising 24.7 million in 2005 () Citation[12]. The population density varies from 127 per km2 in Denmark to 3 per km2, in Iceland. In Norway and Denmark around 30–40% and in Iceland more than 60% of the population live in the vicinity of the capital Citation[13].
Figure 1. Population in the Nordic countries in 1890–2005, in millions Citation[12].
![Figure 1. Population in the Nordic countries in 1890–2005, in millions Citation[12].](/cms/asset/9d96587d-c42b-4d27-97d6-b62163754f9a/ionc_a_391526_f0001_b.jpg)
Figure 2. Number of immigrants to the Nordic countries Citation[13].
![Figure 2. Number of immigrants to the Nordic countries Citation[13].](/cms/asset/9c3c7b1d-5a89-4b30-b255-a63f66202400/ionc_a_391526_f0002_b.jpg)
The population in the Nordic countries is getting older, partly due to the fact that the death rate has fallen for almost all age groups and partly because the number of births has been low over the past 30 years. As of the year 2005, the percentage of 80 years or older was highest (over 5%) in Sweden. The fertility rate has fallen in all the Nordic countries but is still relatively high compared to most industrialised countries Citation[14]. From 1970 to 2004, the fertility rate among women 15–49 years in Denmark decreased from 1.95 to 1.78; in Finland from 1.83 to 1.80; in Iceland from 2.81 to 2.04; in Norway from 2.50 to 1.83; and in Sweden from 1.92 to 1.75.
A great majority of people in the five Nordic countries are Caucasian. Following WWII Sweden experienced labour immigration from Central and Western European countries, in addition to immigration from the other Nordic countries. From 1954 there has been a completely common labour market between the Nordic countries. However, apart from a substantial movement from Finland to Sweden, this did not significantly influence the labour markets in the individual countries. Labour immigration from Southern Europe and outside Europe started in Sweden from the early 1960s, and came to Denmark and Norway by the late 1960s. From the early 1970s immigration from countries outside the Nordic common market was stopped, only allowing family reunions. By joining the European Union Denmark in 1973 and Sweden and Finland in 1995 became part of the joint European labour market. In general, labour immigration has been mainly from Western countries, while refugee and family related immigration has been mainly from non-Western countries Citation[15].
Culture
The Danish, Icelandic, Norwegian and Swedish languages are of the same origin whereas Finnish belongs to an entirely different language family. About 6% of the Finnish population have Swedish as their mother tongue, and both Finnish and Swedish are official languages in Finland. The Sami people are indigenous people living in the northern parts of Finland, Norway, Sweden and Russia. They speak Sami languages.
Elementary schools have been compulsory in all Nordic countries for more than a century. In Denmark, schooling has been compulsory since 1814. In Sweden, six years of schooling was made mandatory in 1882, in Norway, seven years has been mandatory since 1889. Today, 9–10 years of schooling is compulsory in all countries, after which most students will pursue some form of further training. The number of students finishing higher education increased very much during the second half of the 20th century. In Denmark, Norway and Sweden, 13% and in Finland 8% of men aged 35–54 years in 1970, had 13 or more years of education. The respective proportions for women were 10% in Sweden; 7% in Finland; 6% in Norway and 5% in Denmark Citation[16]. In Iceland 15% of all 20-year-olds passed the matriculation examination in the school year 1970/1971, whereas 29% and 45% passed this examination in the years 1980/1981 and 1989/1990, respectively Citation[17]. The percentage of people with a tertiary level education according to the International Standard Classification of Education, which typically begins at the end of full time compulsory education, varied in 2003–2004 from 20% in Denmark to 26% in Finland among persons between the ages of 15 and 74. In the five countries, more women than men now have the highest level of education in the population of those aged 25–74, and more women are enrolled in high-level education institutions than men Citation[13]. The number of doctoral and licentiate degrees awarded each year is growing fast. In 1990 the total number of doctoral degrees awarded in the Nordic countries was about 3 400, but in 2002 the number exceeded 7 100 Citation[18].
In all five Nordic countries a vast majority of the population are Lutherans. In Finland, the Orthodox church (1% of the population) also has the status of state church. However, full freedom of religion is granted by the constitutions of the five countries. The extent to which religion plays a role in daily life varies between groups and regions, but has in general been decreasing by time. The Nordic countries are now confronting new challenges with immigrants that are followers of various religions Citation[19].
Industry
Agriculture is still important in most Nordic countries, although its economic significance has declined in parallel with the increase of the service sector, as has been the case in most other European countries. In Denmark and Finland, more than half of the arable land is used for grain production, in Denmark 65%, in Finland 55% but in Sweden 42%. Iceland, being mountainous and volcanic has scarce arable land. The main agricultural activity in Iceland is sheep farming and dairy production. The importance of forestry and paper production is illustrated by the fact that more than half of the area in Sweden and Finland, and one fourth of the area in Norway are covered by forest. Forestry is still a major industry in Finland and Sweden and to a lesser extent in Norway. Fishing has for a long time been an important industry in Norway and in Iceland and still is, especially in certain regions. Oil production by the Norwegians in the North Sea started on a larger scale in the mid 1970s.
Hydro- and geothermal power are major sources of energy in the Nordic countries, as compared to other OECD countries. In Iceland and Norway hydro-geothermal power constitute a major share of the overall energy supply, whereas Denmark depends almost entirely on thermal power generated from coal, oil and gas. Iceland depends almost entirely upon hydropower resources for its production of electricity. Nuclear power is Sweden's most important source of energy, in Finland it provides 18% of the energy supply. With their oil fields in the North Sea, Denmark and especially Norway have a very large production of oil and gas Citation[13]. Iron mining has been important in Sweden and to a lesser extent in Norway, where on the other hand, the cheap supply of energy has formed the basis for, e.g., the smelting of aluminium, both in Norway Citation[1] and in Iceland.
In agreement with the Kyoto Protocol, EU nations have agreed to cut the emission of carbon dioxide to 8% below the level in 1990. Emission of carbon dioxide varies across the Nordic countries () Citation[20]. In Denmark, Finland and Norway, the emission of greenhouse-gases in 2003 was still 7–8% above the 1990 level while the emission was lower in Sweden and especially in Iceland Citation[13].
Figure 3. CO2 emission in tons per capita in the Nordic countries in 2004 Citation[20].
![Figure 3. CO2 emission in tons per capita in the Nordic countries in 2004 Citation[20].](/cms/asset/c054009a-00ca-49de-bb5a-e4cc0b4f9ec9/ionc_a_391526_f0003_b.jpg)
Living conditions
The gross domestic product has increased in all Nordic countries and is among the highest in the world. The population of the Nordic countries is now largely urbanised. The share of one- and two-family houses out of the entire building stock is highest in Denmark (almost 60%) and Åland (almost 70%), lowest in Sweden with 45%. Norway and Iceland have the highest percentage of large dwellings with five rooms or more plus kitchen Citation[13]. Private ownership of dwellings is common.
In 1970 Sweden had the highest number per capita of cars (0.31), telephones (0.58) and televisions (0.32) in the Nordic countries. In Finland the numbers were only 0.19; 0.30 and 0.24 Citation[21]. In 2005 Iceland had the highest density of private cars with 0.60 cars per capita, followed by Sweden with 0.46, Finland 0.45, Norway 0.43, and Denmark 0.35 per capita Citation[13].
Along with the Netherlands, the Nordic countries rank with the highest digital literacy as reflected by the percentage of individuals aged 16 to 74 using the internet regularly Citation[22]. The proportion of households in 2005 with access to internet was 75% in Denmark, 54% in Finland, 84% in Iceland, 64% in Norway, and 73% in Sweden Citation[14]. The Nordic populations were the first ones to adapt large scale use of mobile phones.
Food consumption
Across the Nordic countries, there were important differences in the average consumption of the main food components in 1970 Citation[23]. The average milk consumption in Finland was 263 kg per person per year whereas the consumption in the other countries varied from 172 to 193 kg per person. Denmark had a high consumption of meat and offals with 84 kg per person, or close to a quarter of a kilogram per person per day. The consumption of meat and offals in the other countries was between 43 and 56 kg per person. Fish consumption was highest in Norway (40 kg per person) and lowest in Finland (13 kg per person). The consumption of vegetables, fruit and berries in Sweden in 1970 was 122 kg per person, twice as much as in Finland, with the consumption in Denmark and Norway being in between.
In parallel with the economic development, dietary habits have changed in all Nordic countries. The consumption of fat and sugar has increased, while the consumption of food items rich in carbohydrate has decreased Citation[24]. The consumption of low-fat milk and margarine has increased, while the total fat consumption has decreased. There has been a gradual increase in the consumption of fruit and vegetables in all countries. Consumption of potatoes was high in all countries in 1970, ranging from 73 to 89 kg per person Citation[23]. Except for in Sweden, consumption of potatoes has decreased in later decades Citation[24]. Until the 1980s meat consumption increased, but has, except for in Denmark, been stable since then. The lowest consumption of meat has continuously been in Norway, where in 1990 the mean intake per inhabitant was 54 kg, and highest in Denmark, with 105 kg per inhabitant () Citation[25]. Overall dietary fat intake has decreased in Finland, Norway, and Sweden, but not in Denmark Citation[24].
Table 2. Food consumption (kg per person) in 1990 in the Nordic countries Citation[25].
In 2005, Denmark was the Nordic record holder of the consumption of beef and veal (28 kg per person in 1970) pork (58 kg), poultry (23 kg), and cheese (24 kg) Citation[13]. Consumption of lamb and sheep was the highest in Iceland (23 kg per person). Icelanders and Norwegians consumed by far more fish than the other Nordic people, while the Icelanders accounted for the lowest consumption of vegetables.
Alcohol consumption
The average consumption of alcohol has varied over time and between countries () Citation[26]. A general increase has been seen in all countries except Denmark in the later years.
Figure 4. Alcohol consumption in litres of pure alcohol in the Nordic countries Citation[26].
![Figure 4. Alcohol consumption in litres of pure alcohol in the Nordic countries Citation[26].](/cms/asset/a76a3885-2aa7-4247-a9e3-0597d4f37284/ionc_a_391526_f0004_b.jpg)
The proportion of abstainers among adult men in 1985 ranged from 3% in Denmark to 23% in Sweden, whereas the proportions of abstainers among adult women ranged from 7% in Denmark to 37% in Sweden Citation[27] ().
Figure 5. Drinking habits in 1965 and 1985 in the Nordic countries. By gender Citation[27].
![Figure 5. Drinking habits in 1965 and 1985 in the Nordic countries. By gender Citation[27].](/cms/asset/7c4297ba-49f6-4926-b729-6ea895953ea3/ionc_a_391526_f0005_b.jpg)
Tobacco use
Tobacco consumption in Denmark was higher than in the other Nordic countries already in 1920 Citation[28]. In 1970 on average 68% of men and 47% of women in Denmark were smokers Citation[29]. The numbers were 54% for men and 37% for women in Norway in 1973–1977 Citation[30]. In Sweden, about 56% of men smoked in 1968, whereas the proportion of smokers in women varied from 46% in the 15–24 years old to 17% in the 55–64 years old Citation[31]. In Finland, practically all tobacco consumption until the early 1960s was attributable to men; thereafter the prevalence of smokers among men was halved to about 30% and among women increased to about 30% Citation[32].
Smoking has decreased in all Nordic countries during the last decades () but direct comparison between the Nordic countries is somewhat difficult as the age-span in the official statistics varies from 13+ in Denmark, 15–64 in Finland, 15–79 in Iceland, 16–74 in Norway and 16–84 in Sweden Citation[13].
Figure 6. Proportion of daily smokers in the Nordic countries. Men and women Citation[14].
![Figure 6. Proportion of daily smokers in the Nordic countries. Men and women Citation[14].](/cms/asset/4496275c-f765-4dd5-b636-4d37252a8715/ionc_a_391526_f0006_b.jpg)
Both in 1965 and 1985, there were more male than female ever smokers, and the proportion among men decreased consistently over time () Citation[33]. Among women the proportion of ever smokers remained largely unchanged over the period 1965–1985. The percentage of smokers declines with the educational level in all the Nordic countries Citation[34].
Figure 7. Smoking habits in 1965 and 1985 in the Nordic countries. By gender Citation[33].
![Figure 7. Smoking habits in 1965 and 1985 in the Nordic countries. By gender Citation[33].](/cms/asset/f8475bd0-682f-4a77-a648-179e378109e3/ionc_a_391526_f0007_b.jpg)
In Sweden, snuff-taking has for a long time been more common than in the other Nordic countries. Until 1995 it was almost exclusively men who took snuff, but in recent years women have also started to do so. In 2004–2005 27% of men (16–84 years) and 5% of women in Sweden took snuff Citation[35]. The proportion of snuff-takers has increased in Sweden by 6% since the end of the 1980s until 2004–2005. In Norway snuff-taking is a new habit, introduced during the 1990s parallel with the decreasing smoking prevalence. In 2005 14% of Norwegian men aged 16–24 years and 10% of men aged 25–44 years used snuff on a regular basis Citation[36]. The respective proportions among women were 4% and 2%.
Health and health care
Life expectancy in the five Nordic countries is among the highest in the world and has risen during the last decades ().
Table 3. Life expectancy at birth (in years) in the Nordic countries 1960 and 2005 Citation[14].
Finnish women and men have, in the period between 1960 and 2005, on average gained about 10 years in life expectancy, and all other Nordic populations 5 to 9 years. Icelandic men could expect to live longer than any other men included in OECD statistics in 2005. The differences in life expectancy between the Nordic countries are mostly due to mortality differences in adult life. Infant mortality in the Nordic countries is low () Citation[37].
Figure 8. Infant mortality per 1 000 live births in the Nordic countries in 1960–2004 Citation[37].
![Figure 8. Infant mortality per 1 000 live births in the Nordic countries in 1960–2004 Citation[37].](/cms/asset/9712fe8a-af88-4e99-9f5a-5810aa4c7611/ionc_a_391526_f0008_b.jpg)
In the Nordic countries, the health service is financed through taxes or through compulsory health insurance schemes to a large extent. There are well-established primary health care systems and well-developed hospital services. Employees on sick leave either receive their salary or are compensated by special cash allowances. The self-employed ensure themselves.
In all of the Nordic countries social assistance is granted if all other support options have been exhausted and all citizens are guaranteed a certain level of income at retirement and disability Citation[13].
Occupational history of the study population
The population included in the present study was born between 1896 and 1960 (see Materials and methods). People in the oldest birth cohorts typically started working around the age of 15, in the period between 1910 and 1920. Due to the increasing duration of education, many persons in the youngest birth cohorts started their working careers around the age of 25 or even higher. The normal time for retirement in the Nordic countries has been between 65 and 70 years. Thus, persons included in this study have participated in the labour market from the years before World War I until after the turn of the millennium, covering a period of enormous changes in the types of economic activities and the structure of the labour force in the Nordic countries, as well as in living and working conditions.
One of the main changes has been the decline in the proportion of the population working in agriculture, forestry, hunting and fishing. In 1900 the labour force in all the Nordic countries was largely working in the agricultural sector. The reduction of workers in agriculture came latest to Finland. As much as 63% of Finnish men worked in agriculture in 1930, a much larger proportion than in the other countries. In 1960 the proportion of persons (men and women combined) in agriculture were 18% in Denmark, 36% in Finland, 22% in Iceland, 20% in Norway, and 14% in Sweden (a) Citation[12], Citation[38], Citation[39]. Around 2005, only 2–6% in each country were occupied in the primary sector. Still, meat and dairy products in Denmark and fish and fish products in Iceland and Norway have remained important export products.
Figure 9. Proportion of work force by sector in the Nordic countries, both genders combined Citation[12],Citation[38],Citation[39].
![Figure 9. Proportion of work force by sector in the Nordic countries, both genders combined Citation[12],Citation[38],Citation[39].](/cms/asset/120ef697-b0a3-4fc9-a1f4-57a10ec9e062/ionc_a_391526_f0009_b.jpg)
Around 1900, only 11% of the labour force in Finland was employed in the industrial sector, compared to 26% in Norway and 29% in Sweden. In pre-WWII Denmark, small scale industrial enterprises producing for the home market were common. Industrial development related to, e.g., steel, copper, and timber came earliest to Sweden. Following the war, Sweden also had the advantage of an intact industrial base and its natural resources in the expansion of its industry. In Finland, there was rapid growth specifically in the metal industry after WWII due to peace requirements after the war.
Cheap hydro-electric power formed the basis for the early development of large industries in Norway (e.g. aluminium and fertilizer industry). In Norway, the maximum proportion of employees in the industrial sector (29%) was in 1970 (b). From the 1970s on, economic growth in Norway has largely been based on the production of North Sea oil, but only a small proportion of the labour force is directly engaged in this. The substantial economic growth in the post war period in Iceland was driven mainly by industrialisation of the fishing sector. Around 2005, 3% of the labour force was employed in fishing.
The tertiary sector includes public and private service work as well as wholesale and retail trade, restaurants and hotels, finance, insurance, real estate and business service. In all Nordic countries, employment in the tertiary sector has increased from comprising 15–20% of the labour force in 1960 to 30–40% in 2005 (c).
Another important change from the 1960s was the increasing labour market participation of women () Citation[40]. The activity rates have been increasing steadily in all Nordic countries up to 73–84% in 2005, i.e., not much lower than among the men. These major changes seen from 1960 to 1980 coincided with the growth of the welfare states, urbanisation, a decrease in the agricultural sector and a growing service sector. The growth of the female labour force participation came later in Iceland and Norway than in Denmark and Sweden, while the level was high in Finland already in 1960.
Figure 10. Percentage of economically active women in the Nordic countries Citation[40].
![Figure 10. Percentage of economically active women in the Nordic countries Citation[40].](/cms/asset/da666d64-8702-4d85-80af-2a4971e83865/ionc_a_391526_f0010_b.jpg)
Material and methods
Study population
The study base consists of persons participating in any computerised population census in the Nordic countries in 1990 or earlier (). In Denmark, the 1970 census took place on November 9. In Finland the 1970, 1980 and 1990 censuses took place on December 31 of the census year. In Iceland the census took place on January 31, 1981. In Norway the 1960, 1970 and 1980 censuses took place on November 1. In Sweden the 1960, 1970, and 1990 censuses took place on November 1, while the 1980 census took place on September 15. The study cohort included people aged 30–64 years still alive and living in the country on January 1 in the year following the census. The cohort includes 14.9 million persons: 2.0 million from Denmark, 3.4 million from Finland, 0.1 million from Iceland, 2.6 million from Norway and 6.8 million from Sweden.
Figure 11. Time windows of follow-up of the study cohort defined by year of birth and age, by country. Bold vertical lines indicate time of baseline census used for allocation of the occupational category.
In the Icelandic census of 1981 it was compulsory for all individuals born 1964 or before to fill out the self-administered questionnaire on personal questions. In the other countries, the heads of households had to fill out self-administered questionnaires for all members of the household and for the dwelling.
A system of giving unique personal identity codes to all residents was introduced in Sweden in 1947, in Iceland in 1953, in Norway in 1964 (but including all persons alive in 1960), in Finland in 1967, and in Denmark in 1968. This personal identity code, name, address, marital status, education, economic activity, occupation, and industry were recorded for each person. All questionnaires were centrally coded and computerised in the national statistical offices.
Economic activity
In Denmark all persons who were gainfully employed at the time of the census or were temporarily absent from work due to illness, unemployment, vacation, or military service were classified as economically active. A fairly similar definition was used in Sweden.
In Finland, only people who at the time of the census were gainfully employed for at least half of the industry's normal working hours or were temporarily absent were considered economically active. In Iceland, those who were gainfully employed the week before the day of the census, January 31, 1981 or were temporarily absent from work due to illness or vacation that week, were classified as economically active.
In Norway, only persons who reported at least 100 hours of gainful employment during the last 12 months before the census or were temporarily absent were classified as economically active in the censuses of 1970 and 1980. In 1960, no specific requirement was set for the number of working hours, and occupational activity was defined only as having a main occupation. In addition, the work of married women in family businesses, e.g., in farming, was not counted as occupational activity. This has been suggested to account for about 29 000 women Citation[41].
Occupation
The basis of the coding of occupations was free text information on education, occupation, industry, and name and address of employer at the time of the census. In Finland, Norway and Sweden, occupation was coded according to national adaptations of the Nordic Occupational Classification, usually abbreviated to NYK Citation[42]. NYK is a Nordic adaptation of the International Standard Classification of Occupations (ISCO) from 1958 Citation[43]. The first digit of NYK, as well as ISCO 1958 codes, indicates major occupational categories, two digits level about 70 minor occupational categories, and three digits level more than 300 specific occupations. The national code values may differ, but the coding principle is similar in Finland, Norway and Sweden.
Occupation was coded in Iceland according to a national adaptation of ISCO-68 Citation[44]. For the present study, a conversion was made to ISCO-58 by instructions from the International Labour Organisation given in the ISCO 1968 manual.
In Denmark, occupation was coded according to a special national nomenclature with a distinction between self-employed persons, family workers, salaried employees, skilled workers, and unskilled workers – a total of 218 codes were possible. Entities similar to those used in NYK were formed by combining these occupational codes with the 245 codes for industry.
For the present study, the original national occupation codes were converted to a common classification with 53 relatively specific, but not too small, occupational categories, and an additional category of economically inactive persons (Appendix 1, available in the online version of the journal. Please find this material with the direct link to the article: http://www.informaworld.com/10.1080/02841860902913546). Descriptions of work included in each of the categories are provided in Appendix 2.
The numbers of persons in the study by gender, country and occupational category are shown in Appendix 3.
Follow-up for cancer incidence
A person entered the cohort on January 1 of the year after the first available census where s/he participated, provided that s/he was 30–64 years old. Person-years were then counted until the date of emigration, death or to December 31 of the following years: in Denmark 2003, in Finland 2005, in Iceland 2004, in Norway 2003, and in Sweden 2005 (). The source of the data on dates of death and emigration in all countries was the Central Population Register. The numbers of person years by sex, country and occupational category are shown in Appendix 4.
The cancer registration in Denmark is based on notifications from clinical hospital departments, supplemented with notifications from practising specialists in dermatology and gynaecology, and with autopsy reports from pathology departments. Throughout the period, the notifications were supplemented with information on cancer cases reported on death certificates. From 1988 onwards linkage was also made with the Hospital Discharge Register, and from 2002 onwards also with the Pathology Register. In 1971–1977 the cancer cases were coded according to an extended version of the International Classification on Diseases, version 7, (ICD-7) Citation[45], and from 1978 onwards according to the International Classification on Diseases for Oncology, version 1 (ICD-O-1) Citation[46].
Cancer registration in Finland started in 1953 and the reporting has been compulsory since 1961. Registration of new cases of cancer is based on reports from clinical and pathological departments, private clinics, general practitioners, and information from the causes of death registry. The incident cancer cases were coded for topography according to the ICD-7 Citation[45] and for morphology according to MOTNAC 1951 Citation[47], both nomenclatures extended to correspond to the practical new needs of classification.
In Iceland, cancer registration has from the start (1955) been based on information from all pathology laboratories in the country. This information is complemented by information from cytology and haematology laboratories, by notifications from hospitals and health centres and by death certificates. Topography was coded according to ICD-7 Citation[45] and morphology according to ICD-O-1 Citation[46].
Cancer registration in Norway has been based on compulsory reporting of new cases of cancer from clinical and pathological departments, private clinics, general practitioners and information from the causes of death registry since 1953. The pathology reports provide histological, cytological or autopsy information. Since 1998, the Patient Administrative Data (PAD) system in hospitals has been used as an additional source of information. Cancer cases diagnosed before 1993 are coded according to ICD-7. From 1993 ICD-O-2 has been used, with a semi-automatic conversion back to ICD-7 codes, which have been used in the classification of cancer in the present study. MOTNAC was used for the coding of morphology until 1993, but was then replaced by ICD-O-2.
The cancer registration in Sweden in 1958–1982 was based on reports from hospital clinicians and from hospital pathologists. Private practitioners have been required to report cancer cases since 1983. Notifications were collected and centrally coded in Stockholm until 1984, when the coding was fully decentralised to the six oncology centres (founded during the period 1976 to 1984) The coding is done simultaneously in several versions; 1958 until now in ICD-7, 1987 until now in ICD-9, 1993 until now ICD-O-2, and 2005 until now in ICD-O-3. The histology has been coded with three digits according to the statistical codes for human tumours by the WHO from 1956 Citation[48]. Unlike the other Nordic countries, Sweden does not register cancer cases based on death certificate only, and does not trace back missing cases that could be identified via death certificates.
Combined cancer incidence
The cancer cases have been grouped into 49 main categories and 27 diagnostic sub groups based on the national topography and morphology coding systems (Appendix 5 and 6).
Minor differences have occurred over time and between countries in the definition and coding of multiple primary tumours. In the present study only the first incident cancer within a given diagnostic group of this particular type was included in the Danish and Icelandic data. In the tabulation of “All sites”, only the first cancer of any type diagnosed within a persons risk period was included in Denmark and the first cancer diagnosed within each diagnostic group in Iceland. This method creates slight incomparability of absolute risk estimates between Denmark and Iceland and the other Nordic countries, but has virtually no effect on relative risk estimates.
The incident cancer cases included in the present study involve all invasive cancers and also benign brain tumours. The non-melanoma skin cancers were excluded from the “All sites” category because basal cell carcinomas of the skin could not be separated from the group “Other skin cancers” (primarily squamous cell carcinomas) in the Danish data. Close to 3 million primary incident cancer cases are included in the present study; 570 000 from Denmark, 500 000 from Finland, 15 000 from Iceland, 560 000 from Norway, and 1.3 million from Sweden.
Standardised incidence ratio
The relative level of the cancer incidence of an occupational category is described by the standardised incidence ratio (SIR), with the cancer incidence rates for the entire national study populations used as reference rates. For each country, gender and occupational category, the observed number of cancer cases and person years were stratified into eight 5-year attained age categories; 30–34; 35–39; … , 85+ years; and 5-year calendar periods ().
For a given gender (g), the SIR for a given occupational category (o) in a given country (c) is then calculated as
where Obs = observed number of cancer cases; PY = person years; a = age; p = period. The denominator in the equation is the expected number of cancer cases for the given gender, occupational category and country. The SIR for the five countries together is calculated from the numerator and the denominator sums across the countries.
For each SIR the exact 95% confidence interval (CI) was defined assuming a Poisson distribution of the observed number of cases.
Method of presentation
The observed numbers of cancer cases and the SIRs for each Nordic country, and the respective information for the five countries combined together with the 95% confidence interval for the SIR are presented in tables for each diagnostic group and gender. Each of the 54 occupational categories is one row in a table. Such tabulations for some of the very rare cancer categories and for subsites or histological sub-categories are, however, available only in electronic format (http://astra.cancer.fi/NOCCA).
In cells where the observed numbers of cancers are zero, the expected numbers of cancer cases are presented in squared brackets. All SIRs for which the upper limit of the confidence interval is below 1.0 are printed in green, and all SIRs for which the lower limit of the confidence interval is above 1.0 are printed in red.
On the webpage (http://astra.cancer.fi/NOCCA/Incidence/results-by-occupation) there are also similar tabulations for each of the 54 occupational categories, and gender where all cancer categories are presented. The results are also available in Excel format allowing the reader to combine columns from several tables, and in a semicolon separated text file suitable for importing data to various software.
Whenever data are available on cancer incidence in the combined Nordic cancer incidence statistical tool NORDCAN, the site, gender and country specific incidence trends (smoothed with the Lowess method) are shown in graphs preceding the occupation-specific results Citation[49].
Results: Cancer incidence by cancer site
Lip cancer
The incidence of lip cancer in the Nordic countries was five to ten times higher in men than in women still in the 1980s, but due to a strong decrease among males, the difference is now small (). The rates have been highest in Finland, twice as high as in Sweden.
Figure 12. Age standardised (World) incidence rates for lip cancer 1943–2005, by country and gender. Modified from NORDCAN Citation[49].
![Figure 12. Age standardised (World) incidence rates for lip cancer 1943–2005, by country and gender. Modified from NORDCAN Citation[49].](/cms/asset/5576bd14-018d-49f2-a4c1-7082cf0479af/ionc_a_391526_f0012_b.jpg)
In the present study the highest SIR among men was observed among fishermen (SIR 2.27, 95% CI 2.05–2.51). Other high SIRs that were elevated in several countries were seen among farmers, gardeners, forestry workers, miners (many of whom work in open quarries) and miscellaneous construction workers (). The SIR was lowest (0.28, 0.16–0.46) among the physicians, followed by artistic workers, printers and waiters.
Table 4. Observed number of lip cancer among men in the Nordic countries and standardised incidence ratios 1961–2005, by country and occupational category.
In women, there were no occupations with systematically increased or decreased SIRs in all countries (). Female farmers had a significantly decreased risk of lip cancer in Denmark and Sweden.
Table 5. Observed number of lip cancer among women in the Nordic countries and standardised incidence ratios 1961–2005, by country and occupational category.
Comment
All eight occupations with significant SIRs > 1.20 in males include a major part of outdoor work, while the lowest SIRs are in indoor occupations. This fits well with earlier findings indicating that men living in rural areas and in particular those employed in outdoor occupations such as fishermen and farmers have the highest risk of lip cancer Citation[50–52]. The risk has been ascribed to exposure to sunlight and smoking Citation[53]. The pattern of high-risk occupations of lip cancer is very different from the respective pattern of lung cancer. This is in accordance with the observation that smoking is a major risk factor of lip cancer only in interaction with outdoor exposure Citation[53]. The strong decrease in lip cancer incidence rates is in accordance with the decreasing proportion of farmers in the Nordic countries.
The small numbers of female lip cancer do not allow conclusions of occupational pattern among them. The low SIRs among female farmers indicate that women on farms have had less outdoor work than men.
Tongue cancer
Cancer of the tongue is rare, but incidence rates in men have approximately doubled from 1960 to 2003 (). Rates were lowest in Iceland and, during the last 10 years, highest in Denmark. Among women, rates are approximately half of that among men. A small increase has been seen during the period.
Figure 13. Age standardised (World) incidence rates for cancer of the tongue 1943–2005, by country and gender. Modified from NORDCAN Citation[49].
![Figure 13. Age standardised (World) incidence rates for cancer of the tongue 1943–2005, by country and gender. Modified from NORDCAN Citation[49].](/cms/asset/6c09d6cd-0d6b-4bd5-a489-7c84f3597ec2/ionc_a_391526_f0013_b.jpg)
Consistently high SIRs for men were observed among waiters (SIR 4.43, 3.18–6.01), beverage manufacturing workers, cooks and stewards, hairdressers, and artistic workers (). The Nordic combined SIR was elevated for journalists, based on elevations in Finland, Norway and Sweden. Seamen had elevated risks in Denmark and Norway. Low SIRs were observed among male farmers (0.51, 0.45–0.57), gardeners, forestry workers, teachers and fishermen.
Table 6. Observed number of cancer of the tongue among men in the Nordic countries and standardised incidence ratios 1961–2005, by country and occupational category.
High SIRs among women were seen in artistic workers (driven by 4 cases in Denmark) and waiters (). Clerical workers also had a significant excess, driven by Sweden and Denmark. In Sweden there were seven cases of tongue cancer among chemical process workers (which was not observed among males). Consistently low SIRs were observed among nurses (0.69, 0.49–0.95) and launderers and dry cleaning workers (0.50, 0.24–0.93).
Table 7. Observed number of cancer of the tongue among women in the Nordic countries and standardised incidence ratios 1961–2005, by country and occupational category.
Comment
Both tobacco and alcohol are established risk factors, while the consumption of fruit and/or vegetables has frequently been seen to reduce risk Citation[50]. Infection with human papilloma virus entails an increased risk. There are no established occupational risk factors for cancer of the tongue, although it cannot be excluded that exposure to inhaled organic or inorganic dust may play a role. The high risk groups identified in the present study are mostly groups where smoking and drinking prevalence also has been shown to be high. For male hairdressers and female chemical process workers, it is possible that occupational exposures contribute to risk.
Cancer of the salivary glands
Cancer in the salivary glands, mainly seen in the parotid gland, is rare. The rates have been stable through the period both among men and women, with the exception of higher rates seen among Danish men and women during the 1960s ().
Figure 14. Age standardised (World) incidence rates for cancer of the salivary glands 1943–2005, by country and gender. Modified from NORDCAN Citation[49].
![Figure 14. Age standardised (World) incidence rates for cancer of the salivary glands 1943–2005, by country and gender. Modified from NORDCAN Citation[49].](/cms/asset/1a025c09-7537-4e21-a4f9-d621d79a2f7d/ionc_a_391526_f0014_b.jpg)
At the combined Nordic level no male occupation had a significantly elevated risk. At the national level, physicians in Norway (SIR 2.91, 95% CI 1.26–5.73) and dentists in Denmark (4.61, 1.26–11.81) had high SIRs. Forestry workers, wood workers, and smelter and metal foundry workers all had low risks ().
Table 8. Observed number of cancer of the salivary glands among men in the Nordic countries and standardised incidence ratios 1961–2005, by country and occupational category.
Among women, clerical workers had a combined SIR of 1.14 (1.02–1.28), driven by the large number of cases in Sweden. Consistently low SIRs were seen in the group of other health and medical workers ().
Table 9. Observed number of cancer of the salivary glands among women in the Nordic countries and standardised incidence ratios 1961–2005, by country and occupational category.
Comment
Therapeutic and diagnostic radiation and UV radiation to the head and neck are established risk factors for cancer of the salivary glands Citation[50]. Alcohol, tobacco, and viral infections play a minor role, if any. The observed occupational variations in risk are most probably due to chance.
Cancer of the oral cavity
In both men and women, cancer of the mouth has increased by approximately 50% in Finland, Norway and Sweden, and with 200% in Denmark ().
Figure 15. Age standardised (World) incidence rates for cancer of the oral cavity 1943–2005, by country and gender. Modified from NORDCAN Citation[49].
![Figure 15. Age standardised (World) incidence rates for cancer of the oral cavity 1943–2005, by country and gender. Modified from NORDCAN Citation[49].](/cms/asset/d05a9c38-95e8-41aa-9782-e7a4e5659aa9/ionc_a_391526_f0015_b.jpg)
Among men, elevated risks were seen for waiters (SIR 5.05, 95% CI 3.91–6.41), cooks and stewards, seamen, journalists and artistic workers. Low risks were observed for farmers (0.55, 0.50–0.60), gardeners, teachers and forestry workers ().
Table 10. Observed number of cancer of the oral cavity among men in the Nordic countries and standardised incidence ratios 1961–2005, by country and occupational category.
Female journalists (2.82, 1.46–4.92), waiters, mechanics and iron metalworkers, launderers and dry cleaners, and the group packers, loaders and warehouse workers had elevated risks. Farmers, shoe and leather workers, and shop managers and assistants were low risk groups among the women ().
Table 11. Observed number of cancer of the oral cavity among women in the Nordic countries and standardised incidence ratios 1961–2005, by country and occupational category.
Comment
Tobacco and alcohol are the major risk factors for oral cancer, both separately and in combination Citation[50]. Infection with human papilloma virus entails an increased risk Citation[54], while a high consumption of fruit and/or vegetables reduces risk. Direct occupational exposures appear to have little effect Citation[55].
Pharyngeal cancer
The incidence of pharyngeal cancer has increased by 50–100% for men and been relatively stable for women in all countries, except in Denmark, where rates have quadrupled among men and tripled among women ().
Figure 16. Age standardised (World) incidence rates for cancer of the pharynx 1943–2005, by country and gender. Modified from NORDCAN Citation[49].
![Figure 16. Age standardised (World) incidence rates for cancer of the pharynx 1943–2005, by country and gender. Modified from NORDCAN Citation[49].](/cms/asset/2610c704-3fda-41a9-9d89-e13bc137f0cf/ionc_a_391526_f0016_b.jpg)
Risk was consistently high among male waiters (SIR 6.22, 95% CI 5.16–7.50), beverage manufacture workers, cooks and stewards, chimney sweeps, artistic workers, seamen and journalists. Male hairdressers in Norway and Sweden had elevated risks. The low risk occupational categories comprise farmers (0.41, 0.38–0.45), forestry workers, gardeners, teachers, and physicians ().
Table 12. Observed number of cancer of the pharynx among men in the Nordic countries and standardised incidence ratios 1961–2005, by country and occupational category.
Female tobacco workers, artistic workers and waiters had elevated risks in some, but not all, countries. Low risks were seen among teachers (0.64, 0.51–0.80), other health and medical workers and farmers ().
Table 13. Observed number of cancer of the pharynx among women in the Nordic countries and standardised incidence ratios 1961–2005, by country and occupational category.
Subsite analyses of oropharynx (http://astra.cancer.fi/NOCCA/Incidence/oropharynx) and nasopharynx (http://astra.cancer.fi/NOCCA/Incidence/nasopharynx) in general gave similar results. Female laundry workers however had an elevated risk of nasopharyngeal cancer (2.04, 1.02–3.65).
Comment
Cancer of the pharynx, except nasopharynx, has the same risk factors as oral cancer, alcohol and tobacco being the main aetiological agents Citation[50], Citation[56]. The high risk occupations observed here are those mostly working with the production or distribution of these products or having easy access to them, or those which belong to work cultures where liberal attitudes towards drinking and smoking have been prevalent. There are some indications that the inhalation of organic or inorganic dust may be associated with elevated risk, which may have contributed to the high risks among male hairdressers and chimney sweeps.
Oesophageal cancer
For both genders the risk of oesophageal cancer has been relatively stable in Norway and Sweden, and in Danish women. The incidence rate among men in Denmark has more than doubled since 1980. Finnish men and women and Icelandic women have experienced a large decrease in risk and Icelandic men a more moderate decrease in risk ().
Figure 17. Age standardised (World) incidence rates for oesophageal cancer 1943–2005, by country and gender. Modified from NORDCAN Citation[49].
![Figure 17. Age standardised (World) incidence rates for oesophageal cancer 1943–2005, by country and gender. Modified from NORDCAN Citation[49].](/cms/asset/3b870a0e-ecdc-4071-91c3-b39bdd2e9d37/ionc_a_391526_f0017_b.jpg)
High risks were seen among male waiters (SIR 3.34, 95% CI 2.75–4.07), beverage manufacture workers, cooks and stewards, chimney sweeps and seamen (). The SIRs for adenocarcinoma (http://astra.cancer.fi/NOCCA/Incidence/oesophagus-adenocarcinoma) in these occupational categories tended to be less increased. Physicians (0.49, 0.36–0.67), teachers, dentists, farmers, other health and medical workers, religious, juridical and other workers form the most important low risk groups.
Table 14. Observed number of oesophageal cancer among men in the Nordic countries and standardised incidence ratios 1961–2005, by country and occupational category.
Among women, waitresses had an elevated SIR (1.35, 1.13–1.62) as well as women working on ships in Finland and Sweden (based on 2 and 1 case, respectively). Low SIRs were observed among nurses (0.68, 0.53–0.85), assistant nurses, teachers and farmers ().
Table 15. Observed number of oesophageal cancer among women in the Nordic countries and standardised incidence ratios 1961–2005, by country and occupational category.
Comment
Squamous cell carcinoma of the oesophagus is strongly linked to alcohol and tobacco, while adenocarcinoma is mainly associated with obesity Citation[57]. Consumption of fruits and vegetables appear to convey a protective effect in both types. Differences in alcohol consumption and tobacco smoking are probably major factors behind the observed distribution of risk, which is mainly confined to squamous cell carcinoma. An effect of exposure to combustion products has been suggested Citation[58], Citation[59], possibly contributing to the high risk seen among chimney sweeps.
Stomach cancer
The incidence of stomach cancer in the Nordic countries is two times higher in men than in women (). Fifty years ago, the rates in Iceland were among the highest in the world, and were, as well as the Finnish rates, markedly higher than in the other three Nordic countries. Along with the decline in incidence during the past decades, the differences between the Nordic countries have become negligible.
Figure 18. Age standardised (World) incidence rates for stomach cancer 1943–2005, by country and gender. Modified from NORDCAN Citation[49].
![Figure 18. Age standardised (World) incidence rates for stomach cancer 1943–2005, by country and gender. Modified from NORDCAN Citation[49].](/cms/asset/61857704-9569-4da9-8e38-b3d2d201791c/ionc_a_391526_f0018_b.jpg)
In the present study the highest SIR among the men were observed among fishermen (SIR 1.36, 95% CI 1.29–1.43). Other SIRs that were elevated in all, or most, countries were among seamen, miners, chimney sweeps, “other construction workers” and several other groups of unskilled workers (). The SIRs were lowest among dentists (0.45, 0.34–0.58), physicians, journalists, religious workers, teachers and several other professions characterised by high educational level and high social status. For cancers of the gastric cardia (http://astra.cancer.fi/NOCCA/Incidence/stomach-cardia), beverage workers (1.77, 1.14–2.61) and fishermen (1.38, 1.22–1.57) had elevated SIRs and physicians decreased SIR (0.70, 0.50–0.95).
Table 16. Observed number of stomach cancer among men in the Nordic countries and standardised incidence ratios 1961–2005, by country and occupational category.
In women, the highest SIR was among “other construction workers” (1.37, 1.03–1.78), followed by electrical workers, mechanics and other unskilled workers (). The SIR was lowest (0.42, 0.23–0.69) among the physicians, followed by journalists, teachers and administrators. The results were consistent, both within genders and within the Nordic countries. For cardia cancer in women the numbers were too small for conclusions to be drawn.
Table 17. Observed number of stomach cancer among women in the Nordic countries and standardised incidence ratios 1961–2005, by country and occupational category.
Comment
The SIRs were consistently high for unskilled workers and low for occupations characterised by a high educational level and a high social status Citation[60]. The strongest risk factor identified to date is chronic bacterial infection with Helicobacter pyloriCitation[61]. Another established risk factor is a diet poor in fruits and vegetables and rich in red meat and processed meat Citation[62], salt and salted food Citation[61]. For gastric cancers of the cardia, smoking is an established risk factor, whereas H. pylori infection is not Citation[61]. Smoking may also be weakly related to non-cardia gastric cancer.
Stomach cancer is not usually thought to have a strong occupational aetiology. However, work-related exposure to airborne particles, especially cement- and silica dust, has repeatedly been associated with increased risk Citation[63]. The increased SIRs in the present study for miners, chimney sweeps and construction workers fit with those findings.
Cancer of the small intestine
Cancer of the small intestine is a rare disease in the Nordic countries with an increasing trend ().
Figure 19. Age standardised (World) incidence rates for cancer of the small intestine 1943–2005, by country and gender. Modified from NORDCAN Citation[49].
![Figure 19. Age standardised (World) incidence rates for cancer of the small intestine 1943–2005, by country and gender. Modified from NORDCAN Citation[49].](/cms/asset/bc983fae-55f0-4731-b4c1-42de1991da55/ionc_a_391526_f0019_b.jpg)
Only a modest occupational variation was found in the incidence of small intestine cancer. Among men, postal workers topped the list with an SIR of 1.32 (95% CI 1.04–1.65), and forestry workers (0.76, 0.63–0.93), gardeners and farmers were at the bottom (). For women (), the only occupational category with a statistically significant value different from 1 was glass, ceramic and tile workers (0.55, 0.31–0.91).
Table 18. Observed number of cancer of the small intestine among men in the Nordic countries and standardised incidence ratios 1961–2005, by country and occupational category.
Table 19. Observed number of cancer of the small intestine among women in the Nordic countries and standardised incidence ratios 1961–2005, by country and occupational category.
Comment
Tumours occurring in the small intestine can be adenocarcinomas (30–40%), carcinoid (about 35%), lymphomas (15–20%; included in non-Hodgkin lymphoma in the present study), or sarcomas (10–15%). Little is known about environmental determinants of small intestinal cancer. So far, no occupational studies have convincingly indicated any associations between exposure to occupational agents and small intestine cancer Citation[64].
Colon cancer
The incidence of colon cancer in the Nordic countries varies about 1.5-fold. It is slightly higher in men than in women (). In males, the rates in Norway have been twofold as compared to the rates in Finland, and incidence rates are increasing in all Nordic countries in both males and females.
Figure 20. Age standardised (World) incidence rates for colon cancer 1943–2005, by country and gender. Modified from NORDCAN Citation[49].
![Figure 20. Age standardised (World) incidence rates for colon cancer 1943–2005, by country and gender. Modified from NORDCAN Citation[49].](/cms/asset/065935cb-2ae2-4f75-a824-8dd44da5a1dc/ionc_a_391526_f0020_b.jpg)
The highest SIRs among men were observed in chimney sweeps (SIR 1.52, 95% CI 1.25–1.84), waiters, beverage workers and administrators (). The SIRs were lowest in forestry workers (0.75, 0.71–0.78), farmers and gardeners.
Table 20. Observed number of colon cancer among men in the Nordic countries and standardised incidence ratios 1961–2005, by country and occupational category.
Among women, the variation in colon cancer incidence was small. Only printers, chemical process workers and administrators had significant SIRs greater than 1.1, and only farmers and gardeners had SIRs smaller than 0.9 ().
Table 21. Observed number of colon cancer among women in the Nordic countries and standardised incidence ratios 1961–2005, by country and occupational category.
Comment
Several dietary factors, e.g. a high consumption of animal fat and meat have been suggested to increase the risk of colon cancer, while other factors, e.g. a high consumption of fibre, fruit and vegetables, have been suggested to decrease the risk Citation[65]. Physical activity protects against colon cancer. The joint exposures to tobacco and alcohol drinking could contribute to the increased risk in beverage workers and waiters.
For women, the variation in colon cancer incidence is relatively small between professions. Even among men the differences in SIR between different occupational categories is rather small. According to previous research, sedentary work, such as work done for example by highly educated workers, seems to be related to increased risk of colon cancer Citation[66]. The effect of physical activity is not strongly reflected to the occupational risk pattern of our study. The occupational categories with highest SIRs (male waiters and chimney sweeps) do not generally imply sedentary work.
Rectal cancer
The incidence of rectal cancer is higher in men than in women in all Nordic countries. Rates have been consistently high in Denmark and have increased in the other countries, especially in Norway ().
Figure 21. Age standardised (World) incidence rates for rectal cancer 1943–2005, by country and gender. Modified from NORDCAN Citation[49].
![Figure 21. Age standardised (World) incidence rates for rectal cancer 1943–2005, by country and gender. Modified from NORDCAN Citation[49].](/cms/asset/6d9c39b2-3e70-4b4a-a2de-556b6e43c170/ionc_a_391526_f0021_b.jpg)
The incidence of rectal cancer was highest among male waiters (SIR 1.41, 95% CI 1.21–1.65) and beverage workers (1.40, 1.16–1.68). None of the significantly low SIRs among the men were below 0.85 (). In women the SIRs were high among chimney sweeps (6.71, 1.38–19.61, based on only 3 cases), and tobacco manufacture workers (). A low SIR was observed among the female beverage manufacture workers (0.59, 0.36–0.92).
Table 22. Observed number of rectal cancer among men in the Nordic countries and standardised incidence ratios 1961–2005, by country and occupational category.
Table 23. Observed number of rectal cancer among women in the Nordic countries and standardised incidence ratios 1961–2005, by country and occupational category.
Comment
The variation in rectal cancer risk between occupational categories is very small. Workers in tobacco manufacturing may smoke more than the general population, and hence the increased risk among females working in tobacco manufacturing may be explained by smoking, which is an established risk factor of rectal cancer Citation[65]. The increased risk among male and decreased risk among female beverage workers may well be an example of a situation where the men and women under the same occupational code do different types of work. Men may work mainly with beer brewing, while women with other types of beverages. Earlier studies suggest that alcohol consumption – which may be high among brewery workers – may increase the risk of rectal cancer. Lack of physical activity or sedentary work has not been clearly associated with the risk of rectal cancer Citation[66].
Liver cancer
Liver cancer is rare in the Nordic countries. The pattern is very similar in the two genders, although with a lower rate among women ().
Figure 22. Age standardised (World) incidence rates for liver cancer 1943–2005, by country and gender. Modified from NORDCAN Citation[49].
![Figure 22. Age standardised (World) incidence rates for liver cancer 1943–2005, by country and gender. Modified from NORDCAN Citation[49].](/cms/asset/c91c7e2d-de06-48e4-9230-0679c0c43715/ionc_a_391526_f0022_b.jpg)
Among men, waiters (SIR 4.22, 95% CI 3.47–5.13), cooks, beverage workers, journalists and seamen ranked as the five groups with the highest risk. At the other end of the scale were farmers (0.47, 0.45–0.50), gardeners, forestry workers, teachers, fishermen and wood workers ().
Table 24. Observed number of liver cancer among men in the Nordic countries and standardised incidence ratios 1961–2005, by country and occupational category.
In women, the risk of primary liver cancer did not vary much across the different occupations (). Significantly elevated risks were seen among smelter and metal foundry workers (2.11, 1.09–3.68), tobacco manufacture workers, waitresses, building caretakers and cleaners. The lowest risks were observed among farmers (0.66, 0.57–0.77), teachers and those working with religious, juridical and other humanistic work.
Table 25. Observed number of liver cancer among women in the Nordic countries and standardised incidence ratios 1961–2005, by country and occupational category.
Only 59 and 57 cases of hemangiosarcoma (http://astra.cancer.fi/NOCCA/Incidence/liver-hemangiosarcoma) were diagnosed among men and women, respectively. There were no occupational categories with significantly elevated risk.
Comment
The occurrence of liver cancer is causally related to the consumption of alcoholic beverages Citation[67]. Exposure to other known hepatocarcinogens, Hepatitis B and C viruses and aflatoxins, is relatively low in the Nordic countries. High risks can therefore be expected in occupational categories which, on the basis of easy availability of alcohol or cultural traditions, have high alcohol consumption. On the other hand, possible direct occupational factors may be hidden behind the strong effect of alcohol. Thus, the risk pattern of men fits well with the image of high alcohol consumption in various occupations, whereas chemical factors might contribute to the highest SIRs in women.
Hemangiosarcoma is associated with occupational exposure to vinylchloride arsenic, and thorotrast, an x-ray contrast medium used before 1960 Citation[68]. Because of the rarity of both the exposures and the disease, it was not possible see any association between these factors.
Cancer of the gallbladder and biliary tract
The incidence of gallbladder cancer was highest in Denmark around 1975 and in Sweden and Finland around 1985, while the incidence continues to increase in Iceland and Norway (). The cancer has been more frequent in women than in men.
Figure 23. Age standardised (World) incidence rates for cancer of the gallbladder 1943–2005, by country and gender. Modified from NORDCAN Citation[49].
![Figure 23. Age standardised (World) incidence rates for cancer of the gallbladder 1943–2005, by country and gender. Modified from NORDCAN Citation[49].](/cms/asset/e126334b-c075-466f-8733-a64a1949c74b/ionc_a_391526_f0023_b.jpg)
For men, the high risk groups were cooks and stewards (SIR 1.56, 95% CI 1.03–2.27), “other workers” and drivers (). The low risk groups were farmers (0.75, 0.70–0.80), forestry workers, gardeners and woodworkers. Two groups of women had a statistically significant but not very high excess risk of gallbladder cancer, these being building caretakers (1.13, 1.06–1.21) and economically inactive women (mainly housewives). A number of occupational categories of women had deficit risks of gallbladder cancer. The lowest SIRs were found in dentists (0.39, 0.14–0.85), nurses, assistant nurses, and teachers ().
Table 26. Observed number of cancer of the gallbladder among men in the Nordic countries and standardised incidence ratios 1961–2005, by country and occupational category.
Table 27. Observed number of cancer of the gallbladder among women in the Nordic countries and standardised incidence ratios 1961–2005, by country and occupational category.
Comment
The presence of gallstones – a relatively common condition, in particular among women aged 50 or more years – is associated with a risk of developing cancer of the gallbladder Citation[69]. We have no information on the prevalence of gallstones over occupational categories. Body fatness is associated with increased risk, while no dietary factors have so far been conclusively linked with risk Citation[70]. Smoking Citation[71], and alcohol consumption Citation[70] do not seem to be causally linked with the development of gallbladder cancer. The overall impact of occupational exposures on gallbladder cancer is probably very small Citation[69], although some previous studies found inconsistent associations with chemical workers, painters, pesticide manufacturers, vinyl chloride workers, munition workers exposed to dinitrotoluene, textile workers, cellulose triacetate fiber manufacturing, workers in petroleum refining, paper mills, chemical processing, shoemaking and repairing, asbestos related occupations, and exposure to solvents such as methylene chloride and trichlorinated hydrocarbons. Findings of our study do not support a role of any of the specific occupational exposures.
Cancer of the pancreas
The incidence of pancreatic cancer in the Nordic countries is 50% higher in men than in women (). In both genders and for all countries, the incidence increased until the mid 1970s, and after that it decreased in men and plateaued in women.
Figure 24. Age standardised (World) incidence rates for pancreatic cancer 1943–2005, by country and gender. Modified from NORDCAN Citation[49].
![Figure 24. Age standardised (World) incidence rates for pancreatic cancer 1943–2005, by country and gender. Modified from NORDCAN Citation[49].](/cms/asset/2ea120f2-ca6d-4c25-81d6-bbbffa991b4e/ionc_a_391526_f0024_b.jpg)
In the present study the highest SIR among men was observed among beverage workers (SIR 1.70, 95% CI 1.35–2.11), followed by waiters, chimney sweeps, cooks and stewards (). The SIR was lowest among farmers (0.81, 0.78–0.83) and gardeners.
Table 28. Observed number of pancreatic cancer among men in the Nordic countries and standardised incidence ratios 1961–2005, by country and occupational category.
In women, the highest significant SIRs were seen among drivers (1.32, 1.04–1.64) and mechanics (). The SIR was lowest among forestry workers (0.39, 0.13–0.91) and farmers.
Table 29. Observed number of pancreatic cancer among women in the Nordic countries and standardised incidence ratios 1961–2005, by country and occupational category.
Comment
Cigarette smoking is the most consistent and strongest risk factor for cancer of the pancreas Citation[72]. The distribution of SIRs is also largely in accordance with what is known about smoking prevalence among the occupational categories. An association has been suggested with exposure to metals, metalworking fluids containing PAHs, nitrosamines and chlorinated hydrocarbons Citation[72]. From the present results, findings among chimney sweeps might well be related to exposure to PAHs.
Cancer of the nose and nasal sinuses
Nasal cancer is rare. Rates are somewhat higher in men than in women and have been fairly constant ().
Figure 25. Age standardised (World) incidence rates for nasal cancer 1943–2005, by country and gender. Modified from NORDCAN Citation[49].
![Figure 25. Age standardised (World) incidence rates for nasal cancer 1943–2005, by country and gender. Modified from NORDCAN Citation[49].](/cms/asset/44c8a2b5-61ae-4340-b35e-d5c8ad182f55/ionc_a_391526_f0025_b.jpg)
In men, the SIR was highest among woodworkers (SIR 1.84, 95% CI 1.66–2.04), consistently in all Nordic countries. In Norway, smelting workers and glass, ceramic and tile workers also had increased SIRs. The lowest SIRs were observed among military personnel (0.43, 0.22–0.77), teachers, gardeners, and farmers ().
Table 30. Observed number of nasal cancer among men in the Nordic countries and standardised incidence ratios 1961—2005, by country and occupational category.
Female woodworkers had an elevated SIR (1.88, 0.90–3.46). The SIR was borderline significant among female packers, loaders and warehouse workers (1.52, 0.99–2.23), based on the high SIR in Norway (10 cases; ).
Table 31. Observed number of nasal cancer among women in the Nordic countries and standardised incidence ratios 1961–2005, by country and occupational category.
The SIR for adenocarcinoma of the nose among male woodworkers was 5.50 (4.60–6.56). Among women, there were only 141 cases of nasal cancer classified as adenocarcinoma and no significant findings (http://astra.cancer.fi/NOCCA/Incidence/nose-adenocarcinoma).
Comment
Several occupations and industrial exposures have been associated with an increased risk of nasal cancer Citation[73]. However, due to the rarity of these tumours, the identification of high risk groups has frequently been based on few cases. There has been little evidence of non-occupational causes for this disease. Relative risks well in excess of 5–10 in the boot and shoe manufacturing industries have been reported Citation[74]. Shoe and leather workers are exposed to dust from leather and to benzene from the glue Citation[75]. In the earlier Nordic study based on census occupations and follow-up from 1971–1991 Citation[1], shoe and leather workers experienced the highest risk of nasal cancer with an SIR of 2.94 (95% CI 1.47–5.26). In the present follow-up there was no longer any such excess risk, possibly reflecting decreasing exposure levels in the shoe and leather industry.
In the present study, woodworkers had the highest SIR, and the excess was consistent over countries and genders. Most of the available cohort and case-control studies of nasal cancer have shown increased risks associated with exposure to wood dust Citation[76]. The highest relative risk ever reported for any occupational risk (RR 500) is the one between hard wood dust and sinonasal adenocarcinoma Citation[77]. Our study did not replicate such an extreme risk, but an SIR of 5.50, possibly because the majority of woodworkers in the Nordic countries are exposed to soft wood.
An excess risk of nasal cancer in workers exposed to benzene in gasoline vapours has been reported Citation[78], but the present study did not suggest such associations. Increased risk of nasal cancer has also been found to be associated with exposures to employment in the nickel process industry Citation[79]. In the present study, nickel process workers are included in the broad group of smelting workers. An elevated SIR was seen in Norway where an important nickel refinery is located Citation[80].
Laryngeal cancer
The gender ratio for larynx cancer is large, with rates being 12–20 times higher for men than for women in Finland and approximately 5–12 times higher in the other countries, throughout the period. In Finnish men, rates peaked during the 1960s and have been decreasing ever since. In the other countries the incidence increased until around 1990 ().
Figure 26. Age standardised (World) incidence rates for laryngeal cancer 1943–2005, by country and gender. Modified from NORDCAN Citation[49].
![Figure 26. Age standardised (World) incidence rates for laryngeal cancer 1943–2005, by country and gender. Modified from NORDCAN Citation[49].](/cms/asset/19d872a5-2c08-4ce5-b699-aef82fc5466e/ionc_a_391526_f0026_b.jpg)
Elevated SIRs were seen in several groups, most pronounced among male waiters (SIR 3.52, 95% CI 2.90–4.27), beverage manufacture workers, cooks and stewards, seamen, and hairdressers. Male farmers (0.46, 0.44–0.49), laboratory assistants, teachers and physicians were all at low risk ().
Table 32. Observed number of laryngeal cancer among men in the Nordic countries and standardised incidence ratios1961–2005, by country and occupational category.
Among women, “other construction workers” (7.39, 3.54–13.58), public and safety protection workers (5 cases), mechanics, waitresses, printers, electrical workers, hairdressers, cooks and stewards, building caretakers and cleaners and food workers were at elevated risk (). Low risks were seen among nurses (0.30, 0.16–0.52), farmers, teachers, religious workers, and gardeners.
Table 33. Observed number of laryngeal cancer among women in the Nordic countries and standardised incidence ratios 1961–2005, by country and occupational category.
Comment
The separate and joint effects of tobacco and alcohol account for the major proportion of larynx cancer cases Citation[81]. Occupational factors related to risk include exposure to sulphur acid mist and asbestos, and possibly to solvents and wood dust. Most of the variation in risk across occupations can probably be explained by smoking and drinking habits.
Lung cancer
Lung cancer was the second most frequent cancer in men in the present study and number four among women. The lung cancer incidence among men reached its peak in the early 1970s in Finland and then began to fall (). The peak came later in the other countries. The rates have been much lower in women but are increasing.
Figure 27. Age standardised (World) incidence rates for lung cancer 1943–2005, by country and gender. Modified from NORDCAN Citation[49].
![Figure 27. Age standardised (World) incidence rates for lung cancer 1943–2005, by country and gender. Modified from NORDCAN Citation[49].](/cms/asset/add067fa-5d9e-4fa2-8ea7-a11cbb44b7ce/ionc_a_391526_f0027_b.jpg)
The highest SIRs in men were observed among waiters (SIR 1.90, 95% CI 1.75–2.05), tobacco manufacture workers, seamen, miners and quarry workers, cooks and stewards, chimney sweeps, plumbers and beverage manufacture workers. The SIRs were lowest among male nurses (0.40, 0.19–0.73), teachers, dentists, physicians, farmers, religious workers and gardeners ().
Table 34. Observed number of lung cancer among men in the Nordic countries and standardised incidence ratios 1961–2005, by country and occupational category.
Among women the highest SIRs were found among engine operators (2.61, 2.19–3.11), tobacco workers, and “other construction workers”. Painters, waiters, beverage workers, transport workers, electrical workers, printers, welders, mechanics, packers, chemical process workers, drivers and glass makers also had significant SIRs above 1.4. The lowest SIRs among women were found among farmers (0.46, 0.44–0.49), followed by gardeners and teachers ().
Table 35. Observed number of lung cancer among women in the Nordic countries and standardised incidence ratios 1961–2005, by country and occupational category.
The occupational SIR patterns were similar for adenocarcinoma, squamous cell carcinoma, small cell carcinoma and other and unspecified types of lung cancer ()
Table 36. Standardised incidence ratio for histological subtypes of lung cancer, 1961–2005, by gender and occupational category. Only occupations with more than 30 observed cases in sum are listed.
Comment
Although tobacco smoking is the main cause of lung cancer, the attributable fraction of occupational exposures is estimated to up to 20% Citation[82], Citation[83]. Some occupational exposures act in concert with smoking to synergistically increase risk Citation[84–86]. The International Agency for Research on Cancer has listed a wide range of occupational lung carcinogens Citation[87].
Throughout our study period there has been an invert social gradient in smoking, so that those with higher education and in higher socio-economic positions quit smoking, while those in manual work and with a lower education continued or started smoking Citation[6], Citation[88–90]. In the present study, the occupational categories with high SIRs are all manual workers with low education likely to smoke more than others.
Much of the observed variation in risk can be explained by smoking habits. Tobacco workers are known to have had easy access to tobacco. Waiters have until recently been heavily exposed to passive smoking in addition to their own smoking. Many of the high SIR occupations are also likely to be exposed to various known or suspected occupational carcinogens Citation[82]. Miners and quarry workers may be exposed to radon, silica dust, diesel exhaust, and asbestos; plumbers to asbestos; smelting workers e.g. to arsenic, nickel and chromium compounds; welders to welding fumes, nickel and chromium compounds; drivers to diesel exhaust; bricklayers and other construction workers to silica dust and asbestos; and chemical workers and mechanics to mixed exposures. A high prevalence of cigarette smoking and an excess risk of lung cancer have been demonstrated among seamen Citation[91–93]. Among seamen working in the machine room, exposure to asbestos, polyaromatic hydrocarbons and oil mist may also contribute to the elevated lung cancer risk.
In the present study the lowest SIRs for lung cancer were seen among those with a high level of education, such as physicians, dentists, nurses and teachers, but also among farmers. These groups smoke less than others Citation[5], Citation[32], Citation[94].
The findings for the histological subtypes of lung cancer did not suggest that aetiological factors would be specific to one subtype only.
Mesothelioma in the pleura/peritoneum
Mesothelioma is a rare disease. Of all mesotheliomas, over 80% are of pleural origin. shows the time trends for pleural cancer, the great majority of which are the mesothelioma type. Pleural cancer has increased in men, but the incidence has always remained low in women.
Figure 28. Age standardised (World) incidence rates for pleural cancer 1943–2005, by country and gender. Modified from NORDCAN Citation[49].
![Figure 28. Age standardised (World) incidence rates for pleural cancer 1943–2005, by country and gender. Modified from NORDCAN Citation[49].](/cms/asset/cc64d951-c263-4f87-89d5-aa61ca2daecd/ionc_a_391526_f0028_b.jpg)
Despite the rareness of mesothelioma, 14 of the 53 occupational categories had a statistically significant excess risk in men, and 18 of the groups had a statistically significant deficit risk. In men, the risk varied almost by 20-fold from an SIR of 4.74 (95% CI 4.18–5.38) in plumbers to 0.22 (0.04–0.63) among the journalists. The high risk occupational categories include seamen, mechanics, electrical workers, smelting workers, welders and painters (). In women, only a few occupations have a statistically significant excess or deficit risk. The high risk groups were woodworkers (2.12, 1.06–3.80), glass makers, textile workers and building caretakers. The low risk groups included farmers (0.65, 0.43–0.96) and gardeners ().
Table 37. Observed number of mesothelioma in the pleura/peritoneum among men in the Nordic countries and standardised incidence ratios 1961–2005, by country and occupational category.
Table 38. Observed number of mesothelioma in the pleura/peritoneum among women in the Nordic countries and standardised incidence ratios 1961–2005, by country and occupational category.
Comment
Asbestos exposure is the overwhelming cause of mesothelioma Citation[95], and the proportion attributable to asbestos has been estimated to be about 85% Citation[82].
An increased risk of mesothelioma has been convincingly shown in occupational categories exposed to asbestos: miners, insulation workers, manufacturers of cement, textiles, thermoelectric power plant workers, oil refining, pulp and paper production, petroleum industry, cigarette and filter manufacturing and the railroad industry Citation[95]. All occupational categories with increased mesothelioma risk in our study involve exposure to asbestos, while the low risk categories were probably unexposed.
Breast cancer
Breast cancer accounts for nearly one third of all incident cancer among women in the Nordic countries. The incidence is a 100-fold higher than among men, and has been rising rapidly during the past five decades (). During most of the period the incidence was highest in Denmark and lowest in Finland. An increase in the rates was observed along with the implementation of the organised mammography (breast cancer screening programmes) e.g. in Finland (1986) and Norway (1994).
Figure 29. Age standardised (World) incidence rates for breast cancer 1943–2005, by country. Modified from NORDCAN Citation[49].
![Figure 29. Age standardised (World) incidence rates for breast cancer 1943–2005, by country. Modified from NORDCAN Citation[49].](/cms/asset/602cd1ff-c4d6-47d9-a6b7-c9eac1c327cc/ionc_a_391526_f0029_b.jpg)
In the present study, the risk among males was highest among journalists (SIR 2.72, 95% CI 1.49–4.56), followed by cooks and stewards, printers, artistic workers and building caretakers. It was lowest in engine operators (0.63, 0.42–0.90) and forestry workers ().
Table 39. Observed number of breast cancer among men in the Nordic countries and standardised incidence ratios 1961–2005, by country and occupational category.
In women, the occupational groups with the highest SIRs were military personnel (1.57, 1.03–2.30), dentists, journalists, physicians, administrators and artistic workers (). The SIR was lowest among fishermen (0.69, 0.50–0.92); followed by forestry workers, wood workers, gardeners and farmers.
Table 40. Observed number of breast cancer among women in the Nordic countries and standardised incidence ratios 1961–2005, by country and occupational category.
The contrast between the highest and the lowest SIRs was somewhat stronger for lobular cancer (around 10% of breast cancer; http://astra.cancer.fi/NOCCA/Incidence/breast-lobular), than for ductal cancer (around 80% of breast cancer; http://astra.cancer.fi/NOCCA/Incidence/breast-ductal). The highest SIR for the lobular type was 1.79 (1.39–2.28) for journalists, followed by physicians (1.71, 1.36–2.13), dentists (1.66, 1.22–2.20) and administrators (1.51, 1.34–1.71). The lowest SIRs were seen for engine operators (0.43, 0.24–0.72) and woodworkers (0.53, 0.39–0.71).
Comment
Among men, the occupations with the highest incidence were characterised by shift- or night work. Shift work that involves night work (and thus circadian disruption) has been classified by the International Agency for Cancer Research as probably carcinogenic to humans, with the human evidence based on breast cancer research Citation[96]. In the present study the results for women were less suggestive of an association with shift or night work. This could be related to the fact that for women, the most important non-genetic risk factors for breast cancer are hormonal factors, strongly connected with reproductive behaviour Citation[97].
Young age at first birth and an increasing number of births are associated with lowered risk. The present results showed the highest SIRs in occupations that require high education and cause women to postpone their first childbirth. Other established risk factors for breast cancer include ionising radiation, lack of physical activity, high body mass index and alcohol consumption. These factors were not particularly reflected in the present results, except for a tendency for occupations with high levels of physical activity to have the lowest SIRs. The contrasts seen between occupations were considerably higher among men than women, which might indicate a stronger occupationally related aetiology among the men.
Cervical cancer
Incidence of cervical cancer has decreased in all Nordic countries since the 1960s, except for in Norway where the decrease started in the mid 1970s (). This can mainly be explained by the introduction of organised screening programmes. The lowest rate, in Finland, has always been less than half of the highest rate, in Denmark.
Figure 30. Age standardised (World) incidence rates for cancer of the cervix uteri 1943–2005, by country. Modified from NORDCAN Citation[49].
![Figure 30. Age standardised (World) incidence rates for cancer of the cervix uteri 1943–2005, by country. Modified from NORDCAN Citation[49].](/cms/asset/4fe47100-d6bf-47d3-8052-c6c41e80148a/ionc_a_391526_f0030_b.jpg)
The highest SIRs were seen among beverage manufacture workers (SIR 2.01, 95% CI 1.51–2.61), “other construction workers”, waiters, tobacco manufacture workers, drivers and electrical workers. The SIRs were lowest among the dentists (0.48, 0.30–0.74), physicians, teachers, farmers and nurses ().
Table 41. Observed number of cancer of the cervix uteri among women in the Nordic countries and standardised incidence ratios 1961–2005, by country and occupational category.
Comment
Infection with oncogenic types of human papilloma virus (HPV) is the main cause of cervical cancer Citation[98]. Tobacco has an independent role in cervical cancer carcinogenesis.
In previous research, high rates have been found among cleaners, food preparation workers and waitresses, although these studies did not take HPV infection into account. There is a possibility that participation in the screening programmes varies by occupational category.
Corpus uteri – endometrial cancer
Incidence of cancer of the corpus uteri in the Nordic countries has been increasing steadily during the last decades, and currently SIRs are rather similar in all Nordic countries ().
Figure 31. Age standardised (World) incidence rates for cancer of the corpus uteri 1943–2005, by country. Modified from NORDCAN Citation[49].
![Figure 31. Age standardised (World) incidence rates for cancer of the corpus uteri 1943–2005, by country. Modified from NORDCAN Citation[49].](/cms/asset/b8abf38d-eb49-45ea-9e24-84e48aa22bec/ionc_a_391526_f0031_b.jpg)
Artistic workers (SIR 1.22, 95% CI 1.07–1.40), journalists (1.23, 0.99–1.51) and dentists (1.24, 1.00–1.51) had the highest risk of cancer of corpus uteri, while female beverage workers and drivers presented the lowest risk, respectively (0.68, 0.47–0.96 and 0.69 0.56–0.84) ().
Table 42. Observed number of cancer of the corpus uteri among women in the Nordic countries and standardised incidence ratios 1961–2005, by country and occupational category.
Comment
The differences between occupations with low and high risks were very small, and no real patterns emerged in our analysis. Endometrial cancer is clearly associated with obesity and the use of hormone replacement therapy, in particular when estrogens are administered without concomitant use of progestins, or when progestins are not added to estrogens during all days of the month Citation[99], Citation[100]. Smoking decreases risk. So far, no occupational or environmental risk factors for endometrial cancer have been identified, and in this sense, it is not at all surprising that we did not find work related associations.
Choriocarcinoma
There were only 127 cases of choriocarcinoma in all Nordic countries during the entire follow-up period (http://astra.cancer.fi/NOCCA/Incidence/choriocarcinoma).
No occupations were identified with high or low risk for choriocarcinoma. Many of the observations of choriocarcinoma were done in economically inactive women (54 cases) who presented a weak non-significant elevated risk, and in clerical workers (11 cases) with a presentation of non-significant decreased risk.
Comment
No previous study has identified occupational or environmental risk factors for choriocarcinoma. This is a rare type of malignancy, and epidemiological studies are scarce, but there are indications that increasing maternal age and family history increase risk. All other hypothesised risk factors (use of oral contraceptives, HPV infections, smoking and alcohol use, paternal age, parity, endogenous hormone factors, history of other cancers) are inconsistently related to risk Citation[101]. We are not aware of studies on risk of choriocarcinoma according to occupational categories. Given the way our database was constructed we could only count incidence rates by women (and not by pregnancy which would be more appropriate).
Ovarian cancer
Incidence of ovarian cancer, excluding borderline tumours, in the Nordic countries in the 1960s and 1970s was between 10 and 15 per 100 000, but rates have decreased in the last decades ().
Figure 32. Age standardised (World) incidence rates for ovarian cancer 1943–2005, by country. Modified from NORDCAN Citation[49].
![Figure 32. Age standardised (World) incidence rates for ovarian cancer 1943–2005, by country. Modified from NORDCAN Citation[49].](/cms/asset/17d99378-391e-4282-8c80-f42304171387/ionc_a_391526_f0032_b.jpg)
There was a somewhat increased risk of ovarian cancer, excluding borderline tumours, among printers SIR 1.25 (95% CI 1.11–1.41) and hairdressers (1.16, 1.05–1.27) in the study population. None of the occupational categories showed a markedly lowered risk of ovarian cancer ().
Table 43. Observed number of ovarian cancer among women in the Nordic countries and standardised incidence ratios 1961–2005, by country and occupational category.
For borderline ovarian tumours (http://astra.cancer.fi/NOCCA/Incidence/ovary-borderline), the highest SIRs were observed among women working as printers (1.50, 1.09–2.01), mechanics (1.40, 1.10–1.75), postal workers (1.24, 1.07–1.44), cooks and stewards (1.21, 1.01–1.44). The lowest SIRs were found among physicians (0.45, 0.19–0.89), laboratory assistants (0.59, 0.36–0.91) and gardeners (0.80, 0.70–0.92).
Comment
Increased risk of ovarian cancer is associated with reproductive factors leading to incessant ovulation Citation[102]. Previous studies have also found indications of elevated risks associated with aromatic hydrocarbon solvents, leather dust, man-made vitreous fibres, asbestos and diesel, gasoline and engine exhausts. Female hairdressers and printers have also been previously reported to be at increased risk of ovarian cancer Citation[87], Citation[103]. In this study the occupational variation of ovarian cancer incidence was small. In most epidemiological studies borderline ovarian tumours have the same risk factors as invasive ovarian cancer. So far no occupational study has accessed the risk of borderline tumours. The findings in our study suggest that borderline ovarian tumours may share the same occupational risk factors that have been suggested for invasive ovarian cancer.
Fallopian tube cancers
Primary fallopian tube carcinoma is very rare. In Western countries, it accounts for about 1% of all female genital malignant tumours.
Derived from six cases only, a significant fourfold risk of fallopian tube cancer was shown in smelting workers SIR 4.00 (95% CI 1.47–8.70). The other work groups with a high SIR were artistic workers, hairdressers, packers and nurses (). Farming was the occupation with the lowest risk (0.67, 0.47–0.94).
Table 44. Observed number of cancer of the fallopian tube among women in the Nordic countries and standardised incidence ratios 1961–2005, by country and occupational category.
Comment
The aetiology of fallopian tube cancer remains poorly known. The few existing studies suggest that fallopian tube cancer may have a similar aetiology as epithelial ovarian cancer. High parity may decrease risk of fallopian tube cancer Citation[104]. Women of high socioeconomic class seem also to be at increased risk in comparison to women of low social class. We found no previous studies suggesting occupational or environmental causes of fallopian tube cancer, except for a Finnish study reporting an increased risk among academic, clerical and administrative workers, as well as private secretaries, nurses, hairdressers, barbers, and book-keepers and accountants Citation[105]. The subjects included in the Finnish study overlap with the subjects included in the present study. Our study did not identify clear patterns of occupations associated with this malignancy, and the occupations associated with ovarian cancer were not the same as the occupations associated with fallopian tube cancers.
Cancer of the vulva
The incidence of cancer of the vulva has been around 1.5 per 100 000 in the Nordic countries, and it has been relatively stable over decades.
High SIRs were found in domestic assistants (SIR 1.16, 95% CI 1.04–1.30) and building caretakers. Low SIRs were seen in nurses (0.72, 0.58–0.88), “other health workers” and teachers ().
Table 45. Observed number of cancer of the vulva among women in the Nordic countries and standardised incidence ratios 1961–2005, by country and occupational category.
Comment
Cancer of the vulva is most probably related to HPV infection Citation[106]. Nothing is known about possible occupational risk factors, and no pattern related to occupational category could be seen in the present study.
Vaginal cancer
Cancer of the vagina is rare. In our study we have only 2 725 cases, not many more than male breast cancer cases.
High SIRs were found in chemical process workers (SIR 2.61, 95% CI 1.46–4.30) and building caretakers. The lowest SIRs were found in gardeners (0.73, 0.54–0.97) and teachers ().
Table 46. Observed number of vaginal cancer among women in the Nordic countries and standardised incidence ratios 1961–2005, by country and occupational category.
Comment
Cancer of the vagina is most probably related to HPV infection Citation[106]. No occupational risk factors have been identified.
Prostate cancer
Prostate cancer was the most common cancer in the present study (340 000 cases) and accounts for nearly one third of all incident cancer among men in the Nordic countries. The incidence has increased by three to fourfold since 1960 in all countries except Denmark, where it has remained considerably lower than in the other countries (). For Finland, Norway and Sweden the steepest rise was seen after 1990, around the time when testing for prostate specific antigen (PSA) became widely used.
Figure 33. Age standardised (World) incidence rates for prostate cancer 1943–2005, by country. Modified from NORDCAN Citation[49].
![Figure 33. Age standardised (World) incidence rates for prostate cancer 1943–2005, by country. Modified from NORDCAN Citation[49].](/cms/asset/8a244e33-7235-4696-92bc-8fd219205644/ionc_a_391526_f0033_b.jpg)
In the present study the highest SIRs were observed among dentists (SIR 1.22, 95% CI 1.13–1.31), administrators and religious workers (). The SIR was lowest (0.80, 0.79–0.82) among the economically inactive, followed by forestry workers and fishermen.
Table 47. Observed number of prostate cancer among men in the Nordic countries and standardised incidence ratios 1961–2005, by country and occupational category.
Comment
Autopsies have revealed that the prevalence of latent prostate cancer is very high. More than 20% of men who have reached the age of 50 have prostatic carcinoma that meets the histopathologic criteria for malignancy, but most of those cancers seem to have a low potential for growth Citation[107]. Therefore, the incidence must be interpreted in the context of prostate cancer-related diagnostic activity. This is exemplified by the Danish experience during the past three decades, where both the level of diagnostic activity and the prostate cancer incidence have been lower than in the other Nordic countries Citation[108], Citation[109]. Before the introduction of PSA testing in the late 1980s, trans-urethral resections of the prostate (TURP), widely applied as a treatment for benign prostate hyperplasia, were responsible for a large number of incidental findings of prostate cancer.
The aetiology of prostate cancer is poorly understood. Consumption of red meat and dairy products is probably associated with an increased risk, whereas tomatoes and tomato products, especially those with high lycopene content, are associated with a reduced risk Citation[110]. There are no established occupational risk factors, but cadmium, polychlorinated biphenyls and high electromagnetic fields have been suggested. The present results do not support an association with industrial occupations, as SIRs were not elevated among miners, chemical process workers, smelting workers, welders, painters or chimney sweeps. Furthermore, the contrasts between the highest and lowest SIRs were small. On the other hand, the present results support an association with diagnostic activity, as higher SIRs were observed for occupations that are related to higher social status and thus presumably better access to health care.
Testicular cancer
Incidence in the Nordic countries has been increasing over time and is nowadays about twofold in Denmark and Norway as compared with the other Nordic countries (). The rates in Denmark and Norway are among the highest in the world.
Figure 34. Age standardised (World) incidence rates for testicular cancer 1943–2005, by country. Modified from NORDCAN Citation[49].
![Figure 34. Age standardised (World) incidence rates for testicular cancer 1943–2005, by country. Modified from NORDCAN Citation[49].](/cms/asset/d8b471c4-be2e-4094-b50d-e83aeb91b064/ionc_a_391526_f0034_b.jpg)
The highest significant excess risk of testicular cancer was found in physicians (SIR 1.48, 95% CI 1.15–1.88), followed by artistic workers, religious etc. workers, printers and administrators (). The lowest risk was observed in forestry workers (0.70, 0.54–0.88), engine operators and welders.
Table 48. Observed number of testicular cancer among men in the Nordic countries and standardised incidence ratios 1961–2005, by country and occupational category.
Sixty percent of the testicular cancers in the present series are seminomas (http://astra.cancer.fi/NOCCA/Incidence/testis-seminoma). Physicians had the highest risk of seminoma with an SIR of 1.48 (95% CI 1.07–1.99), followed by artistic workers (1.47, 1.06–1.99) and religious etc. workers (1.33, 1.14–1.56). The lowest SIRs were observed among cooks and stewards (0.56, 0.29–0.98) and forestry workers (0.64, 0.47–0.86).
The occupational category of administrators was the only one with a significantly elevated SIR of testicular non-seminoma cancer (1.21, 1.04–1.42; http://astra.cancer.fi/NOCCA/Incidence/testis-non-seminoma). The only SIRs significantly below 1.0 were observed among engine operators (0.60, 0.41–0.84) and public safety workers (0.67, 0.43–0.99).
Comment
The mean age at diagnosis of testicular cancer in the Nordic countries is only 30 years, i.e., relatively low as compared with other cancer sites. Many of the cancers were diagnosed before the starting age of follow-up in the present study (30 years) and were therefore excluded from the analyses. Furthermore, for the cases diagnosed shortly after the age of 30, the duration of the occupational exposures before cancer diagnosis are relatively short. The aetiology of testicular cancer is largely unknown. Men from higher social classes seem to be more affected than men in lower social classes, although the socioeconomic differences in incidence seem to be diminishing over time Citation[111], Citation[112].
Risk factors for testicular cancer include some genetic disorders, birth defects as cryptorchidism and maldescendent testis and testicular trauma, but previous studies have not identified consistent associations between occupational exposures and testicular cancer Citation[112–114]. One of the explanations offered is the quality of the semen, which seems to decrease along with the increasing quality of life. Many of the high-risk occupations in the present study were of high social strata, but on the other hand there was an increased risk, although not statistically significant, in occupations such as chimney sweeps, shoe and leather workers and printers that may offer hints of direct occupational risk factors such as dusts.
Penile cancer
The highest rates of “cancer of other male genitals” (code 179 in ICD-7) are observed in Denmark, and half of the incidence rates in Denmark are observed in Finland. About 95% of these rare malignancies are penile cancers. There seems to be a temporal increase in Sweden, but no clear trends in other countries ().
Figure 35. Age standardised (World) incidence rates for cancer of the other male genitals 1943–2005, by country. Modified from NORDCAN Citation[49].
![Figure 35. Age standardised (World) incidence rates for cancer of the other male genitals 1943–2005, by country. Modified from NORDCAN Citation[49].](/cms/asset/09d5d061-94ae-4e1f-9ea0-5f6196b241aa/ionc_a_391526_f0035_b.jpg)
Journalists have the highest risk for cancer of the penis with an SIR 2.40 (95% CI 1.55–3.54). Other occupational categories with significant elevations are drivers, packers and sales agents. The lowest risks were observed among physicians (0.51, 0.25–0.91) and teachers ().
Table 49. Observed number of cancer of the penis among men in the Nordic countries and standardised incidence ratios 1961–2005, by country and occupational category.
Comment
Infection with oncogenic strains of human papilloma virus (HPV) is the major established risk factor for penile cancer Citation[115]. Smoking has also been identified as a risk factor for penile cancer, specifically where the HPV prevalence is low. Social class is not clearly associated with the risk of penile cancer in previous studies Citation[111], Citation[116] but the present study suggests that professions associated with high education have a decreased penile cancer risk. Earlier studies have not pointed towards any evident high-risk occupations of penile cancer and therefore, e.g., the quite strong finding of an excess risk among the Nordic journalists needs to be interpreted with caution.
Cancer of kidney and renal pelvis
Incidence of cancer of the kidney and renal pelvis in the Nordic countries varies considerably, with the highest SIR observed in Iceland (). Incidence in men is about twice the incidence in women, but the ratio varies between countries. The incidence in Sweden turned to a decrease around the year 1980 and in Finland in the 1990s, while there is still an increasing trend in Norway for both men and women.
Figure 36. Age standardised (World) incidence rates for kidney cancer 1943–2005, by country and gender. Modified from NORDCAN Citation[49].
![Figure 36. Age standardised (World) incidence rates for kidney cancer 1943–2005, by country and gender. Modified from NORDCAN Citation[49].](/cms/asset/4160cdfa-8782-49c4-add5-92d1d964e35e/ionc_a_391526_f0036_b.jpg)
Among men, waiters (SIR 1.29, 95% CI 1.04–1.57), welders, and cooks and stewards have the highest risk of kidney cancer (). The lowest significant risk was seen among forestry workers (0.77, 0.72–0.82) and farmers (0.77, 0.75–0.79). None of the female occupations showed a significantly elevated risk of kidney cancer above 1.2. The lowest significant risks were found for women working as dentists (0.56, 0.33–0.90), technical workers and laboratory assistants ().
Table 50. Observed number of kidney cancer among men in the Nordic countries and standardised incidence ratios 1961–2005, by country and occupational category.
Table 51. Observed number of kidney cancer among women in the Nordic countries and standardised incidence ratios 1961–2005, by country and occupational category.
The variation of the SIR was essentially larger when focused on only renal pelvis cancer (http://astra.cancer.fi/NOCCA/Incidence/renal-pelvis), which constitutes about one-tenth of renal cancers. High SIRs of cancer in men for renal pelvis cancer was observed among seamen (1.52, 1.26–1.85), printers (1.39, 1.09–1.74), welders (1.39, 1.05–1.80), public safety workers (1.34, 1.12–1.61) and textile workers (1.30, 1.04–1.61). Low-risk occupational groups included forestry workers (0.48, 0.36–0.62) and farmers (0.60, 0.55–0.66). Among women, a small increase in risk was found in clerical workers (1.19, 1.08–1.31) and shop workers (1.16, 1.04–1.31). Female religious etc. workers, on the contrary had the lowest significant risk (0.53, 0.29–0.89), followed by farmers (0.57, 0.45–0.72) and gardeners (0.66, 0.50–0.86).
Comment
Kidney cancer is associated with smoking and obesity Citation[117]. Exposures and occupations previously reported to be associated with kidney cancer in a consistent way include trichloroethylene and coke production Citation[118]. Workers in petroleum-related and dry-cleaning industries, as well as workers exposed to gasoline, have previously been found to have an increased risk of renal cancer in Finland. In the present study relatively little variation between occupations were seen, and no occupation presented a very high or very low SIR. In particular among women, there were no indications of any increased risk of kidney cancer associated with occupations.
Work-related risks for cancer of the renal pelvis have been observed to resemble the occupational associations that are more clearly established for bladder cancer Citation[117]. In the present study, all occupations with the highest SIR for cancer of the renal pelvis also had SIRs above 1.0 for bladder cancer ( and ), but the relative excess tended to be larger in renal cell cancer.
Table 52. Observed number of cancer of the bladder, ureter, and urethra among men in the Nordic countries and standardised incidence ratios 1961–2005, by country and occupational category.
Table 53. Observed number of cancer of the bladder, ureter, and urethra among women in the Nordic countries and standardised incidence ratios 1961–2005, by country and occupational category.
Bladder cancer
The incidence of bladder cancer in the Nordic countries is several times higher in males than in females (). There was an increasing incidence over time until the 1980s. The increase then levelled off in all countries, and even started to decline in Denmark and Finland.
Figure 37. Age standardised (World) incidence rates for cancer of the bladder, ureter and urethra 1943–2005, by country and gender. Modified from NORDCAN Citation[49].
![Figure 37. Age standardised (World) incidence rates for cancer of the bladder, ureter and urethra 1943–2005, by country and gender. Modified from NORDCAN Citation[49].](/cms/asset/b5c23f93-1816-4426-8b6b-0face5c1bc23/ionc_a_391526_f0037_b.jpg)
Among men, the highest SIRs were observed in waiters (SIR 1.50, 95% CI 1.32–1.69), chimney sweeps, hairdressers, assistant nurses, seamen, cooks and stewards, plumbers and beverage workers (). The SIRs were lowest among farmers (0.68, 0.67–0.70), forestry workers and gardeners.
The highest risks among women were found in tobacco workers (2.01, 1.49–2.65), printers, waiters, chemical process workers, sales agents and hairdressers (). Farmers (0.66, 0.62–0.72) and gardeners had SIRs significantly below 1.0.
Comment
Cigarette smoking is a well established cause of bladder cancer Citation[121]. Several chemical exposures have been associated with the development of bladder cancer. They include 4-aminobiphenyl, benzidine, coal tars and pitches, mineral oils, untreated and mildly treated 2-naphthylaminec, benz[a]anthracene, benz[a]pyrene, benzidine-based dyes, 4-chloro-ortho-toluidine, dibenz[a, h]anthracene, diesel engine exhaust, 4,4 -methylene-bis(2-chloroaniline) (MOCA) and polychlorinated biphenyls Citation[95]. Some industrial processes and occupations have also been identified as being associated with the development of bladder cancer, such as auramine manufacture, boot and shoe manufacture and repair, coal gasification, coke production, magenta manufacture, painter, rubber industry, hairdressers or barbers, petroleum refining, dry cleaning, printing processes and the textile manufacturing industry Citation[87]. Studies of bladder cancer among workers in the dyestuffs industry, and later among rubber workers, hold an important place in the history of occupational cancer Citation[122].
In the present study, occupations with several chemical exposures were listed among those with the highest SIRs. Waiters and tobacco workers were among those with the highest SIRs for lung cancer, and their excess risk for bladder cancer is therefore probably due to smoking as the major risk factor. Almost all occupational categories with a low SIR for bladder cancer also have a low SIR for lung cancer, such as gardeners and those working in agriculture and pedagogical work.
From the occupations with prior finding of excess risk, hairdressers and printers were also among the occupations with the highest SIRs for bladder cancer in the present study. A number of studies have found an excess of bladder cancer among workers exposed to polycyclic aromatic hydrocarbons. Chimney sweeps are exposed to chimney soot which is rich on these chemicals, a group of compounds well documented as carcinogenic Citation[122], Citation[123].
Skin melanoma
Incidence of skin melanoma in the Nordic countries was steadily increasing until the early 1990s, both in men and women (). After that, there was a levelling-off in Norway and Finland, but a rapid increase in Iceland.
Figure 38. Age standardised (World) incidence rates for malignant melanoma of the skin 1943–2005, by country and gender. Modified from NORDCAN Citation[49].
![Figure 38. Age standardised (World) incidence rates for malignant melanoma of the skin 1943–2005, by country and gender. Modified from NORDCAN Citation[49].](/cms/asset/fad6a7e1-9eba-4801-bacf-5ba515a35353/ionc_a_391526_f0038_b.jpg)
The highest SIRs of skin melanoma in men were observed among dentists (1.65, 95% CI 1.40–1.95), physicians, administrators, journalists, religious workers and teachers (). Rates were also above 1.20 for laboratory assistants, clerical workers, public safety workers, technical workers, postal workers, sales agents and printers. SIRs below 0.70 were seen among fishermen (0.51, 0.45–0.58), forestry workers, chimney sweeps, miners and quarry workers.
Table 54. Observed number of skin melanoma among men in the Nordic countries and standardised incidence ratios 1961–2005, by country and occupational category.
Among women, dentists also had the highest risk, with an SIR of 1.69 (1.32–2.12). Other female occupations with a significant elevated risk were public safety workers, teachers, physicians, and “other health workers” (). Engine operators (0.62, 0.38–0.96), mechanics, and wood workers had the lowest risk of skin melanoma in women.
Table 55. Observed number of skin melanoma among women in the Nordic countries and standardised incidence ratios 1961–2005, by country and occupational category.
For skin melanoma in upper limbs (http://astra.cancer.fi/NOCCA/Incidence/melanoma-upper-limbs), the highest significant SIRs in men were observed among physicians (1.78, 1.32–2.36), journalists (1.72, 1.10–2.56), religious etc. workers (1.68, 1.45–1.94), clerical workers (1.52, 1.35–1.71), administrators (1.52, 1.37–1.69) and teachers (1.48, 1.30–1.68). Fishermen and forestry workers had the lowest SIRs of 0.37 (0.21–0.60) and 0.41 (0.30–0.56), respectively. Among the women, only teachers (1.41, 1.28–1.56) and clerical workers (1.21, 1.13–1.29) presented a significantly elevated risk, while building caretakers SIR 0.75 (95% CI 0.67–0.84), and food workers SIR 0.76 (95% CI 0.58–0.99), had the lowest risk (excluding two significant SIRs based on only one observed case).
Comment
Sunburns in early ages in susceptible people are accepted as the major cause of malignant melanoma Citation[124]. We found high SIRs among occupations of relatively high socio-economic status. Occupations with the highest SIRs for malignant melanoma, dentists, physicians and journalists, also showed significantly high SIRs for “other skin cancer” ( and ). In the present study, fishermen and forestry workers ranked as the groups with the lowest risk of malignant melanoma in men. This may well be explained by the fact that these groups have constant sun exposure and are not burnt in the sun, as opposed to leisure time sun exposure which is often followed by sunburns.
Table 56. Observed number of non–melanoma skin cancer among men in the Nordic countries and standardised incidence ratios 1961–2005, by country and occupational category.
Table 57. Observed number of non–melanoma skin cancer among women in the Nordic countries and standardised incidence ratios 1961–2005, by country and occupational category.
There is little evidence in the scientific literature of an association between occupational exposures and risk of malignant melanoma, except for exposure to solar radiation Citation[118], Citation[125].
Dentists ranked with the highest SIR for malignant melanoma in both genders and have also been found to have an increased melanoma risk in previous studies in Sweden Citation[126], Citation[127]. Dentists are exposed through their daily work to lamps that emit no UV-B, and the levels of UV-A are so low that they are not considered to add to the risk Citation[128].
The highest SIR in was among male transport workers (2.82, 1.41–5.05) in Iceland. In Iceland this category includes mainly pilots. Pilots have had a chance to spend more time in sunny places (and thus having the opportunity to get sunburns) than other professions and they have 2-3-fold elevated risk of skin cancers, similarly in all Nordic countries Citation[129].
Skin melanoma in upper limbs was studied separately to reveal the possible effects of hand contacts to carcinogenic substances at work. The variation between occupations in SIRs for melanomas in the upper limbs is larger than for all melanomas, especially for men. Printers, journalists and postal workers are on the top of the list of occupations with the highest incidence of skin melanoma of the upper limbs, which might suggest that chemicals in the printing industry would increase the risk.
Non-melanoma skin cancer, excluding basal cell carcinoma
In Denmark it was not possible to separate basal cell carcinoma from non-melanoma skin cancer before 1987. Therefore, Denmark is excluded from results related to non-melanoma skin cancer. In the other Nordic countries, the incidence has been on a steady increase (). The rate was higher in males than in females, especially in Norway and Sweden.
Figure 39. Age standardised (World) incidence rates for non-melanoma skin cancer 1943–2005, by country and gender. Modified from NORDCAN Citation[49].
![Figure 39. Age standardised (World) incidence rates for non-melanoma skin cancer 1943–2005, by country and gender. Modified from NORDCAN Citation[49].](/cms/asset/5bdaebea-db76-4dd2-920e-cf48b5bdb7bd/ionc_a_391526_f0039_b.jpg)
The highest SIRs among men were observed in physicians (1.77, 95% CI 1.60–1.97), assistant nurses, administrators, dentists and military personnel (). The lowest SIRs were in forestry workers (0.67, 0.62–0.71), fishermen and smelting workers. In women the highest SIR was also in physicians, and the SIR was the same as for men (1.77, 1.31–2.33; ). Otherwise, the occupational variation in risk among the women was small. At the lower end, fisherwomen showed an SIR of 0.17 (0.00–0.97), derived only from one case, but all other statistically significant SIRs were > 0.85.
The highest SIRs for non-melanoma skin cancer in the upper limbs in men were observed among nurses (5.50, 1.79–12.83), physicians (2.52, 1.89–3.31), seamen (1.86, 1.51–2.27), dentists (1.81, 1.05–2.90) and military personnel (1.35, 1.01–1.77) (http://astra.cancer.fi/NOCCA/Incidence/non-melanoma-upper-limbs). The SIRs were lowest in forestry workers (0.60, 0.47–0.76) and food workers (0.64, 0.46–0.86). In women, the highest SIR was among dentists (3.23, 1.55–5.95), driven by the high SIR in Norway (11.03, 4.05–24.00). Female woodworkers (1.89, 1.03–3.16) and teachers (1.29, 1.08–1.53) also had a significantly elevated incidence of non-melanoma skin cancer in the upper limbs. SIRs were significantly below 1.0 among female sales agents (0.69, 0.46–0.98) and among “other workers”, i.e., economically active women not classified in any of the 52 specific occupational categories if the present study (0.60, 0.43–0.81).
Comment
Non-melanoma skin cancer and skin melanoma ( and ) have quite similar SIRs. Several chemical compounds have been identified as associated with an increased risk of skin cancer. These include arsenic and arsenic compounds, and components of oil, tar, and combustion products such as PAHs. Cumulative solar exposure is also considered a skin carcinogen, which in the context of outdoor occupations is related to work Citation[130]. In our study, however, we did not identify patterns of SIRs that could be related to either occupational solar exposure or chemical exposures. The highest SIR was observed among physicians, identically in both genders, which might indicate that there is some diagnostic bias which overrules the possible weaker effects of occupational carcinogens.
Skin cancer in the upper limbs was studied separately to reveal the possible effects of dermal exposure at work. One might speculate that the excess risk in health care personnel, seamen or military personnel might be related, e.g., to products they handle in their work, including disinfection liquids.
Eye cancer
The incidence of cancer of the eye has remained fairly stable around 1 per 100 000 in men, and a bit lower in women in all Nordic countries ().
Figure 40. Age standardised (World) incidence rates for eye cancer 1943–2005, by country and gender. Modified from NORDCAN Citation[49].
![Figure 40. Age standardised (World) incidence rates for eye cancer 1943–2005, by country and gender. Modified from NORDCAN Citation[49].](/cms/asset/50068bd9-af88-4029-b29c-2822b2095ba4/ionc_a_391526_f0040_b.jpg)
Only a modest risk variation across occupational categories was found (). For men, the only significantly elevated SIR (1.35, 95% CI 1.09–1.66) was found for transport workers, and the only significantly low SIR (0.81, 0.70–0.95) was found for economically inactive men. No occupational category came up with an increased or a decreased risk in women ().
Table 58. Observed number of eye cancer among men in the Nordic countries and standardised incidence ratios 1961–2005, by country and occupational category.
Table 59. Observed number of eye cancer among women in the Nordic countries and standardised incidence ratios 1961–2005, by country and occupational category.
Eye melanoma constitutes by far the majority of the eye cancer cases in the study series, and therefore the SIRs for eye melanoma resembled those given for eye cancer (http://astra.cancer.fi/NOCCA/Incidence/eye-melanoma). Transport work was still the only elevated occupation with an elevated SIR (1.35, 1.06–1.68). On the other end of the scale, forestry workers and gardeners showed lower SIRs (0.75, 0.56–0.99; and 0.79, 0.62–0.99, respectively) than for all eye cancers combined, because their SIR for the non-melanoma type of eye cancer was above 1.0.
Comment
Solar UV radiation might be the main cause of ocular melanoma, although this association is still disputed Citation[124]. UV radiation from manmade sources, such as sunlamps, sun beds, tanning booths, and electrical arc welding have also been reported as possibly associated with risk. Radiofrequency electromagnetic fields were associated with risk in a few studies, but the association cannot be considered as established. Occupations such as dentists, physicians, military personnel, transport workers, engine operators, mechanics, and welders have the highest SIRs in the present study which may imply exposure to some of the above factors. Farmers have an excess risk that is close to significance in both genders; this could be interpreted as a sign of an effect of solar UV exposure.
Some previous occupational studies indicated an increased risk of ocular melanoma in chemical industry employees, employees in administration and management, cooks and kitchen assistants Citation[124]. Although the number of eye cancers in our study is as high as 7 733 cases, we were not able to confirm any of the suggested excesses.
Brain cancer
The incidence of cancer of the brain and central nervous system is similar in all Nordic countries and in both genders (). There was an increase in all countries until about the mid 1990s, and later the slopes have varied from increase to slight decrease, depending on country and gender.
Figure 41. Age standardised (World) incidence rates for brain cancer 1943–2005, by country and gender. Modified from NORDCAN Citation[49].
![Figure 41. Age standardised (World) incidence rates for brain cancer 1943–2005, by country and gender. Modified from NORDCAN Citation[49].](/cms/asset/1822790d-668f-4827-b9f8-135a3281b61c/ionc_a_391526_f0041_b.jpg)
The variation of the SIRs between the occupations was relatively small. In men, the highest SIRs were observed among physicians (SIR 1.32, 95% CI 1.16–1.49) and “other health and medical workers” (). The SIR was lowest among forestry workers (0.84, 0.78–0.91). In women, the highest significant SIR was in public safety and protection work (1.39, 1.02–1.85) and lowest for “other health and medical workers” (0.89, 0.82–0.98; ).
Table 60. Observed number of brain cancer among men in the Nordic countries and standardised incidence ratios 1961–2005, by country and occupational category.
Table 61. Observed number of brain cancer among women in the Nordic countries and standardised incidence ratios 1961–2005, by country and occupational category.
In cases classified as gliomas (http://astra.cancer.fi/NOCCA/Incidence/brain-glioma) in the present data set (35% of all cases), the SIRs in males were highest among “other health workers” (1.30, 1.02–1.64), and military personnel (1.24, 1.06–1.44). Low SIRs were among forestry workers (0.78, 0.70–0.88), fishermen (0.81, 0.68–0.96) and seamen (0.82, 0.71–0.96). In women, the highest SIR was among physicians (1.55, 1.02–2.25), while there were no occupations with an SIR significantly below unity.
In meningeoma (29% of all cases: http://astra.cancer.fi/NOCCA/Incidence/brain-meningeoma), the highest SIRs based on at least 15 observed cases among men were in assistant nurses (1.67, 0.93–2.75), physicians (1.53, 1.13–2.01) and “other health workers” (1.50, 1.05–2.06). The lowest SIRs were in “other construction workers” (0.80, 0.69–0.93), and forestry workers (0.82, 0.69–0.98). In women, the only occupations that came up with somewhat elevated SIRs were technical, chemical, physical and biological workers (1.21, 1.01–1.46) and teachers (1.12, 1.03–1.20), while none of the significant SIRs were below 0.85.
Comment
To date, no lifestyle or environmental risk factors for brain cancer have been identified, except for ionising radiation Citation[131]. Exposure to electromagnetic fields and to mobile cell phones have been hypothesised as possibly increasing brain cancer risk, but results from large studies have not confirmed any associations. Chemicals suspected to be associated with risk in animal models are epichlorohydrin and non-arsenical insecticides Citation[118]. In this study we did not find evidence of an association with occupational exposures.
In the present data set, only about one-third of the cases were classified as gliomas and one-fourth as meningiomas. These low proportions indicate problems in finding comparable code definitions over the Nordic countries; e.g. only 9% of the Danish cases were included in the category of gliomas. If this type of classification problem is not related to occupation it does not bias SIR estimates. The other potential source of bias may be the diverging degree of diagnostic precision; this may well explain clustering of medical work occupations on the top of the list of the highest SIRs for meningeoma.
Thyroid cancer
The incidence of thyroid cancer in the Nordic countries is twofold higher in women than in men (). The two most common histological types are papillary (70%) and follicular carcinoma (10–20%). The incidence of thyroid cancer is by far the highest in Iceland. There was a rapid increase in Finland until the mid 1990s but the rates in Finland are still only about one half of the rates in Iceland.
Figure 42. Age standardised (World) incidence rates for thyroid cancer 1943–2005, by country and gender. Modified from NORDCAN Citation[49].
![Figure 42. Age standardised (World) incidence rates for thyroid cancer 1943–2005, by country and gender. Modified from NORDCAN Citation[49].](/cms/asset/7cddaea9-5122-4b4e-ad98-93c669c4e658/ionc_a_391526_f0042_b.jpg)
We found quite modest and inconsistent variation in risk of thyroid cancer between occupations ( and ). Male fishermen in Iceland and Norway had elevated SIRs, but not fishermen in the other countries, resulting in an overall SIR of 1.32 (95% CI 1.07–1.62). The other significant elevated SIRs among men were in public safety work and clerical work. Female farmers had an SIR of 1.18 (1.07–1.30).
Table 62. Observed number of thyroid cancer among men in the Nordic countries and standardised incidence ratios 1961–2005, by country and occupational category.
Table 63. Observed number of thyroid cancer among women in the Nordic countries and standardised incidence ratios 1961–2005, by country and occupational category.
There was an elevated risk of the papillary type of thyroid cancer in fishermen (1.70, 1.27–2.23; http://astra.cancer.fi/NOCCA/Incidence/thyroid-papillary) and seamen (1.43, 1.04–1.91) while the SIRs for the follicular type were below unity, for the seaman even significantly so (http://astra.cancer.fi/NOCCA/Incidence/thyroid-follicular). Significant excess risks for follicular thyroid cancer were observed among male “other health workers (3.24, 1.19–7.04), public safety workers (1.95, 1.14–3.12) and mechanics (1.47, 1.11–1.91), and among female glass etc. workers (2.11, 1.29–3.26).
Comment
Childhood exposure to ionising radiation is one of the few risk factors that are clearly associated with thyroid cancer, while radiation in adulthood has not been linked convincingly to thyroid cancer Citation[132]. Several studies have indicated that an increased intake of iodine is associated with a larger risk, especially for the papillary type, but a reverse association with iodine intake for the follicular type. Fishermen and seamen are assumed to consume more oceanic fish rich of iodine than others, and thus the increased risk of papillary thyroid cancer and decreased risk of follicular thyroid cancer among them are in line with the iodine theory. Wood processing has been suggested as a risk factor; in the present study the SIR among the wood workers was about 1.0.
Changes in diagnostic activity may at least partly explain the observed changes in the incidence of thyroid cancer in Iceland.
Cancers of other endocrine glands
Cancers of endocrine glands other than the thyroid gland are so rare that they have hardly ever been included in epidemiological studies or even routine tabulations as separate entities. Therefore, there is no published information about the time trends of these cancers in the Nordic countries. We do not publish tables on SIRs for each combination of gender, country and occupation as we do for more common cancers, because the majority of the strata would show zero number of cases. Those who want to check the exact numbers of cancer related to a given occupational category are advised to have a look at the appendix tables on the internet (http://astra.cancer.fi/NOCCA/Incidence/endocrine-glands)
Glandula suprarenalis
There were 1 764 incident cases of cancer of the suprarenal gland included in the study. Among men, the incidence was significantly elevated among smelting workers (SIR 1.85, 95% CI 1.18–2.75), packers (1.72, 1.20–2.39), engine operators (1.55, 1.05–2.19) and woodworkers (1.33, 1.03–1.69). Male farmers had a deficit risk (0.77, 0.61–0.95). Shoe and leather workers had an excess risk among women (3.38, 1.36–6.96) based on seven cases, and building caretakers had an SIR of 1.42 (1.07–1.83), based on 58 cases. Female sales agents had a low risk (0.23, 0.03–0.84).
Glandula parathyrioeda
Only 159 incident cases of parathyroid cancer were included in the study, 41 in men and 118 in women. There were no statistically significant excess or deficit risks.
Thymus
In total, 680 incident cases of thymus cancer were included in the study. Men in the occupational category including glass makers and several other similar occupations, had an excess risk (SIR 2.23, 95% CI 1.07–4.10), and mechanics had a deficit risk, SIR 0.60 (95%CI 0.34–0.99). No significant variation in risk was found across the occupational categories of women.
Hypophysis
There were 216 cases of cancer of the hypophysis. Beverage workers had an SIR of 16.60 (95% CI 2.01–59.95), however based on only two cases, and sales agents an SIR of 2.31 (1.11–4.25), based on ten cases. There were no significant SIRs among women.
Corpus pineale
Only a total of 48 incident cases of corpus pineale were included in the present study. Swedish and Danish observations were missing, and there were no cases diagnosed in Finland. The only significant excess risk, SIR of 5.48 (1.13-16-01) among “other construction workers” is based on three cases and must be interpreted as a chance find.
Comment
We could not identify studies indicating environmental or occupational causes of any of these rare tumours in the literature. Hence, all observations made in our data set should be interpreted as suggestive or chance findings to be confirmed or rejected on the basis of cumulative information from other parts of the world.
Bone cancer
Bone cancer is rare, and the disease has been on the decrease for both men and women in the Nordic countries (), possibly due to improving means of separating bone metastases from primary bone cancers. It is now between about 1 per 100 000 in men and one-third less in women
Figure 43. Age standardised (World) incidence rates for bone cancer 1943–2005, by country and gender. Modified from NORDCAN Citation[49].
![Figure 43. Age standardised (World) incidence rates for bone cancer 1943–2005, by country and gender. Modified from NORDCAN Citation[49].](/cms/asset/04f22d02-d79a-4128-9c1d-9ceb594a340e/ionc_a_391526_f0043_b.jpg)
“Other health workers” had an excess risk of bone cancer in men (SIR 2.25, 95%CI 1.29–3.66). Seamen, military personnel and public safety workers were also at excess risk (). The only category with a significantly decreased SIR was “other workers” (SIR 0.75, 0.56–0.99). There were no significant SIRs in women, except the one based on zero observed cases among woodworkers (95% CI 0.00–0.90; ).
Table 64. Observed number of bone cancer among men in the Nordic countries and standardised incidence ratios 1961–2005, by country and occupational category.
Table 65. Observed number of bone cancer among women in the Nordic countries and standardised incidence ratios 1961–2005, by country and occupational category.
About every second one of the bone cancers in the present study series was of chondrosarcoma type (http://astra.cancer.fi/NOCCA/Incidence/bone-chondrosarcoma). Men in “other health work” had an an excess SIR of chondrosarcoma (2.97, 1.28–5.85), and the SIR was also elevated among military workers (2.88, 1.68–4.61), seamen (1.92, 1.05–3.22) and drivers (1.45, 1.09–1.88). In women, the only significant finding was among technical etc. workers (2.60, 1.12–5.12); this finding was dominated by the high SIR in Sweden.
Comment
Previous studies have indicated that the main environmental factors for bone cancer are ionising radiation and chemotherapy. Radium dial painters exposed to radium 226, 228, and occupational and environmental exposure to plutonium in and around nuclear weapons factories had an increased risk Citation[133]. Exposure to ionising radiation and other physical agents such as gamma rays, neutrons and radon gas can be observed in radiologists, technologists, nuclear workers, underground miners, plutonium workers, clean-up workers following nuclear accidents and aircraft crew. In the present study we found an excess risk of osteosarcoma among health care workers, military workers and seamen. It would deserve further investigation to establish if these are associated with radiation exposure.
Soft tissue cancer
There has been a slight increase in the incidence of cancer of the soft tissue during the latest decades, but rates are still very low and similar (incidence around 2 per 100 000) in both genders and all Nordic countries ().
Figure 44. Age standardised (World) incidence rates for soft tissue cancer 1943–2005, by country and gender. Modified from NORDCAN Citation[49].
![Figure 44. Age standardised (World) incidence rates for soft tissue cancer 1943–2005, by country and gender. Modified from NORDCAN Citation[49].](/cms/asset/f76473b3-3e09-4b03-a15f-91c86dda178d/ionc_a_391526_f0044_b.jpg)
Among men, the only occupational categories with significantly elevated SIRs in the combined Nordic data were building caretakers (SIR 1.30, 95% CI 1.08–1.56) and military personnel (1.27, 1,01–1.59), but there were significant single-country excesses among Norwegian welders, Danish men in the category of “religious workers etc.”, Finnish gardeners and Swedish public safety workers (). Fishermen and packers had SIRs significantly below 1.0. No occupational category was either at an excess risk or a deficit risk among women ().
Table 66. Observed number of soft tissue cancer among men in the Nordic countries and standardised incidence ratios 1961–2005, by country and occupational category.
Table 67. Observed number of soft tissue cancer among women in the Nordic countries and standardised incidence ratios 1961–2005, by country and occupational category.
The data set included 1328 cases in the subgroup of fibrosarcoma (http://astra.cancer.fi/NOCCA/Incidence/soft-tissue-fibrosarcoma) in men and 1 174 in women from Finland, Iceland, Norway and Sweden. The only significant excess in men was among building caretakers (1.71, 1.12–2.50) and in women among sales agents (1.62, 1.01–2.45).
The only significant four-country SIR based on the 1 326 cases of liposarcoma (http://astra.cancer.fi/NOCCA/Incidence/soft-tissue-liposarcoma) in men was among the public safety workers (1.64, 1.10–2.34), but Swedish artistic workers and building caretakers also had a significant, about twofold, excess of liposarcoma. In women (1 076 cases) there were no significant SIRs for liposarcoma in any occupational category in any country.
Comment
Soft tissue sarcoma is a rare disease of the mesenchymal tissue other than bone and cartilage Citation[134]. Epidemiological studies have suffered from problems of misclassification of histology, since the histopathological classification of this cancer in cancer registries is often inconsistent and pathologists frequently disagree on histologic subtypes.
Previous studies have indicated that exposure to phenoxy herbicides, dioxins, and pesticides may be associated with an increased risk, but these studies are rather inconsistent Citation[134]. Exposure to vinyl chloride has been suggested as being associated with the development of soft tissue sarcoma. Exposure to radiation as therapy is a well-established cause of secondary soft tissue sarcoma, while tobacco use, exogenous hormonal factors and diet have only been inconsistently associated with risk.
Non-Hodgkin lymphoma
Up to the 1990s, the incidence of non-Hodgkin lymphoma increased in all Nordic countries more rapidly than that of any other form of cancer (). After that the increase has stopped Citation[135]. Incidence in men is higher than in women in all countries, and Finland has the highest level.
Figure 45. Age standardised (World) incidence rates for non-Hodgkin lymphoma 1943–2005, by country and gender. Modified from NORDCAN Citation[49].
![Figure 45. Age standardised (World) incidence rates for non-Hodgkin lymphoma 1943–2005, by country and gender. Modified from NORDCAN Citation[49].](/cms/asset/2f86b3f6-020b-4e9a-bb51-ab61fefdcf70/ionc_a_391526_f0045_b.jpg)
Variation in the incidence of non-Hodgkin lymphoma over occupational categories was small ( and ). Male physicians had the highest significant SIR (1.22, 95% CI 1.08–1.39) and forestry workers the lowest one (0.86, 0.80–0.93). Among women, plumbers had the highest risk of Non-Hodgkin lymphoma (5.39, 1.11–15.76), however based on three cases only. Postal workers had the lowest significant SIR (0.89, 0.81–0.98).
Table 68. Observed number of other/unknown site among men in the Nordic countries and standardised incidence ratios 1961–2005, by country and occupational category.
Table 69. Observed number of other/unknown site among women in the Nordic countries and standardised incidence ratios 1961–2005, by country and occupational category.
Comment
Known risk factors for non-Hodgkin lymphoma include immunosuppression, autoimmunity, HIV infection, and some specific viruses, but they explain only a small fraction of the cases Citation[136]. Other possible risk associations with food products, medications, pesticides and hair dyes have been investigated, but the results are inconsistent Citation[137]. Some carcinogenic substances found in working places may be associated with the development of non-Hodgkin lymphoma. These include 2,3,7,8-Tetrachlorodibenzopara-dioxin (TCDD), non-arsenical insecticides, Tetrachloroethylene, and Trichloroethylene. These exposures are not easily identified in the occupational categories used here. Occupations such as hairdressers or barbers have also been associated with the development on non-Hodgkin lymphoma in some studies Citation[87], Citation[103]. In the present study, the SIR among female hairdressers was 1.00, and among male hair dressers 0.99.
An about 20% excess among both male and female physicians might indicate that accurate diagnostics of non-Hodgkin lymphoma is sometimes challenging. The rapidly changing classifications also made it difficult to find subcategories of non-Hodgkin lymphoma that would have been comparable over decades and countries, although there may well be work-related factors that are only relevant in some of the numerous sub-types of non-Hodgkin lymphoma.
Hodgkin lymphoma
The incidence of Hodgkin lymphoma in the Nordic countries is slightly higher in males than in females, and rates have been rather stable over time ().
Figure 46. Age standardised (World) incidence rates for Hodgkin lymphoma 1943–2005, by country and gender. Modified from NORDCAN Citation[49].
![Figure 46. Age standardised (World) incidence rates for Hodgkin lymphoma 1943–2005, by country and gender. Modified from NORDCAN Citation[49].](/cms/asset/1bb97000-f886-45ef-94dd-36cc917dcf22/ionc_a_391526_f0046_b.jpg)
Male bricklayers had the highest risk of Hodgkin lymphoma, SIR 1.33 (95% CI 1.04–1.68; ), while electrical workers represent the group with a significant decreased risk (0.83, 0.71–0.98).
Table 70. Observed number of non-Hodgkin lymphoma among men in the Nordic countries and standardised incidence ratios 1961–2005, by country and occupational category.
Among women (), the only findings worth mentioning are the borderline significant excess risk among farmers (1.21, CI 1.00–1.45) and the decreased risk among drivers (0.14, 0.00–0.80).
Table 71. Observed number of non-Hodgkin lymphoma among women in the Nordic countries and standardised incidence ratios 1961–2005, by country and occupational category.
Comment
Epstein Barr virus, immunodeficiency conditions and infectious mononucleosis have been implicated in the aetiology of Hodgkin lymphoma Citation[138]. Occupational studies have suggested that occupations related to woodworking industries and certain chemical exposures are related to risk Citation[139]. We found no clear evidence of variation in risk according to occupation.
Multiple myeloma
For multiple myeloma, incidence rates are rather similar between genders and in all Nordic countries (). There was an increase in rates until the late 1980s, which then levelled off or even turned into a decrease, especially in Finland.
Figure 47. Age standardised (World) incidence rates for multiple myeloma 1943–2005, by country and gender. Modified from NORDCAN Citation[49].
![Figure 47. Age standardised (World) incidence rates for multiple myeloma 1943–2005, by country and gender. Modified from NORDCAN Citation[49].](/cms/asset/f6f66bf0-3372-4397-9204-89154d7c4d66/ionc_a_391526_f0047_b.jpg)
The variation between occupational categories in the incidence of multiple myeloma was small ( and ). A weak increase in the risk of multiple myeloma was observed among male farmers, SIR 1.07 (95% CI 1.03–1.11) and a lowered risk among male printers (0.80, 0.68–0.95).
Table 72. Observed number of Hodgkin lymphoma among men in the Nordic countries and standardised incidence ratios 1961–2005, by country and occupational category.
Table 73. Observed number of Hodgkin lymphoma among women in the Nordic countries and standardised incidence ratios 1961–2005, by country and occupational category.
Female farmers also had a somewhat increased risk (1.14, 1.05–1.24), while no occupation showed a decreased risk among women.
Comment
Previous studies have found associations between multiple myeloma and work in the production of non-arsenical insecticides, pest control, agricultural work and flour and grain mill work Citation[87]. In our study, we found a modest but consistent excess risk among farmers in both genders and in all countries except Denmark.
Leukaemia
Incidence rates for leukaemia are higher among men than among women in all Nordic countries and have been quite stable over the latest decades ().
Figure 48. Age standardised (World) incidence rates for leukaemia 1943–2005, by country and gender. Modified from NORDCAN Citation[49].
![Figure 48. Age standardised (World) incidence rates for leukaemia 1943–2005, by country and gender. Modified from NORDCAN Citation[49].](/cms/asset/2b5e4748-97e1-4d4b-a73d-e70a652e5460/ionc_a_391526_f0048_b.jpg)
Generally, there was only minor variation in the incidence of leukaemia between the occupations ( and ). Significantly elevated SIRs for leukaemia were seen among male public safety workers (1.11, 95% CI 1.02–1.21), sales agents and clerical workers. The SIR was decreased among launderers (0.71, 0.50–0.99), fishermen and forestry workers. The risk of 0.28 (0.03–0.99) among male nurses was derived from two cases only. There were no elevated leukaemia risks according to occupation among women. A slightly decreased SIR (0.91, 0.84–0.98) was observed in textile workers.
Table 74. Observed number of multiple myeloma among men in the Nordic countries and standardised incidence ratios 1961–2005, by country and occupational category.
Table 75. Observed number of multiple myeloma among women in the Nordic countries and standardised incidence ratios 1961–2005, by country and occupational category.
A somewhat elevated SIR of chronic lymphocytic leukaemia (CLL) was observed among male farmers (1.09, 1.03–1.14), while reduced risks were observed among “other health workers” (0.59, 0.37–0.89) and seamen (0.80, 0.66–0.96). No female occupation showed any significantly elevated or reduced risk of CLL (http://astra.cancer.fi/NOCCA/Incidence/CLL).
The risk of acute myeloid leukaemia (AML) in men was highest among drivers (1.16, 1.07–1.27), and sales agents (1.11, 1.01–1.22) also had a somewhat elevated risk. The lowest risks were observed among seamen, (0.79, 0.64–0.96) and forestry workers (0.85, 0.73–0.99). None of the female occupations had a significantly elevated risk, while textile workers were observed to have a lowered risk (0.83, 0.72–0.96; http://astra.cancer.fi/NOCCA/Incidence/AML).
Comment
Leukaemia comprises a heterogeneous group of acute and chronic myelogenous and lymphocytic malignancies originating in different cells of the haematopoietic system. Exposure to ionising radiation is a common aetiological factor for all types of leukaemia. Several chemical and physical exposures occurring in occupational settings have been previously reported as associated with an increased risk of leukaemia. Such exposures with substantial evidence include benzene, ethylene oxide, ionising radiation (including x-rays, gamma rays, neutrons, and radon gas and its decay products) 1,3-butadiene, non-arsenical insecticides Citation[87], work in boot and shoe manufacturing and repair, the rubber industry and petroleum refining In this study there was very little variation in SIRs between occupational categories, and for instance, the incidence of leukaemia in shoe and leather work was 6–7% below the average in both genders.
There was a small (about 10%) excess risk of CLL among farmers and clerical workers in both genders which is similar to the effect found in some previous studies Citation[140], Citation[141].
Environmental and occupational risk factors for AML include exposure to toxic chemicals present in tobacco smoke, emissions from industrial operations and petroleum refinery waste dumps Citation[142], as well as high dose radiation exposure, exposure to high dose benzene and prior treatment with chemotherapeutic agents Citation[143]. Occupational activities such as wood processing and agricultural work and jobs with high levels of exposure to electromagnetic fields, in particular the extremely low range (0–300 Hz), have also been associated with AML in earlier studies Citation[144], but it is hard to observe any effects of these factors from the present results. Drivers and sales agents, who had significantly elevated SIRs for AML in the present study have also been previously reported to have a somewhat elevated risk of AML Citation[143], Citation[145].
Mycosis fungoides
Mycosis fungoides is a cutaneous T-cell lymphoma which represents a spectrum of lymphoproliferative disorders that affect the skin. It is a rare cancer with a total of 3 634 cases included in the present study.
Cooks and stewards represented a high risk group among men with an SIR of 2.65 (95% CI 1.37–4.63). Gardeners (0.67, 0.49–0.89) were at the bottom together with “other construction workers” and farmers (). In women, farmers were at a deficit risk (0.36, 0.15–0.75; ).
Table 76. Observed number of leukaemia among men in the Nordic countries and standardised incidence ratios 1961–2005, by country and occupational category.
Table 77. Observed number of leukaemia among women in the Nordic countries and standardised incidence ratios 1961–2005, by country and occupational category.
Comment
The aetiology of mycosis fungoides is poorly understood, and infectious agents may be involved. Previous occupational studies have indicated a possible association with men working in the industries of non-metallic mineral products, wholesale trade, glass formers, potters, and ceramics workers and technical salesmen. A high risk was found for female employees in the sector of pulp paper manufacture, government executives and railway and road vehicles loaders Citation[146].
An earlier study also indicated an increased risk among women in Sweden working in agriculture and textile industries, housekeepers, and post office employees Citation[147]. The present study did not pick up any of the occupational categories reported to have had excess risk in the earlier studies.
Other and unknown cancer sites
The category of “other and unknown cancers” (199 in ICD–7) includes few cancers of other specific organs not included in any other ICD category, but mainly cancers with an unspecified primary site. Incidence of cancers classified to this category has been quite stable over several decades and similar in both genders, e.g. in Finland about 5 and in Sweden about 7 per 100 000 person-years Citation[148], Citation[149]. The proportion of an unknown primary site was 2–4% in all Nordic countries in 1998–2002 Citation[150].
Tobacco workers had the highest non-significant SIR (1.73, 95% CI 0.86–3.09) and waiters the highest significant SIR (1.49, 1.19–1.84) of unspecified cancer among the men, followed by cooks and stewards, hairdressers, seamen and assistant nurses. The SIR was low among the physicians (0.68, 0.57–0.82), teachers and farmers ().
Table 78. Observed number of mycosis fungoides among men in the Nordic countries and standardised incidence ratios 1961–2005, by country and occupational category.
In women (), significantly high SIRs were observed among “other construction workers” (1.45, 1.02–2.00; dominated by the finding in Finland), chemical process workers, and waiters. The SIR was low among physicians (0.66, 0.43–0.97), artistic workers, teachers, and nurses.
Table 79. Observed number of mycosis fungoides among women in the Nordic countries and standardised incidence ratios 1961–2005, by country and occupational category.
Comment
In a previous study in Finland covering the 1970s and early 1980s, there appeared to be two types of persons with an excess of unspecified cancers: persons with a low level of awareness about cancer who may have gone to the doctor with an already advanced stage of disease, consequently receiving less specialised medical care and a delayed diagnosis, and persons with a predominantly high living standard who purposely did not want to have their cancer diagnosed Citation[6]. It was also reported that the socioeconomic differences in the incidence of unspecified cancer were decreasing over time.
In the present study series this is not as evident, apart from the finding related to physicians who had the lowest SIR in both genders. Otherwise, most of the categories with the highest and lowest incidence of unspecified cancers also have similar rates for all cancers combined (see next chapter). Hence, the likelihood of getting a proper cancer diagnosis, or having the cancer diagnosed before it is so spread in the body that the origin cannot be defined any more, seems not to vary markedly between most occupations.
All cancer sites combined
The age-adjusted incidence of all cancers combined (excluding non-melanoma skin cancer) has been slowly increasing for several decades in all Nordic countries (). The speed of growth has been highest in Norway and lowest in Finland. The rates for men in Finland have been markedly higher than for women, while in the other Nordic countries there is no large difference between the gender-specific rates.
Figure 49. Age standardised (World) incidence rates for all malignant neoplasms 1943–2005, by country and gender. Modified from NORDCAN Citation[49].
![Figure 49. Age standardised (World) incidence rates for all malignant neoplasms 1943–2005, by country and gender. Modified from NORDCAN Citation[49].](/cms/asset/5c722f43-fa38-4022-a1f6-a4437526e327/ionc_a_391526_f0049_b.jpg)
In men, high SIRs were observed among waiters (1.48, 95% CI 1.43–1.54), beverage manufacture workers, tobacco manufacture workers, seamen, chimney sweeps and cooks and stewards. The SIRs were lowest among domestic assistants (0.79, 0.66–0.95), farmers, forestry workers and gardeners. The variation in incidence between Danish men was larger and among Finnish men smaller than in the other Nordic countries ().
Table 80. Observed number of all malignant neoplasms among men in the Nordic countries and standardised incidence ratios 1961–2005, by country and occupational category.
In women, tobacco manufacture workers had the highest SIR (1.27, 1.19–1.35); all other significant SIRs were below 1.15 (). The rates were lowest among female seafarers (0.58, 0.37–0.87) and bricklayers. From the more common occupations among the women, farming and gardening were associated with the lowest rates.
Table 81. Observed number of all malignant neoplasms among women in the Nordic countries and standardised incidence ratios 1961–2005, by country and occupational category.
Comment
The group of all cancer combined includes numerous cancer diseases with different aetiologies. The relative large variation in occupation-specific incidence rates indicates that risk-increasing factors may cumulate in some occupational categories. Among occupations with the highest SIRs in men were occupations such as waiters, beverage workers and tobacco workers that have also been seen at the top of the list of SIRs for alcohol and tobacco related cancers. On the other hand, there were also many occupations with known or strongly suspected direct occupational exposures such as chimney sweeps, plumbers, hairdressers and printers. At the bottom of the list there are occupations related to farming and forestry which have a low exposure to industrial agents.
In women, the top of the list is more mixed. There were industrial occupations with relatively high SIRs, e.g., tobacco workers, printers and plumbers, but many occupations in administration and technical work also showed high SIRs. The collection of occupations with a low overall cancer risk is also quite a mixture, with a likely under representation of occupations with a high degree of education. All of the lowest-risk occupations among the women are “male occupations” with quite heavy physical demands.
Discussion
Validity of census occupation
Correct classification of exposure categories is crucial in any study on work-related cancer. In the present study, the information on occupations was based on national censuses from 1960–1990. The current population register systems allow tabulation of the entire population by sex, age, and several other demographic variables and have therefore diminished the incentive to undertake traditional censuses. Unfortunately, the detailed information on occupation and industry for each citizen may be difficult to obtain from registers with similar precision as they were collected from census questionnaires. We have therefore restricted the present study to the census populations for whom high quality data on occupation are available.
Denmark became the first country in the world to abolish traditional censuses. In the first register-based census in Denmark from 1981 the information on occupation came primarily from tax-forms, and 5% of the work force ended up being registered only as wage-earners without further information Citation[2]. The Danish part of the present study is therefore based solely on the 1970 census. Finland was the second country to skip traditional censuses, but according to internal quality controls by Statistics Finland a sufficiently high quality of the occupational information was ensured when the transition took place in 1990. The present study therefore includes data from the 1970, the 1980, and the 1990 censuses in Finland. Iceland has a long census tradition, but the only census available with computerised data is from 1981. Sweden kept the traditional censuses throughout the 20th century, and the present study includes data from the 1960, 1970, 1980 and 1990 censuses. For Norway the censuses of 1960, 1970, and 1980 have been included, as the 1990 census included only a sample of the Norwegian population.
In Norway control surveys based on personal interviews with random samples of the census population were undertaken both in 1970 and in 1980. Compared with the census, the interview data gave similar occupational codes on the two digit level of the NYK-code. Compared with the census, overall 2.1% more men and 13.8% more women in the survey reported to have more than 500 hours of income producing work and should have been classified as economically active. The main deficits in the census data came from agriculture and public and private services Citation[151].The validity was considered to be equally good for the 1960 census Citation[41].
In Sweden, a control study of the 1970 census data showed an underreporting of economic activity in the census data for persons with 20 or less hours of work per week coming especially from women in agriculture Citation[152]. The distributions by the main occupational categories for those recorded economically active were fairly similar in the census and control surveys. The accuracy of the occupational codes used in Finland has also been proven to be high Citation[153]. In Denmark, no coding errors were detected in a sample of 1970 census questionnaires retrieved for a nested case-control study Citation[154]. In general, the validity studies indicate that the classification by occupation in the Nordic censuses has been reasonably accurate, but that economic activity has been somewhat underestimated, especially among the women.
We grouped the economically active population into relatively specific categories that are large enough to get stable numbers of observed cases and that can be defined similarly in different coding systems in the countries. From the point of view of work place exposures, some of the occupational categories are heterogeneous and may therefore hide occupational risks. For example, nickel smelting workers, who are known to have about a 30-fold excess risk of nasal cancer Citation[80], are here grouped together with other occupations in the category of smelters and metal foundry workers, and the SIR for nasal cancer in this broad group was only 1.20 (95% CI 0.93–1.53; ). Still, a major part of the known associations between occupations and specific cancer diseases was seen in the present study.
Occupational mobility
Occupational classification in this study is based on the occupation recorded in the first census the person participated in the age range of 30–64 years. The extent to which the first census occupation reflects the lifetime experience varies considerably across occupational categories. We estimated the occupational stability proportion of individuals who had the same occupational category (of the 53 categories defined for the present study) in the first and second census available to us, i.e., 1960 and 1970 censuses in Norway and Sweden, and 1970 and 1980 censuses in Finland (). In general, stability was higher among men than women and highest in occupational categories where a long education is required such as physicians, dentists and teachers. Nurses were more likely to keep their occupation than assistant nurses, except in Sweden, where female assistant nurses also had a high rate of staying in the occupation. Hairdressers in all countries and of both genders tended to remain in the occupation. Among men, the category of domestic assistants was the least stable. Among women, the least stable categories were occupations with male dominancy, and occupations requiring little specific education.
Table 82. Number of persons and proportion who stayed in their occupation between censuses, Finland 1970–1980 census, Norway and Sweden 1960–1970 census, by gender and occupational category. Only occupations N > 10 are included.
There are several reasons for low occupational stability rates:
The number of employed persons in an occupational category may have decreased in the society as a whole. This applies, for instance, to agricultural work (farmers) or industrial plants which were closed down, such as asbestos mines in Finland Citation[155];
Individual career development may have moved workers to leading positions. To avoid the occupational misclassification related to the beginning of the work career, the follow-up in our study started with the occupation held at the age of 30 or older;
The changes in coding practises between subsequent censuses could have influenced classifications. This is believed to have only a minor impact, except for some new occupations. In terms of traditional occupational exposures, it is assumed that the movement has been from the more to the less exposed categories.
In Denmark, a comparison of subsequent birth cohorts in one census indicate that at least one fourth of men working in manufacture, construction and transport in 1970 had a background in agriculture Citation[156]. A background in agriculture is expected to affect the cancer pattern of such occupational categories, as the cancer risk of farmers is in general low and as farmers normally had lower tobacco consumption than other occupational categories.
Even for those who remained in the same occupation, job conditions may have changed considerably. Although in some occupations where the physical demands are still high, for instance mining, forestry, fishing, agriculture, construction, cleaning and some health care work, the physical work load has generally diminished with the automatisation of industrial processes. Physical activity during leisure time has to be considered in addition to physical activity at work when it comes to interpreting the occupational differences in, e.g., the incidence of breast and colon cancers.
In Finland, occupation specific SMRs were calculated in two ways: first based on one single census (1980) and then restricted to persons who had stayed in the same occupation in subsequent censuses. The SMR estimates were practically identical Citation[157]. We believe that the present results based on occupation in one census give, in most instances, similar results that we would have gotten from categorisations based on occupational titles kept in several censuses. This phenomenon will be studied in detail in specific NOCCA studies in restricted data sets for which we have data on several censuses available.
Validity of cancer incidence data
Nordic countries are well known of their long tradition of high-quality population-based cancer registration Citation[158]. In Denmark, several independent studies indicate a good coverage of the cancer registration from the very beginning in 1943. Comparison between 1977 data from the newly established hospital discharge register and the cancer register showed that 95% of the cancer cases in the hospital discharge register were also known in the cancer register, with the deficits seen for cancers of the digestive organs, breast, female genital organs and lymphatic and haematopoietic tissue Citation[159]. In 1997, the registration of cancer in Denmark was moved from the Danish Cancer Society to the National Board of Health to be part of other national registration activities and based on electronic data capture. The change caused severe delays both in the cancer registration process and the mortality reporting, and in May 2008 the newest statistics were from 2003. The effects of the system change on the coverage and accuracy are not yet known.
Cancer registration in Norway has been compulsory from 1953, and was from the beginning based on a combination of reporting from clinical and pathology departments Citation[160]. A comparative study was undertaken for two counties in 1976 between the cancer register data and data retrieved from the Economic and Medical Information System. The study showed an overall completeness of the cancer register of 98%, with the deficit coming in particular from leukaemia and multiple myeloma Citation[192]. For all cancers registered since 1953, 86.5% are histologically verified, and 1.3% of the diagnoses are based on death certificates alone Citation[161].
Cancer registration in Finland is, like in Norway, based on a combination of reporting from clinical and pathological departments, and the registration has been compulsory since 1961. A linkage was made between the data from the cancer register and from the national hospital discharge register for 1985–1988. The agreement was good (about 99%) for most diagnostic groups, but showed about a 10% underreporting in the cancer register for benign neoplasms of the central nervous system, mainly among elderly people, chronic lymphatic leukaemia and multiple myeloma Citation[162]. The main problem was slowness of reporting of these diseases; most of them were later reported via the normal registration procedure. The same phenomenon has been reported from other Nordic countries, e.g. Denmark Citation[163] and Iceland Citation[164].
The Icelandic Cancer Registry, which was founded in 1954, receives electronic notifications from the pathology and haematology laboratories on all cancers and other reportable neoplasms in the country that are diagnosed at those laboratories. This information is supplemented by reports from hospital departments, healthcare facilities, private-practicing consultants and information on death certificates. Recent results from record linkage with the Hospital Discharge Registry indicate 99% completeness of the registry Citation[164].
The registration procedure in Sweden has been somewhat different, as death certificates have not been used as a data source. Validation studies have been made by linking the cause of death registry with the cancer registry Citation[165], Citation[166]. The studies showed a drop out in completeness of a maximum of 4.5%, with the deficits seen for prostate cancer, stomach cancer, myeloma and leukaemia.
The small inaccuracies in cancer registration are not likely to affect the SIR estimates of the present study because they are not related to occupation. The accuracy of the diagnostic procedure, instead, may vary over educational and socio-economic strata, and there may even be occupation-specific special features such as annual health controls that directly affect the likelihood of a non-symptomatic cancer diagnosis of the employee. Most of the categories with the highest and lowest incidence of unspecified cancers in the present study ( and ) were also among the top and bottom risk occupations of all cancers combined ( and ). Hence, the likelihood of getting a proper diagnosis for the cancer seems not to vary markedly between occupations.
Accuracy of linkage and person-year calculation
The linkage between the census data, the mortality and emigration data and the cancer incidence data was based on the unique personal identity codes used in all five countries. Apart from errors in the identifiers, which are extremely rare, the method thus by definition ensured a complete ascertainment of relevant events Citation[158].
If the follow-up for vital status would be incomplete, there would be a risk of bias related to the occupational variation in general mortality. Fortunately the Nordic population register systems offer very accurate data on the vital status of all residents, and therefore the person-year calculations in the present study are precise.
Statistical significance
We present in this study SIRs for men and women, five countries, 54 occupational categories and close to 80 diagnostic groups, i.e., about 40 000 SIRs. Inevitably, many of these combinations will by chance come out with significantly high or low SIRs. In the interpretation of the findings, it is therefore important to pay attention not only to the size of the SIRs or the confidence intervals, but also to the consistency across countries and the biological plausibility.
The present study covers up to 45 years of cancer incidence in the population born between 1896 and 1960 and living in the five Nordic countries; Denmark, Finland, Iceland, Norway and Sweden. Almost 15 million persons were included in the study, and close to 385 million person years at risk were accumulated. Approximately 3 million incident cancer cases occurred during the follow-up period. The present study is thus the largest study ever reported on occupational cancer incidence.
Due to the huge size of the study, many of the observations that are statistically significant correspond to such a small deviation from unity that it has no practical implication. For instance, a great majority of the 54 occupation-specific SIRs for all sites combined were statistically significant (42 SIRs among the men and 40 among the women), although the relative risk difference in some instances was not more than some 2% as compared with the reference rate.
Selection of reference rates
Selection of the reference population has an effect on the SIR values. In the present paper, the expected numbers of cancer cases were based on national incidence rates. The other easily available option as to the reference rates would have been to use the rates calculated for the entire Nordic population. SIRs based on national rates and on Nordic incidence are dissimilar for cancers with large variation in incidence levels between the countries. In testicular cancer the incidence rate in Denmark during the follow-up period of the present study was about twofold, in Finland only one-half of the Nordic average (). The SIR for testicular cancer among Finnish seamen based on the national reference rate was 2.29 (95%CI 1.18–4.00, 12 cases), but only 1.06 (0.55–1.86) if based on the combined Nordic rate (). In turn, the SIR for Danish farmers increases from 0.84 (0.71–0.98, 155 cases) to 1.75 (1.49–2.04) if Nordic rates are used instead of Danish rates. In comparison to the Nordic reference rates, virtually all occupation-specific SIRs in Denmark are statistically significantly increased and most SIRs in Finland are statistically significantly decreased.
Table 83. Standardized incidence ratios for testis cancer based on country specific incidence rates (SIRc) and Nordic incidence rates (SIRn), by occupational category. Only occupations where sum of observed cases ≥20 in Denmark and Finland are included.
There are several factors affecting the general national incidence rates, including differences in the prevalence of aetiological factors, diagnostic procedures and even registration practices. These factors are hardly related to direct occupational hazards, and therefore we decided that in a study aiming at describing relative risks related to occupation, it is best justified to compare the incidence of cancer in a given occupation in a given country with the general population in the same country
There is also variation in the background cancer incidence within countries (, Citation[167]). If a given occupation is concentrated in specific regions, then the national reference rate may not be fully appropriate. Previous studies (e.g., Pukkala et al., 1997 Citation[168]), however indicate that the use of regional reference rates instead of whole-nation rates does not markedly affect the SIR estimates.
Figure 50. Age adjusted (World) incidence rates of cancer (all sites) in the Nordic countries in 1998–2003, by gender, based on municipality specific observations Citation[167].
![Figure 50. Age adjusted (World) incidence rates of cancer (all sites) in the Nordic countries in 1998–2003, by gender, based on municipality specific observations Citation[167].](/cms/asset/c81d17ba-73b2-4e5e-8187-04238cd003f6/ionc_a_391526_f0050_b.jpg)
General lifestyle factors
Not all associations between occupations and specific cancer diseases found in the present study reflect risks caused by exposures at the work place. Besides work place exposures, the occupational categories also vary in their exposures to other risk factors. Such major risk factors include tobacco smoking, alcohol consumption, dietary habits and reproductive patterns.
Occupation and tobacco smoking
The prevalence of smoking in the Nordic countries has varied over decades and been different in men and women as described in the Introduction. Smoking has also been differentially distributed across socio-economic strata and occupations.
Four stages of the so-called smoking epidemic have been described based on empirical data, also including the Nordic countries Citation[169–171]:
The prevalence of smoking is low and mainly a habit of higher socio-economic groups;
Smoking becomes more common, rates among men are at their peak, and may be equal among the socio-economic groups or higher among higher socio-economic groups. Women follow the smoking patterns of men with a lag of 10–20 years, with the higher socio-economic groups taking up the smoking habit;
Prevalence rates among men decrease, as many quit smoking, especially those in the higher social strata. Among women, the smoking prevalence peaks before a decline sets in by the end of this stage;
Prevalence rates keep declining slowly for both men and women, and smoking becomes progressively more a habit of the lower socio-economic groups.
Many of the occupational differences may be ascribed to socio-economic differences in smoking. Farmers have been consistently seen to have a lower smoking prevalence than those employed in manufacture. Some occupations have characteristics that influence the probability of being a smoker. For example, for a person working in the health care sector, or as a teacher, it was not possible to smoke during the active working hours, while in tobacco workers, the former tradition of quotas of free cigarettes increased the smoking probability.
The smoking prevalence by occupation for Norwegian men and women has been estimated in a series of health surveys in 1965–1981 linked to the 1970 census (; Citation[83]). Among men over 16 years of age, the proportion of current smokers was highest among painters (69.1%) and smelting workers (68.4%). Most of the groups consisting of manual workers had a smoking prevalence above 60%. The lowest proportion was seen among teachers (33.2%). Among women, mechanics, plumbers and welders had the highest prevalence of smokers (65.9%), while the prevalence rate among farmers and gardeners was only 12.4%.
Table 84. Estimated proportion of current smokers in the Norwegian study populaton (1965–1981), by occupational category. Only groups >10 are included [83].
In Finland in 1968, 46% of men working in agriculture smoked compared with 61% of men working in manufacture Citation[32]. These percentages had decreased to 34% and 49%, respectively in 1978 Citation[172], and to 33% and 44% in 1990 Citation[172]. Occupation-specific rates of current smokers based on surveys of health habits of the Finnish adult population in 1978–1991 have been created as part of FINJEM Citation[173]. The prevalence in males varies from 9% among architects, and 13% among primary school teachers and clergy to 56% among cooks and building hands, 58% among dockers, 59% among miners and 62% among service station attendants. In women, smoking was very rare among farmers (2%), deacons (3%), primary school teachers (5%) and dentists (6%) while 46% of female marketing workers and 42% of waiters in restaurants were regular smokers.
In Sweden, 19% of male farmers and 40% of male industrial workers were daily smokers in 1982–1983 Citation[31]. In Denmark, the prevalence of male smokers in 1990 varied from 29% of male higher educated salaried employees to 58% among unskilled workers Citation[29].
In Iceland, surveys from 1985–1988 showed a different pattern of smoking habits among those in various industries. Among men 18–69 years old, 50% of those in the fishing and fishing industry were daily smokers versus 37% of those in sales and service work, 39% of industrial workers, 34% of those in farming, 30% of those in civil service and 28% of those in the group “others”. Among women of the same age 51% in the fishing and fishing industry were daily smokers versus 40% in sales and service work, 34% in industry, 27% in farming, 29% in civil service and 30% of those in the group “others” Citation[174].
Haldorsen and co-workers Citation[83] used data on occupational smoking habits to control for confounding by smoking on the occupational lung cancer risk seen in the Norwegian part of the previous census-based follow-up study Citation[1] (; adapted from Haldorsen et al. 2004 Citation[83]). The relationship between smoking habits and lung cancer risk was estimated for 12 groups considered not to be occupationally exposed to lung carcinogens, and this relationship was used to control for smoking in the remaining groups possibly exposed to lung carcinogens through their work. In most of the probably exposed groups (such as welders, plumbers, painters, bricklayers, smelters, glass workers, beverage workers, launderers, and tobacco workers), initial SIRs were above 1.00, and adjustment led to further elevation of the risk estimate, indicating an effect of occupational exposure. On the other hand, the initially significantly elevated SIRs for waiters and cooks were lowered to unity after smoking adjustment, indicating smoking habits to be the main explanation for the elevated risk. For physicians and dentists, the smoking adjustment further decreased the already low SIRs, indicating a lower smoking prevalence as compared to other occupations. The risk estimate for gardeners changed from being significantly low to being significantly high, which might be an indication of exposure to lung carcinogens (or of imprecise smoking data). The results summarised above are largely supportive of the interpretation that the varying smoking habits do not explain all the occupational variation in risk.
Table 85. Original SIR and smoking adjusted lung cancer SIR by occupation among 893 264 Norwegian men followed-up 1971–1991 [83].
Occupation and alcohol consumption
Alcohol consumption is, like tobacco smoking, unevenly distributed across the occupational categories. The sparse data indicate that the higher social classes and some categories within the lowest social classes have had the highest and farmers the lowest average alcohol consumption. Alcohol consumption was throughout the study period higher in Denmark than in the other Nordic countries (). In Denmark, 23% of men in 1976 reported consumption of 11 alcoholic drinks or more per week. The proportion was 30% in university graduates and office workers, but only 7% among farmers. Five percent of women reported consumption of at least 11 alcoholic drinks per week. Consumption of wine increased after Denmark joined the European Union in 1972, and wine consumption in 1985 showed a marked social class gradient from 41% in university graduate workers to 4% in blue-collar workers. Beer consumption showed the opposite trend with 38% in academic occupations and 75% in blue-collar workers Citation[175].
Beverage manufacture workers in Denmark Citation[176], and male waiters and cooks in Norway Citation[177] have reported higher consumption of alcoholic beverages than the general population. In Finland, the highest indices for alcohol-related utilisation of health care resources in the early 1970s were obtained among labourers, painters, seamen, construction workers, forestry workers, artists and journalists Citation[178]. FINJEM includes estimates of average alcohol consumption in each occupation based on surveys of health habits of the Finnish adult population 1978–1991 Citation[173]. In males, the consumption was lowest among clergymen (10 g of alcohol per week, agricultural workers (36 g) and bench carpenters (39 g). The consumption was highest among waiters in restaurants (219 g), dockers (197 g) and engineers in ships (197 g). In women the consumption was highest (78–98 g of alcohol per week) among journalists, commercial managers and musicians) and lowest (7 g) among farmers.
In Sweden, a high consumption of alcohol is more common among men than among women, and highest among men with a low level of education. Swedish women with a high level of education have had higher alcohol consumption than women in manual occupations Citation[89].
In the present study, it was seen that occupations with easy access to alcohol and with cultural traditions of alcohol consumption also have a high risk of cancers associated with alcohol consumption. shows the mortality from alcohol related liver disease and the incidence of alcohol related cancer by occupation in the Nordic countries combined in the cohort of the present study. “Alcohol related cancer” has been defined here as cancer of the mouth, tongue, pharynx, larynx, oesophagus, and liver. There are other cancer sites with an established association with alcohol, such as colorectal cancer and breast cancer, but these were not included due to the weaker associations with alcohol and presumed lower attributable fractions. In the group'alcohol related liver disease’, alcoholic liver cirrhosis, fatty liver, hepatitis, fibrosis, and hepatic failure have been included (ICD-7 581.1, ICD-8 571.0, ICD-9 571.0-3, ICD-10 K70).
Table 86. Observed number (Obs) of incident cases of alcohol related cancer (alcohol cancers) and number of deaths from alcohol related non-malignant liver disease (liver disease) and standardised incidence/mortality ratio (SIR/SMR) for the Nordic countries, 1961–2005, by gender and occupational category.
High-risk groups are, to a large extent, the same for both diagnostic groups, supporting the interpretation that alcohol consumption is the main factor explaining the high risk of cancer of the upper aerodigestive tract and liver among, for instance, waiters and waitresses, male beverage workers, female journalists and seamen. Farmers and teachers are among the low risk groups for both genders. It should be noted, that all cancer sites included in the group’ alcohol related cancer’, except liver cancer, are also related to tobacco smoking. This may explain why some occupational categories, for instance male drivers, shoe and leather workers, and engine operators, and female smelting workers and launderers, have an elevated risk for the’ alcohol related cancers’ but not for the’ alcohol related liver diseases’. In these groups, smoking may play a relatively stronger role than alcohol consumption in the elevating risk of upper aerodigestive tract cancer, but this finding may also point to possible carcinogenic occupational exposures.
Occupation and dietary habits
Foods rich in fibre probably decrease the risk of colorectal cancer, while diets rich in fruits and vegetables probably decrease the risk of cancer in several sites such as mouth, pharynx, larynx, oesophagus, stomach, colorectum, lung, pancreas, and prostate. Red meat and processed meat have been convincingly shown to increase the risk of colorectal cancer, and diets rich in milk may also increase the risk. There is limited evidence for an association between the consumption of fat, in particular saturated fat, and cancers of the lung, breast and prostate Citation[179].
There is very little systematic information on dietary habits according to occupational category. More information is available on diet according to the socio-economic status or education. Several studies indicate that persons with a high socio-economic status practice more healthy behaviours than in low socio-economic status groups Citation[180].
The intake of potatoes was higher among men in the lowest social class in Denmark in 1985 than in the highest social class, but the intake of vegetables and fruit varied in the opposite direction Citation[119]. Consumption of milk and milk products among men was higher in the highest social class. The food consumption among women varied less by social class than among men but showed the same tendencies. Food consumption by educational groups among Swedish men in 1989 resembled that reported for Danish men: there was a higher consumption of potatoes among the low educated men compensated by a higher consumption of fruit and vegetables among high educated men Citation[120]. The same pattern was observed among Norwegian men in 1986–1988 Citation[181].
In Finland, the intake of milk and butter in 1992 was significantly higher in men with low education, whereas the intake of vitamin C and carotenoids was significantly lower than in the highest educational category Citation[182]. FINJEM includes estimates of average consumption of food items in each occupation based on surveys on health habits of the Finnish adult population 1978–1991 Citation[173]. Regular use of butter is considered to be a proxy of a less healthy diet. In men, the proportion was low among university teachers (16%) and architects (17%) and highest among farmers (70%), miners (63%) and forestry workers (60%). In women, the variation was from 11–12% among university teachers and commercial managers to 52% among butchers and dairy workers and 67% among farmers and agricultural workers.
In Iceland, male unskilled workers, lower service workers, employers, fishermen and farmers consumed more fat and less carbohydrates and fibres than men with higher education. Dietary habits among women varied less by occupation than among men but showed the same tendencies Citation[183].
We cannot rule out that some of the associations we found in our study may be – at least partially – explained by socio-economic and occupational differences in dietary habits. The strongest indication of the potential effect of dietary factors was in stomach cancer, where all low risk occupations represented high socio-economic status with a diet presumably rich in fruit and vegetable.
Occupation, body fatness and physical activity
There is convincing evidence that body fatness is associated with an increased risk of cancer of the oesophagal adenocarcinoma, colorectal cancer, panceratic cancer, endometrial cancer, kidney cancer, and postmenopausal breast cancer Citation[184]. Body fatness is probably associated with cancer of the gallbladder directly and indirectly, through the formation of gallstones. Abdominal fatness has been linked with cancers of the pancreas, breast, and endometrium but is specifically assoicated with an increased risk of breast cancer (postmenopausal). There is limited but suggestive evidence that body fatness is associated with an increased risk for liver cancer and that low body fatness is associated with lung cancer risk Citation[184]. Smoking is the principal cause of lung cancer and may also be associated with lower BMI. There is a high potential for confounding due to cigarette smoking, and residual confounding is therefore possible. Highly educated persons in the Nordic countries tend to be leaner than persons with limited education.
Physical activity – occupational, household, transport, and recreational – probably reduces the risk of colon cancer and post-menopausal breast cancer and endometrial cancer Citation[185]. There is suggestive evidence that physical activity also decreases the risk of lung cancer, pancreas cancer and premenopausal breast cancer. In the Nordic countries, as elsewhere, occupations with high physical activity tend to be those with short education, such as miners, forestry workers, fishermen, farmers, construction workers, cleaning workers or assistant nurses. On the other hand, highly educated persons who tend to work in sedentary occupations, tend to do more leisure time exercise.
FINJEM includes estimates of average body mass index (BMI) in each occupation based on surveys on the health habits of the Finnish adult population 1978–1991 Citation[173]. Men working as university teachers, physicians, computer operators or programmers were leanest (BMI 23.5–24.0), and the BMI was highest (27.7–27.8) in several occupations on ships. In women, the BMI was lowest among physiotherapists (22.1), university teachers (22.3) and highest among typographers (27.8) and farmers (26.5). Part of the variation may be attributable to age distribution (the youngest men tend to be leanest) and physical demands of the work (strong muscles increase the weight).
In this first phase of the NOCCA study we did not yet have means to adjust risk estimates according to information on body size or physical activity. Thus, we cannot give numerical estimates on how much of the occupational variation in cancer risk is attributable to body fatness and physical activity. Such cofactor data will be available in the later phases of the NOCCA study. On the other hand, lack of physical activity at work can be considered as one of the most serious occupational health hazards in the modern work life, and thus it is also important to show risk estimates without adjustment for work-related physical activity.
Occupation and reproductive pattern
Reproductive factors are associated with the risk of cancer of the reproductive organs in women. The risk of breast cancer decreases with increasing parity, in particular if the first birth is below the age of 20 Citation[186]. The risk of endometrial cancer decreases with increasing parity, in particular if the age of the last birth is above 35 years Citation[100]. The risk of ovarian cancer Citation[187] is also decreased with increasing parity without connection to ages at deliveries Citation[188].
In general, women in higher socio-economic classes have lower fertility rates. In Norway, for example, the average age at first birth in occupations that require high education, such as dentists, physicians, and teachers, is about 5 years higher than in occupations with short education (). The average number of children was highest among farmers, gardeners, and fishermen, while otherwise the variation was not very large. The percentage of nulliparous women was highest among seamen and journalists and also the parous women in these categories had few children on average.
Table 87. Parity for the Norwegian women in the study. Only women born 1935–1950 are included.
There are similar data in Finland from 1985, including women in ages 40–49 Citation[6], showing similar fertility patterns as the Norwegians. For instance the proportion of nulliparous journalists in Finland was 23% (Norway 27%) and average number of children among the parous was 2.0 (Norway 1.5). For farmers, the proportion of nullipara was 7%, and the average number of children was 3.0 in both countries.
In Iceland, record linkage was done between the Census and the population-based Cohort Study of the Cancer Detection Clinic, where information on reproductive factors has been collected since 1964 Citation[189]. This was done as a preparatory phase of the future analyses of the NOCCA project, where parity data are required as cofactors in multivariate analysis on occupational risk factors of hormone-related cancer sites. The average age at first birth among Icelandic women born in 1935–1950 was 21.8 years, i.e., about two years younger than in Norway, but the differences between the occupations with the oldest age at first birth (physicians, 26.2 years) and the youngest age at first birth (<21 years, e.g., among shop workers, gardeners, fishermen, shoe and leather workers, printers, food workers and launderers) was similar as in Norway. The average number of children was 2.5 among physicians, but between 3.1 and 3.7 for the other occupations mentioned above.
In a sample of Danish married women aged 15–49 years and interviewed in 1970, 23% of women with 7–9 years of education reported birth of the first child before age 20, whereas this was the case for only 2% of women with 12 or more years of education Citation[190]. The fertility differences were relatively small among Swedish women born in 1940–1949, with women with only basic education having on average 2.1 children and women with university education having on average 1.9 children Citation[191].
Occupations with high age at first birth systematically had elevated SIRs for breast cancer in the current study. In occupations where women had a high number of children, the risk of breast cancer was low. For cancer of the corpus uteri and for ovarian cancer, the occupational variation in risk was small and not clearly associated with the fertility pattern.
Socially discriminating cancers
The variation in relative risk across occupational categories varied considerably between cancer types. The cancer sites thus formed a hierarchy from cancer sites with large variations to cancer sites with small variations (). For men, mesothelioma topped the list with a 20-fold risk variation between the lowest risk group of farmers with an SIR of 0.24 (95% CI 0.21–0.28) and the high risk group of plumbers with an SIR of 4.74 (4.18–5.38). In contrast, only a 1.5-fold risk variation was found for multiple myeloma, where the SIR varied from 0.79 (0.46–1.26) for laboratory assistants to 1.31 (0.95–1.78) for launderers.
Figure 51. Risk of cancer in occupations with the highest and lowest standardised incidence ratios (SIR), by gender. Only occupations with ≥ 1 000 workers, ≥5 observed cases and ≥5 expected cases have been included.
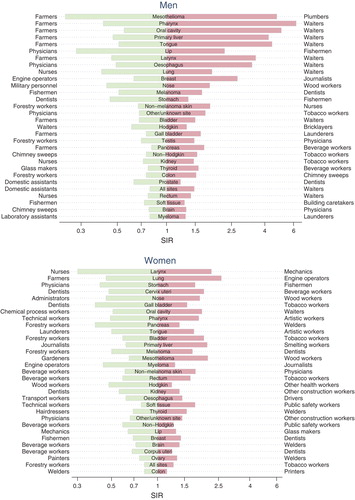
The risk variation was large for cancer sites where work-related exposures play a marked role. This was the case for mesothelioma, where the asbestos exposed plumbers came out with the highest risk for lip cancer, where the sunlight exposed fishermen had the highest risk; and for cancer of the nose, where the wood dust exposed woodworkers topped the list. In addition, large risk variations were found for alcohol and tobacco related cancers. Risk variations were 5-15-fold for cancers of the pharynx, oral cavity, liver, tongue, larynx, oesophagus and lung.
Waiters topped the list on all of these seven cancer sites, and farmers were at the bottom for six of them. The SIRs for these occupational categories differ for most cancer sites (). Waiters had higher incidence in most cancer sites than farmers, suggesting that cancer-causing factors tend to cluster in same population categories. The only exception where farmers had a significantly higher incidence was lip cancer among men. The risk variation between the female waiters and farmers was smaller than between male ones.
Figure 52. Standardised incidence ratios (SIR) and 95% confidence interval for selected cancers among farmers and waiters, by gender.
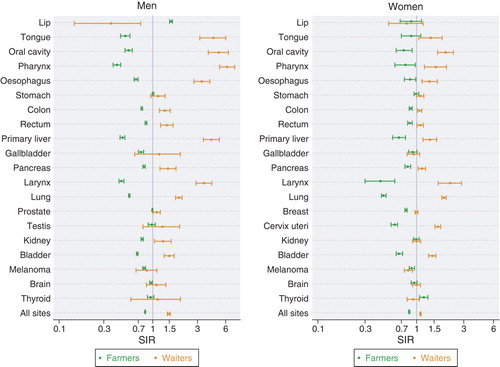
The cancer sites with less risk variation were primarily those less attributable to specific established aetiological factors related to occupational exposures or social status. The variation among men was about twofold for cancers of the testis, pancreas, kidney, thyroid, colon and prostate and non-Hodgkin lymphoma, and only about 1.5-fold for cancers of the rectum, soft tissue, and brain, as well as for multiple myeloma (). Beverage workers, tobacco workers or waiters came out with the highest risk on cancer of the pancreas, non-Hodgkin lymphoma, kidney, thyroid and rectum. Tobacco smoking could be a risk factor behind the observed increase in cancers of the pancreas and kidney. Hence, even the high risks for less discriminating cancers aggregated in certain occupations.
The fact that a given occupational category can be at the highest risk for one cancer site and at the lowest risk for another reflects the differences in aetiology across cancer sites. Male dentists, for instance, had the highest risk for skin melanoma and the lowest risk for stomach cancer. Exactly the opposite pattern was found for fishermen, who had the lowest risk for melanoma and the highest risk for stomach cancer. Such differences were balanced out when all cancer sites were considered together, resulting in similar overall cancer incidence for dentists (SIR 0.97, 95% CI 0.94–1.01) and fishermen (1.02, 1.00–1.04).
For women, less difference in the risk variations across cancer sites was found (). A more than fivefold risk variation was found only for cancers of the larynx and lung. A risk variation of less than two was found for cancer of the brain, corpus uteri, ovary and colon. Diverging aetiologies of cancers were also shown in the data for women. Dentists, for instance, had the highest risk for cancer of the corpus uteri with an SIR of 1.24 (1.00–1.51) versus an SIR of 0.68 (0.47–0.96) for beverage workers. The pattern was exactly opposite for cervical cancer, with beverage workers having an SIR of 2.01 (1.51–2.61) and dentists having an SIR of 0.48 (0.30–0.74).
There was a much more varied pattern for women than for men in the occupational categories coming up as either high or low risk groups. While either beverage workers, tobacco workers or waiters came out as the high risk group for 15 of 29 cancer sites for men, these occupational categories came out as the high risk group for only six of 30 cancer sites for women. This might be related to the lower occupational stability for women in these categories.
Economic inactive persons
The SIRs for the category of economic inactive persons were given for every cancer site but not commented upon in the Result chapter because this category was not considered as a real occupational category. The definition also varies over the Nordic countries. While the Danish, Icelandic, Norwegian and Swedish definitions include jobs held for a relatively short period and part-time jobs with few working hours, the Finnish definition sets a threshold for inclusion as occupationally active of approximately 20 working hours a week at the time of the census. These differences will probably not have affected the classification of men, but part-time working women could have been classified differently across the countries. There are differences across the countries in the way a distinction was made between economically inactive housewives and economically active housewives at the family farm or in the family shop.
The proportion of economically inactive men of the total 30–64-year-old male population at the time of the first available population census of the current study was 7.3%, including a great proportion of men unable to work, for instance due to a disease. The large category of economically inactive women (42.4% of the total 30–64-year-old female population) included housewives and farmers’ spouses not taking part in farm work and was thus less selected in terms of health status than that of males.
The total cancer incidence among economically inactive men was 6% (95% CI 5%–7%) larger than the incidence among economically active men, whereas there was a slightly decreased cancer incidence among the economically inactive women (SIR 0.99, 95% CI 0.98–0.99). (http://astra.cancer.fi/NOCCA/Incidence/economically-inactive). The highest site-specific SIRs among economically inactive men were obtained for alcohol-related cancers of the pharynx other than nasopharynx (2.08, 1.94–2.23), oral cavity (1.73, 1.60–1.87), tongue (1.59, 1.44–1.75), liver (1.54, 1.46–1.62), oesophagus (1.50, 1.43–1.58), and larynx (1.42, 1.35–1.50). The SIR for lung cancer was 1.33 (1.31–1.35), indicating that economically active men also smoked more than men on average. Besides the common cancer sites illustrated in , penile cancer also showed a significant excess (SIR 1.40, 1.25–1.56) quite consistently across the Nordic countries (). There is no obvious explanation for this finding. The SIRs were lowest for skin melanoma (0.70, 0.67–0.74) and prostate cancer (0.80, 0.79–0.82), suggesting that economically inactive men do not get sunburns and do not go to PSA tests as frequently as other men.
Figure 53. Standardised incidence ratios (SIR) and 95% confidence intervals for selected cancers among economically inactive men and women.
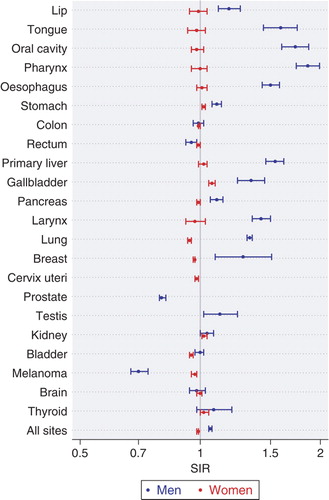
The elevated SIR of 1.34 (1.24–1.45) for cancer of the gallbladder among economically inactive men might be related to obesity, which is likely to be more common among economically inactive men than among economically active ones. Cancer of the gallbladder was the only cancer to show a significant more than 5% excess risk among economically inactive women, but the SIR was not higher than 1.07 (1.05–1.09). The SIR was lowest in cancer of the Fallopian tube (0.88, 0.82–0.94).
Conclusions
The surveillance system described in this publication systematically produced standardised incidence ratios (SIRs) among men and women in all five Nordic countries for all main cancer sites by occupation. It was based on the computerised record linkage of the nationwide population-based cancer Registries and population census files including occupational data from a time-point 0–45 years prior to the cancer diagnosis. Because of the high coverage, precision and validity of the linked files, the cancer risk estimates can be considered very reliable, and the large numbers of cases downplay the role of chance variation even in the case of relatively rare cancer forms. For the many small occupational categories and cancer sites, the possibility to combine data from several countries made it possible to get meaningful risk evaluations, and the possibility for five independent country-specific observations to have a tool to estimate consistency of the findings.
The occupation at one point in time may not always correspond to the lifelong occupational history of a person. However, comparison with results of special occupational cancer studies indicates that the risk diluting effect of misclassification is small. The study was able to find well-known, confirmed occupational risks such as a high lip cancer incidence in farmers and fishermen. Comparisons made earlier have indicated that even the numerical relative risk estimates derived from register-based analyses like the present one have repeatedly been seen to be similar to those obtained in studies investigating more specific hypotheses Citation[6], Citation[173]. Because the present survey was based on incident cancer cases and exact person-years, there was no bias caused by occupational variation in cancer survival and in mortality from competing causes of death that may be a serious problem in analyses based on cancer deaths and cross-sectional proportionate analyses.
Known or suspected associations, such as a high risk of nasal adenocarcinoma among woodworkers, mesothelioma among asbestos exposed workers, and lung cancer among asbestos and silica dust exposed workers, can be picked up from the numerous site and occupation-specific risk ratios. Sedentary workers tend to have an increased risk of breast cancer, while the association with colon cancer was not so evident. Skin melanoma was most common among indoor workers who are not used to sun radiation and thus easily burn due to intensive sunbathing during the holidays.
Thousands of new significant associations came up, and these should be confirmed in other studies before they can be believed to be true causal associations. For instance in ovarian cancer, especially borderline tumours, there was a cluster of chemical-exposed occupations with a high risk. Even in such a rare disease as male breast cancer there were enough cases (2 336) to reveal a hint of an increase in risk in occupations characterised by shift work. The rare occupational category of chimney sweeps, who are exposed to known carcinogens, showed a significant excess risk of cancers of the pharynx, oesophagus, lung, colon, pancreas and bladder.
Occupation-related social factors seem to be more important determinants of some cancer risks than the real occupational ones. There were high risks of alcohol-related cancers among workers having easy access to alcoholic beverages in their work. Occupations can also create a protective environment against cancer: it is not suitable for a primary school teacher, dentist or priest to smoke at work (or elsewhere), which is reflected in a low incidence of smoking-related cancers.
Cancer is socially discriminating, more so for men than for women. The highly discriminating cancers were found to be those aetiologically related to asbestos, sunlight, and tobacco and/or alcohol exposures. Occupational categories of high risk for one cancer may be of low risk for another cancer, and this resulted in the present study in a 1.9-fold variation in the overall cancer risk for men and in a 1.5-fold variation for women. It was estimated from a similar results pattern in Finland from 1971–1985 that some 5% of all cancers both in males and in females would be related to work, and about 35% of cancer incidence in males and 16% in females would be attributable to socio-economic position Citation[6]. The current risk estimates indicate that the population attributable fractions for the Nordic region would still be of similar magnitude.
Acknowledgements
This study was financially supported by the Nordic Cancer Union and Scientific Council in Sweden. Data for the study were prepared in collaboration with the national statistical offices, Statistics Denmark; Statistiska Centralbyrån, Sweden; Statistics Norway; Statistics Iceland, and Statistics Finland. We are indebted to Aage Andersen, Lotti Barlow, Tor Haldorsen, and Lene Bjørk Clausen for assistance in early phases of this study. We thank Ms. Luanne Siliämaa for language corrections, and Margrethe Meo for help with the references and preparation of the manuscript. Declaration of interest: The authors report no conflicts of interest. The authors alone are responsible for the content and writing of the paper.
Related Research Data
References
- Andersen A, Barlow L, Engeland A, Kjaerheim K, Lynge E, Pukkala E. Work-related cancer in the Nordic countries. Scand J Work Environ Health 1999; 25(Suppl 2)1–116
- Danmarks Statistik [Statistics Denmark]. Folke og boligtællingen 1. januar 1981. Landstabelværket [Population- and housing census 1st January 1981. Tables for all Danmark]. CopenhagenDenmark: Danmarks Statistik; 1984, Danish.
- National Board of Health and Welfare [Socialstyrelsen]. The Swedish Cancer-Environment Registry 1961–1973. StockholmSweden: Socialstyrelsen; 1980.
- Eklund, G, Barlow, L, Vaittinen, P. Cancer-Miljö-Registeret 1960–70 [Cancer-Environment Registry 1960–70]. Epc-report No. 4. StockholmSweden: Socialstyrelsen; 1994, Swedish.
- Lynge E, Thygesen L. Occupational cancer in Denmark. Cancer incidence in the 1970 census population. Scand J Work Environ Health 1990; 16(Suppl 2)3–35
- Pukkala, E. Cancer risk by social class and occupation. A survey of 109,000 cancer cases among Finns of working age. In: J Wahrendorf, Contributions to epidemiology and biostatistics. Vol 7. BaselSwitzerland: Karger; 1995.
- Andersen A, Bjelke E, Langmark F. Cancer in waiters. Br J Cancer 1989; 60: 112–5
- Tynes T, Andersen A, Langmark F. Incidence of cancer in Norwegian workers potentially exposed to electromagnetic fields. Am J Epidemiol 1992; 136: 81–8
- Nordic Statistical Secretariat [Nordisk Statistisk Sekretariat]. Occupational mortality in the Nordic countries 1971–80. Statistical Reports of the Nordic Countries. CopenhagenDenmark: Nordic Statistical Secretariat; 1988.
- World Meteorological Organization (WMO). Climatological normals for the period 1961–1990. WMO/OMM 847. GenevaSwitzerland: Secretariat for the World Meteorological Organization; 1996.
- Moan J, Dahlback A, Henriksen T, Magnus K. Biological amplification factor for sunlight-induced nonmelanoma skin cancer at high latitudes. Cancer Res 1989; 49: 5207–12
- Nordic Council; Nordic Council of Ministers [Nordiska rådet; Nordiska ministerrådet]. Nordic Statistical Yearbook 2005. Vol 43. CopenhagenDenmark: Nordic Council of Ministers; 2005.
- Nordic Council; Nordic Council of Ministers [Nordiska rådet; Nordiska ministerrådet]. Nordic Statistical Yearbook 2007. U Agerskov, Vol 45. CopenhagenDenmark: Nordic Council of Ministers; 2007.
- Organisation for Economic Co-operation and Development (OECD). Health at a glance 2007- OECD indicators. ParisFrance: OECD; 2007.
- Pedersen, PJ, Røed, M, Wadensjö, E. The common Nordic labor market at 50. TemaNord 2008: 506. CopenhagenDenmark: Nordic Council of Ministers; 2008.
- Valkonen T. Adult mortality and education: a comparison between six countries. Health inequalities in European countries, J Fox. Gower, AldershotUK 1989; 142–60
- G Jonsson, Magnusson, MS. Hagskinna: Icelandic historical statistics. ReykjavikIceland: Statistics Iceland; 1997.
- Schmidt, EK. Research and higher education in the Nordic countries. A comparison of the Nordic systems. Working Paper 3. AarhusDenmark: Danish Centre for Studies in Research and Research Policy, University of Aarhus; 2004.
- Y Terlinden. Tro och mångfald. Religionsmöten och religionsteologi i Norden [Faith and diversity. Religious meetings and religious theology in the Nordic countries]. TemaNord 2005: 582. CopenhagenDenmark: Nordiska ministerrådet; 2005. Swedish.
- US Department of Energy's Carbon Dioxide Information Analysis Centre (CDIAC), [Homepage on the internet]. Oak RidgeUS: Oak Ridge National Laboratory, [cited 2007 Nov 4]. Available from: http://cdiac.ornl.gov/.
- Organisation for Economic Cooperation and Development (OECD). National accounts: Main aggregates. [1: 1960–95]. ParisFrance: OECD; 1997.
- Community survey on ITC usage in households and by individuals [Database on the Internet]. BrusselsBelgium: Statistical Office of the European Communities, Eurostat [cited 2007 Nov 5]. Available from: http://epp.eurostat.ec.europa.eu; http://epp.eurostat.ec.europa.eu/cache/ITY_OFFPUB/KS-NP-05-018/EN/KS-NP-05-018-EN.PDF.
- Trygg K. Food patterns in the Nordic countries. Ann Nutr Metab 1991; 35(Suppl 1)3–11
- Nes, M, Müller, H, Pedersen, PJ. Ernæringslære [Nutritional education]. OsloNorway: Gyldendal Norsk Forlag; 2006. Norwegian.
- Becker, W. Comparison of per capita statistics for foods in the Nordic countries. Report to the Nordic Working Group for Diet and Nutrition. UppsalaSweden: Nordic Council of Ministers; 1992. Swedish.
- Statens institutt for alkohol- og narkotika forskning (SIFA); Rusmiddeldirektoratet [National Institute for Alcohol and Drug Research]. Rusmidler i Norge. Alcohol i de nordiske land [Intoxicating substances. Alcohol in the Nordic countries]. L Grytten. OsloNorway: SIFA & Rusmiddeldirektoratet; 1994. Norwegian.
- Dreyer L, Winther JF, Andersen A, Pukkala E. Avoidable cancers in the Nordic countries. Alcohol consumption. APMIS 1997; 76(Suppl)48–67
- Mørck, HI, Linde, J, Agner, E, Hein, HO, Gyntelberg, F, Nielsen, PE. Tobaks-forbrug og rygevaner i Norden, 1920–1980 [Tobacco consumption in the Nordic countries, 1920–1980]. Nord Med 1982; 97:134–46. Danish.
- Nielsen, PE, Zacho, J, Olsen, JA, Olsen, CA. Aendringer i danskernes rygevaner 1970–1987 [Changes in the smoking habits of Danes in the period 1970–1987]. Ugeskr Laeger 1988; 150(38):2229–33. Danish.
- Statens Tobakkskaderåd [National Council on Smoking and Health]. Tobakksbruk og holdninger i Norge- utviklingen 1973–95 [Tobacco consumption in Norway 1973–95]. OsloNorway: Statens Tobakkskaderåd; 1996. Norwegian.
- Socialstyrelsen [National Board of Health and Welfare]. Tobaksvanor i Sverige [Tobacco consumption in Sweden]. Socialstyrelsen redovisar. Vol 9. StockholmSweden: Socialstyrelsen; 1986. Swedish.
- Rimpelä, M. Aikuisväestön tupakointitavat Suomessa 1950–1970-luvuilla [Adult use of tobacco in Finland in the 1950s to 1970s]. Publications of Public Health M-series. Vol 40/78. TampereFinland: Kansanterveystieteen laitos, Tampereen Yliopisto; 1978. Finnish.
- Dreyer L, Winther JF, Pukkala E, Andersen A. Avoidable cancers in the Nordic countries. Tobacco smoking. APMIS 1997; 76(Suppl)9–47
- European Commission. Health in Europe. Results from 1997–2000 surveys. Luxemburg: Office for Official Publications of the European Communities; 2003. p. 87–90. Available from: http://ec.europa.eu/health/ph_information/reporting/statistical_en.print.htm.
- Statistiska centralbyrån [Statistics Sweden]. Alcohol- och tobaksbruk. [Alcohol and tobacco use]. Report No. 114. StockholmSweden: Statistiska centralbyrån; 2007, [cited 2007 Nov 11]. Swedish. Available from: http://www.scb.se/statistik/_publikationer/LE0101_2004I05_BR_LE114SA0701.pdf.
- Statistics Norway [Statistisk sentralbyrå]. Health Interview Survey 2005. Little change in total tobacco use. OsloNorway: Statistics Norway; 2006, [cited 2007 Nov 10]. Available from: http://www.ssb.no/english/subjects/03/01/helseforhold_en/.
- Organisation for Economic Co-operation and Development (OECD). Society at a glance: OECD social indicators. Paris: OECD; 2006.
- Nordic Statistical Secretariat [Nordisk Statistisk Sekretariat]. Yearbook of Nordic Statistics 1973. Vol 12. CopenhagenDenmark: Nordic Statistical Secretariat; 1974.
- Nordic Statistical Secretariat [Nordisk Statistisk Sekretariat]. Yearbook of Nordic Statistics 1981. Vol 20. StockholmSweden: Nordic Statistical Secretariat; 1982.
- Åmark K. Women's labour force participation in the Nordic countries during the twentieth century. The Nordic model of welfare. A historical perspective, NF Christiansen, K Petersen, N Edling, P Haave. Museum Tusculanum Press, University of Copenhagen, CopenhagenDenmark 2006
- Vassenden, K. Folke- og boligtellingene 1960, 1970 og 1980. Dokumentasjon av de sammenlignbare filene [Population and housing censuses 1960, 1970 & 1980. Documentation of the comparable files]. Vol 2. Oslo-KongsvingerNorway: Statistisk Sentralbyrå; 1987. Norwegian.
- Arbeidsdirektoratet [Department of Labour]. Nordisk yrkesklassifikasjon. [Nordic classification of occupations]. OsloNorway: Arbeidsdirektoratet; 1958. Norwegian.
- International Labour Office (ILO). International standard classification of occupations, 1958. GenevaSwitzerland: ILO; 1962.
- International Labour Office (ILO). International standard classification of occupations, [Revised]. GenevaSwitzerland: ILO; 1968.
- World Health Organization (WHO). International classification of diseases. 7th revision. GenevaSwitzerland: WHO; 1957.
- World Health Organization (WHO). ICD-O: International classification on diseases for oncology: Version 1. GenevaSwitzerland: WHO; 1976.
- American Cancer Society. Manual of tumor nomenclature and coding MOTNAC. AtlantaUS: American Cancer Society; 1951.
- World Health Organization (WHO). Statistical codes for human tumours. [Document WHO/HS/CANC 24.1 and 24.2]. GenevaSwitzerland: WHO; 1956.
- NORDCAN: Cancer incidence and mortality in the Nordic countries, Version 3.0. [Database on the internet]. Association of the Nordic Cancer Registries; 2007. Available from: http://www.ancr.nu/default_old.asp.
- Mayne ST, Morse DE, Winn DM. Cancers of the oral cavity and pharynx. Cancer epidemiology and prevention, D Schottenfeld, JF Fraumeni, Jr. Oxford University Press, New YorkUS 2006; 674–96
- Clemmesen J. Statistical studies in the aetiology of malignant neoplasms. Vol 1. Review and results. Acta Pathol Microbiol Scand Suppl 1965; 174(Suppl)1–543
- Spitzer WO, Hill GB, Chambers LW, Helliwell BE, Murphy HB. The occupation of fishing as a risk factor in cancer of the lip. N Engl J Med 1975; 293: 419–24
- Lindqvist C. Risk factors in lip cancer: A questionnaire survey. Am J Epidemiol 1979; 109: 521–30
- Mork J, Lie AK, Glattre E, Hallmans G, Jellum E, Koskela P, et al. Human papillomavirus infection as a risk factor for squamous-cell carcinoma of the head and neck. N Engl J Med 2001; 344: 1125–31
- Pukkala E, Soderholm AL, Lindqvist C. Cancers of the lip and oropharynx in different social and occupational groups in Finland. Eur J Cancer (B. Oral Oncol) 1994; 30B: 209–15
- Yu MC, Yuan JM. Nasopharyngeal cancer. Cancer epidemiology and prevention, D Schottenfeld, JF Fraumeni, Jr. Oxford University Press, New YorkUS 2006; 620–26
- Blot WJ, McLaughlin JK, Fraumeni JF, Jr. Esophageal cancer. Cancer epidemiology and prevention, D Schottenfeld, JF Fraumeni, Jr. Oxford University Press, New YorkUS 2006; 697–706
- Gustavsson P, Evanoff B, Hogstedt C. Increased risk of esophageal cancer among workers exposed to combustion products. Arch Environ Health 1993; 48: 243–5
- Gustavsson P, Jakobsson R, Johansson H, Lewin F, Norell S, Rutkvist LE. Occupational exposures and squamous cell carcinoma of the oral cavity, pharynx, larynx, and oesophagus: A case-control study in Sweden. Occup Environ Med 1998; 55: 393–400
- Weiderpass E, Pukkala E. Time trends in socioeconomic differences in incidence rates of cancers of gastro-intestinal tract in Finland. BMC Gastroenterol 2006; 6: 41
- Shibata A, Parsonnet J. Stomach cancer. Cancer epidemiology and prevention, D Schottenfeld, JF Fraumeni, Jr. Oxford University Press, New YorkUS 2006; 707–20
- Gonzalez CA, Jakszyn P, Pera G, Agudo A, Bingham S, Palli D, et al. Meat intake and risk of stomach and esophageal adenocarcinoma within the European Prospective Investigation Into Cancer and Nutrition (EPIC). J Natl Cancer Inst 2006; 98: 345–54
- Sjodahl K, Jansson C, Bergdahl IA, Adami J, Boffetta P, Lagergren J. Airborne exposures and risk of gastric cancer: A prospective cohort study. Int J Cancer 2007; 120: 2013–8
- Beebe-Dimmer JL, Schottenfeld D. Cancers of the small intestine. Cancer epidemiology and prevention, D Schottenfeld, JF Fraumeni, Jr. Oxford University Press, New YorkUS 2006; 801–8
- Giovannucci E, Wu K. Cancers of the colon and rectum. Cancer epidemiology and prevention, D Schottenfeld, JF Fraumeni, Jr. Oxford University Press, New YorkUS 2006; 809–29
- International Agency for Research on Cancer (IRAC), World Health Organization (WHO). Weight control and physical activity. H Vainio, Bianchini, F, IARC Handbooks of cancer prevention. Vol 6. LyonFrance: IARC Press; 2002.
- Baan R, Straif K, Grosse Y, Secretan B, El Ghissassi F, Bouvard V, et al. Carcinogenicity of alcoholic beverages. Lancet Oncol 2007; 8: 292–3
- London WT, McGlynn KA. Liver cancer. Cancer epidemiology and prevention, D Schottenfeld, JF Fraumeni, Jr. Oxford University Press, New YorkUS 2006; 763–86
- Hsing AW, Rashid A, Devesa SS, Fraumeni JF. Biliary tract cancer. Cancer epidemiology and prevention, D Schottenfeld, JF Fraumeni, Jr. Oxford University Press, New YorkUS 2006; 787–800
- World Cancer Research Fund (WCRF); American Institute for Cancer Research (AICR). Gallbladder. In: Food, nutrition, physical activity, and the prevention of cancer: A global perspective. WashingtonDC (US): AICR; 2007. p. 275–6.
- International Agency for Research on Cancer (IARC). Tobacco smoke and involuntary smoking. IARC Monographs on the evaluation of carcinogenic risk to humans. Vol 83. LyonFrance: IARC Press; 2004.
- Anderson KE, Mack TM, Silverman DT. Cancer of the pancreas. Cancer epidemiology and prevention, D Schottenfeld, JF Fraumeni, Jr. Oxford University Press, New YorkUS 2006; 721–62
- Littman AJ, Vaughan TL. Cancers of the nasal cavity and paranasal sinuses. Cancer epidemiology and prevention, D Schottenfeld, JF Fraumeni, Jr. Oxford University Press, New YorkUS 2006; 603–19
- International Agency for Research on Cancer (IARC). Wood, leather and some associated industries. IARC Monographs on the evaluation of carcinogenic risks to humans. Vol 25. LyonFrance: IARC Press; 1981.
- Hernberg S, Westerholm P, Schultz-Larsen K, Degerth R, Kuosma E, Englund A, et al. Nasal and sinonasal cancer. Connection with occupational exposures in Denmark, Finland and Sweden. Scand J Work Environ Health 1983; 9: 315–26
- International Agency for Research on Cancer (IARC). Wood dust and Formaldehyde. IARC Monographs on the evaluation of carcinogenic risks to humans. Vol 62. LyonFrance: IARC Press; 1995.
- Acheson ED, Cowdell RH, Hadfield E, Macbeth RG. Nasal cancer in woodworkers in the furniture industry. Br Med J 1968; 2(5605)587–96
- Lynge E, Andersen A, Nilsson R, Barlow L, Pukkala E, Nordlinder R, et al. Risk of cancer and exposure to gasoline vapors. Am J Epidemiol 1997; 145: 449–58
- Report of the international committee on nickel carcinogenesis in man. Scand J Work Environ Health 1990;16(1 Spec No):1–82.
- Andersen A, Berge SR, Engeland A, Norseth T. Exposure to nickel compounds and smoking in relation to incidence of lung and nasal cancer among nickel refinery workers. Occup Environ Med 1996; 53: 708–13
- Olshan AF. Cancer of the larynx. Cancer epidemiology and prevention, D Schottenfeld, JF Fraumeni, Jr. Oxford University Press, New YorkUS 2006; 627–37
- Dreyer L, Andersen A, Pukkala E. Avoidable cancers in the Nordic countries. Occupation. APMIS 1997; 76(Suppl)68–79
- Haldorsen T, Andersen A, Boffetta P. Smoking-adjusted incidence of lung cancer by occupation among Norwegian men. Cancer Causes Control 2004; 15: 139–47
- Vainio H, Boffetta P. Mechanisms of the combined effect of asbestos and smoking in the aetiology of lung cancer. Scand J Work Environ Health 1994; 20: 235–42
- Blot WJ, Fraumeni JF, Jr. Cancers of the lung and pleura. Cancer epidemiology and prevention, D Schottenfeld, JF Fraumeni, Jr. Oxford University Press, Oxford 1996; 637–65
- Alberg AJ, Ford JG, Samet JM. Epidemiology of lung cancer: ACCP evidence-based clinical practice guidelines. 2nd ed. Chest 2007; 132(Suppl 3)S29–S55
- Weiderpass E, Boffetta P, Vainio H. Occupational causes of cancer. The cancer handbook, MR Alison. John Wiley & Sons Ltd, ChichesterUK 2007; 443–52
- Statistics Norway [Statistisk sentralbyrå]. The share of daily smokers is still decreasing. OsloNorway: Statistics Norway; 2007. Available from: http://www.ssb.no/english/subjects/03/01/royk_en/arkiv/.
- Statistiska centralbyrån [Statistics Sweden]. Alkohol- och tobaksbruk [Alcohol and tobacco use]. Report No. 114. StockholmSweden: Statistiska centralbyrån; 2007. Swedish. Available from: http://www.scb.se/statistik/_publikationer/LE0101_2004I05_BR_LE114SA0701.pdf.
- Lýðheilsustöð [Public Health Institute of Iceland]. Umfang reykinga [Tobacco use]. ReykjavikIceland: Lýðheilsustöð; 2007. Icelandic. Available from: http://www.lydheilsustod.is/media/tobaksvarnir/rannsoknir/umfang_reykinga.pdf.
- Baksaas I, Lund E, Skjerven JE, Langard S, Vellar OD, Aaro LE. [Cancer in merchant seamen. A group study; Norwegian]. Tidsskr Nor Laegeforen 1983; 103: 2317–20
- Rafnsson V, Gunnarsdottir H. Cancer incidence among seamen in Iceland. Am J Ind Med 1995; 27: 187–93
- Pukkala E, Saarni H. Cancer incidence among Finnish seafarers, 1967–92. Cancer Causes Control 1996; 7: 231–9
- Gunnarsdottir H, Rafnsson V. Cancer incidence among Icelandic farmers 1977–1987. Scand J Soc Med 1991; 19: 170–3
- Boffetta P, Stayner LT. Pleural and peritoneal neoplasms. Cancer epidemiology and prevention, D Schottenfeld, JF Fraumeni, Jr. Oxford University Press, New YorkUS 2006; 659–73
- Straif K, Baan R, Grosse Y, Secretan B, Ghissassi V, Bouvard V, et al. Carcinogenicity of shift-work, painting, and fire-fighting. Lancet Oncol 2007; 8: 1065–6
- Colditz GA, Baer HJ, Tamimi RM. Breast cancer. Cancer epidemiology and prevention, D Schottenfeld, JF Fraumeni, Jr. Oxford University Press, New YorkUS 2006; 995–1012
- Schiffman MH, Hildesheim A. Cervical cancer. Cancer epidemiology and prevention, D Schottenfeld, JF Fraumeni, Jr. Oxford University Press, New YorkUS 2006; 1044–67
- Cook LS, Weiss NS, Doherty JA, Chen C. Endometrial cancer. Cancer epidemiology and prevention, D Schottenfeld, JF Fraumeni, Jr. Oxford University Press, New YorkUS 2006; 1027–43
- DeVivo I, Persson I, Adami HO. Endometrial cancer. Textbook of cancer epidemiology, HO Adami, D Hunter, D Trichopoulos. Oxford University Press, New YorkUS 2008; 468–93
- Palmer JR, Feltmate CM. Choriocarcinoma. Cancer epidemiology and cancer, D Schottenfeld, JF Fraumeni, Jr. Oxford University Press, New YorkUS 2006; 1075–86
- Hankinson SE, Danforth KN. Ovarian cancer. Cancer epidemiology and prevention, D Schottenfeld, JF Fraumeni, Jr. Oxford University Press, New YorkUS 2006; 1013–26
- Boffetta P, Andersen A, Lynge E, Barlow L, Pukkala E. Employment as hairdresser and risk of ovarian cancer and non- Hodgkin's lymphomas among women. J Occup Med 1994; 36: 61–5
- Riska A, Sund R, Pukkala E, Gissler M, Leminen A. Parity, tubal sterilization, hysterectomy and risk of primary fallopian tube carcinoma in Finland, 1975–2004. Int J Cancer 2007; 120: 1351–4
- Riska A, Leminen A, Pukkala E. Sociodemographic determinants of incidence of primary fallopian tube carcinoma, Finland 1953–97. Int J Cancer 2003; 104: 643–5
- Madeleine MM, Daling JR. Cancers of the vulva and vagina. Cancer epidemiology and prevention, D Schottenfeld, JF Fraumeni, Jr. Oxford University Press, New YorkUS 2006; 1068–74
- Mucci L, Signorello LB, Adami HO. Prostate cancer. Textbook of cancer epidemiology, HO Adami, D Hunter, D Trichopoulos. Oxford University Press, New YorkUS 2008; 517–54
- Tretli S, Engeland A, Haldorsen T, Hakulinen T, Horte LG, Luostarinen T, et al. Prostate cancer–look to Denmark?. J Natl Cancer Inst 1996; 88: 128
- Kvale R, Auvinen A, Adami HO, Klint A, Hernes E, Moller B, et al. Interpreting trends in prostate cancer incidence and mortality in the five Nordic countries. J Natl Cancer Inst 2007; 99: 1881–7
- Platz EA, Giovannucci E. Prostate cancer. Cancer epidemiology and prevention, D Schottenfeld, JF Fraumeni, Jr. Oxford University Press, New YorkUS 2006; 1128–50
- Pukkala E, Weiderpass E. Socio-economic differences in incidence rates of cancers of the male genital organs in Finland, 1971–95. Int J Cancer 2002; 102: 643–8
- Akre O. Aetiological insights into the testicular cancer epidemic. Karolinska Institutet, StockholmSweden 1999
- Sarma AV, McLaughlin JC, Schottenfeld D. Testicular cancer. Cancer epidemiology and prevention, D Schottenfeld, JF Fraumeni, Jr. Oxford University Press, New YorkUS 2006; 1151–65
- Richiardi L, Tamimi R, Adami HO. Testicular cancer. Textbook of cancer epidemiology, HO Adami, D Hunter, D Trichopoulos. Oxford University Press, New YorkUS 2008; 555–72
- Wideroff L, Schottenfeld D. Penile cancer. Cancer epidemiology and prevention, D Schottenfeld, JF Fraumeni, Jr. Oxford University Press, New YorkUS 2006; 1166–72
- Peters RK, Mack TM, Bernstein L. Parallels in the epidemiology of selected anogenital carcinomas. J Natl Cancer Inst 1984; 72: 609–15
- McLaughlin JK, Lipworth L, Tarone RE, Blot WJ. Renal cancer. Cancer epidemiology and prevention, D Schottenfeld, JF Fraumeni, Jr. Oxford University Press, New YorkUS 2006; 1087–100
- Siemiatycki J, Richardson L, Boffetta P. Occupation. Cancer epidemiology and prevention, D Schottenfeld, JF Fraumeni. Oxford University Press, New YorkUS 2006; 322–54
- Kleemola P, Roos E, Pietinen P. [Dietary changes by the level of education; Finnish]. Sos Laaketiet Aikak 1996; 33(1)9–16
- Socialstyrelsen. [Public health report 1994. Reports of the National Board of Health and Welfare]. Vol 9. StockholmSweden: Socialstyrelsen; 1994.
- Silverman DT, Devesa SS, Moore LE, Rothman N. Bladder cancer. Cancer epidemiology and prevention, D Schottenfeld, JFJR Fraumeni. Oxford University Press, New YorkUS 2006; 1101–27
- International Agency for Research on Cancer (IARC). Overall evaluation of carcinogenecity: an updating of IARC Monographs, volumes 1–42. IARC monographs on the evaluation of carcinogenic risk to humans. Suppl 7. LyonFrance: IARC; 1987.
- International Agency for Research on Cancer (IARC). Polynuclear aromatic compounds, part I: chemical, environmental and experimental data. IARC Monographs on the evaluation of carcinogenic risk to humans. Vol 32. LyonFrance: IARC; 1983.
- Gruber SB, Armstrong BK. Cutaneous and ocular melanoma. Cancer epidemiology and prevention, D Schottenfeld, JF Fraumeni, Jr. Oxford University Press, New YorkUS 2006; 1196–229
- Fritschi L, Siemiatycki J. Melanoma and occupation: Results of a case-control study. Occup Environ Med 1996; 53: 168–73
- Vagero D, Swerdlow AJ, Beral V. Occupation and malignant melanoma: A study based on cancer registration data in England and Wales and in Sweden. Br J Ind Med 1990; 47: 317–24
- Perez-Gomez B, Pollan M, Gustavsson P, Plato N, Aragones N, Lopez-Abente G. Cutaneous melanoma: Hints from occupational risks by anatomic site in Swedish men. Occup Environ Med 2004; 61: 117–26
- Bruzell EM, Johnsen B, Aalerud TN, Christensen T. Evaluation of eye protection filters for use with dental curing and bleaching lamps. J Occup Environ Hyg 2007; 4: 432–9
- Pukkala E, Aspholm R, Auvinen A, Eliasch H, Gundestrup M, Haldorsen T, et al. Incidence of cancer among Nordic airline pilots over five decades: Occupational cohort study. BMJ 2002; 325(7364)567
- Karagas MR, Weinstock MA, Nelson HH. Keratinocyte carcinomas (Basal and squamous cell carcinomas of the skin). Cancer epidemiology and prevention, D Schottenfeld, JF Fraumeni, Jr. Oxford University Press, New YorkUS 2006; 1230–50
- Savitz D, Trichopoulos D. Brain cancer. Textbook of cancer epidemiology, HO Adami, D Hunter, D Trichopoulos. Oxford University Press, New YorkUS 2008; 617–35
- Ron E, Schneider AB. Thyroid cancer. Cancer epidemiology and prevention, D Schottenfeld, JFJR Fraumeni. Oxford University Press, New YorkUS 2006; 975–94
- Miller RW, Boice JD, Curtis RE. Bone cancer. Cancer epidemiology and prevention, D Schottenfeld, JFJR Fraumeni. Oxford University Press, New YorkUS 2006; 946–58
- Berwick M. Soft tissue sarcoma. Cancer epidemiology and prevention, D Schottenfeld, JF Fraumeni, Jr. Oxford University Press, New YorkUS 2006; 959–74
- Sandin S, Hjalgrim H, Glimelius B, Rostgaard K, Pukkala E, Askling J. Incidence of non-Hodgkin's lymphoma in Sweden, Denmark, and Finland from 1960 through 2003: An epidemic that was. Cancer Epidemiol Biomarkers Prev 2006; 15: 1295–300
- Hartge P, Wang SS, Bracci PM, Devesa SS, Holly EA. Non-Hodgkin lymphoma. Cancer epidemiology and prevention, D Schottenfeld, JF Fraumeni, Jr. Oxford University Press, New YorkUS 2006; 898–918
- Melbye M, Smedby KE, Trichopoulos D. Non-Hodgkin's lymphomas. Textbook of cancer epidemiology, HO Adami, D Hunter, D Trichopoulos. Oxford University Press, New YorkUS 2008; 669–93
- Mueller NE, Grufferman S. Hodgkin lymphoma. Cancer epidemiology and prevention, D Schottenfeld, JFJR Fraumeni. Oxford University Press, New YorkUS 2006; 872–97
- Melbye M, Hjalgrim H, Adami HO. Hodgkin's lymphoma. Textbook of cancer epidemiology, HO Adami, D Hunter, D Trichopoulos. Oxford University Press, New YorkUS 2008; 653–66
- Zheng T, Blair A, Zhang Y, Weisenburger DD, Zahm SH. Occupation and risk of non-Hodgkin's lymphoma and chronic lymphocytic leukemia. J Occup Environ Med 2002; 44: 469–74
- Amadori D, Nanni O, Falcini F, Saragoni A, Tison V, Callea A, et al. Chronic lymphocytic leukaemias and non-Hodgkin's lymphomas by histological type in farming-animal breeding workers: A population case-control study based on job titles. Occup Environ Med 1995; 52: 374–9
- Speer SA, Semenza JC, Kurosaki T, Anton-Culver H. Risk factors for acute myeloid leukemia and multiple myeloma: A combination of GIS and case-control studies. J Environ Health 2002; 64: 9–16
- Linet MS, Devesa SS, Morgan GJ. The leukemias. Cancer epidemiology and prevention, D Schottenfeld, JFJR Fraumeni. Oxford University Press, New YorkUS 2006; 841–71
- Bethwaite P, Cook A, Kennedy J, Pearce N. Acute leukemia in electrical workers: A New Zealand case-control study. Cancer Causes Control 2001; 12: 683–9
- Guo J, Kauppinen T, Kyyronen P, Heikkila P, Lindbohm ML, Pukkala E. Risk of esophageal, ovarian, testicular, kidney and bladder cancers and leukemia among Finnish workers exposed to diesel or gasoline engine exhaust. Int J Cancer 2004; 111: 286–92
- Morales-Suarez-Varela MM, Olsen J, Johansen P, Kaerlev L, Guenel P, Arveux P, et al. Occupational risk factors for mycosis fungoides: A European multicenter case-control study. J Occup Environ Med 2004; 46: 205–11
- Linet MS, McLaughlin JK, Malker HS, Chow WH, Weiner JA, Stone BJ, et al. Occupation and hematopoietic and lymphoproliferative malignancies among women: A linked registry study. J Occup Med 1994; 36: 1187–98
- Finnish Cancer Registry [Suomen Syöpärekisteri]. Cancer in Finland 2004 and 2005. Cancer Statistics of the National Research and Development Centre for Welfare and Health. No. 72. HelsinkiFinland: Finnish Cancer Registry; 2007.
- National Board of Health and Welfare [Socialstyrelsen], Centre for Epidemiology. Cancer incidence in Sweden 2006. Statistics- Health and Diseases. Vol 16. StockholmSweden: National Board of Health and Welfare; 2007, [cited 2007 Dec 19]. Available from: http://www.socialstyrelsen.se/Publicerat/2007/9850/2007-42-16.htm.
- Curado, MP, Edwards, B, Shin, HR, Storm, H, Ferlay, J, Heanue, M, et al. Cancer incidence in five continents. Vol IX. MP Curado, Edwards, B, Shin, HR, Storm, H, Ferlay, J, Heanue, M, , et al, IARC Scientific Publications No. 160. LyonFrance: IARC; 2007.
- Statistisk Sentralbyrå [Statistics Norway]. Folke- og boligtelling 1970. Kontrollundersøkelse [Population and housing census 1970. Evaluation survey]. Vol 6. OsloNorway: Statistisk Sentralbyrå; 1970. Norwegian.
- Statistiska centralbyrån [Statistics Sweden]. [Population and housing census 1970: results from the evaluation studies concerning economic activity and education]. Statistiska meddelanden Be. Vol 3. StockholmSweden: Statistiska centralbyrån; 1974. Swedish.
- Kolari, R. Occupational mortality in Finland 1975/1980/1985. HelsinkiFinland: Statisics Finland; 1989.
- Lynge E, Carstensen B, Andersen O. Primary liver cancer and renal cell carcinoma in laundry and dry-cleaning workers in Denmark. Scand J Work Environ Health 1995; 21: 293–5
- Meurman LO, Pukkala E, Hakama M. Incidence of cancer among anthophyllite asbestos miners in Finland. Occup Environ Med 1994; 51: 421–5
- Lynge, E. Dødelighet og erhverv 1970–75. Statistiske undersøgelser [Mortality and occupation 1970–75. Statistical investigations]. Vol 37. CopenhagenDenmark: Danmarks Statistik; 1979. Danish.
- Notkola, V, Pajunen, A,Leino-Arjas, P. Occupational mortalityby cause in Finland 1971–1991 and occupational mobility. SVT health. Vol 1. HelsinkiFinland: Statisics Finland; 1997.
- Pukkala E. Biobanks and registers in epidemiological research on cancer. Methods in biobanking. Methods in melocular biology, J Dillner. Humana Press, TotowaUS 2009
- Osterlind A, Jensen OM. [Evaluation of cancer registration in Denmark in 1977. Preliminary evaluation of cancer registration by the Cancer Register and the National Patient Register; Danish]. Ugeskr Laeger 1985; 147(31)2483–8
- Tulinius H, Storm HH, Pukkala E, Andersen A, Ericsson J. Cancer in the Nordic countries, 1981–86. A joint publication of the five Nordic Cancer Registries. APMIS 1992; 31(Suppl)S1–S194
- Larsen IK, Småstuen M, Parkin DM, Bray F. Data Quality at the Cancer Registry of Norway. Cancer in Norway 2006 - Cancer incidence, mortality, survival and prevalence in Norway. Cancer Registry of Norway, OsloNorway 2007
- Teppo L, Pukkala E, Lehtonen M. Data quality and quality control of a population-based cancer registry. Experience in Finland. Acta Oncol 1994; 33: 365–9
- Storm, HH,Manders, T,Spørgel, P,Bang, S,Jensen, OM. Cancer incidence in Denmark 1987. CopenhagenDenmark: Danish Cancer Society [Kræftens Bekæmpelse]; 1990.
- Vidarsdottir, H,Stefansdottir, S,Jonsdottir, A,Jonasson, JG,Trggvadottir, L. [Completeness and accuracy of cancer registration in Iceland. Internal report of Icelandic Cancer Registry]. ReykjavikIceland: Krabbameinsskrá Íslands; 2008. Icelandic.
- Mattson B. Cancer registration in Sweden. Karolinska Institutet, StockholmSweden 1984
- Barlow L, Westergren K, Holmberg L, Talback M. The completeness of the Swedish Cancer Register: a sample survey for year 1998. Acta Oncol 2009; 48(1)27–33
- Pukkala, E , Patama, T , Engholm, G , Ólafsdóttir, GH , Bray, F , Talbäck, M , et al . Small-area based map animations of cancer incidence in the Nordic countries, 1971–2003. Nordic Cancer Union; 2007. Available from: http://astra.cancer.fi/cancermaps/Nordic/.
- Pukkala E, Notkola V. Cancer incidence among Finnish farmers, 1979–93. Cancer Causes Control 1997; 8: 25–33
- Peto R, Lopez AD, Boreham J, Thun M, Heath C. Mortality from smoking in developed countries 1950–2000: Indirect estimates from national vital statistics. Oxford University Press, OxfordUK 1994
- Graham H. Smoking prevalence among women in the European community 1950–1990. Soc Sci Med 1996; 43: 243–54
- Cavelaars AE, Kunst AE, Geurts JJ, Crialesi R, Grotvedt L, Helmert U, et al. Educational differences in smoking: International comparison. BMJ 2000; 320(7242)1102–7
- Helakorpi, S,Uutela, A,Prättälä, R,Berg, M-A,Puska, P. Suomalaisen aikuisväestön terveyskäyttäytyminen, kevät 1997 [Health behaviour among Finnish adult population, Spring 1997]. Publications of the National Public Health Institute B. No. 10. HelsinkiFinland: Kansanterveyslaitos; 1997. Finnish.
- Pukkala E, Guo J, Kyyronen P, Lindbohm ML, Sallmen M, Kauppinen T. National job-exposure matrix in analyses of census-based estimates of occupational cancer risk. Scand J Work Environ Health 2005; 31: 97–107
- Ragnarsson, J,Blöndal, T. Reykingavenjur 1985–1988 [Smoking habits 1985–1988]. ReykjavikIceland: Tóbaksvarnarnefnd og Landlæknisembættið; 1989. Icelandic.
- Hansen, EJ,Andersen, D. Alkoholforbrug og alkoholpolitik [Alcohol consumption and alcohol politics]. Vol 145. CopenhagenDenmark: Socialforskningsinstituttet; 1985. Danish.
- Jensen OM. Cancer morbidity and causes of death among Danish brewery workers. Int J Cancer 1979; 23: 454–63
- Kjaerheim K, Andersen A. Incidence of cancer among male waiters and cooks: Two Norwegian cohorts. Cancer Causes Control 1993; 4: 419–26
- Martelin, T. Tupakointitapojen kehitys Suomessa haastatteluja kyselyttutkimusten valossa [The development of smoking habits according to survey data in Finland]. Health education: original report series. Vol 1. HelsinkiFinland: Lääkintöhallitus; 1984. Finnish.
- World Cancer Research Fund (WCRF); American Institute for Cancer Research (AICR). Fats and oils. In: Food, Nutrition, Physical Activity, and the Prevention of Cancer: a Global Perspective. WashingtonDC (US): AICR; 2007. p. 135–140.
- Johansson L, Thelle DS, Solvoll K, Bjorneboe GE, Drevon CA. Healthy dietary habits in relation to social determinants and lifestyle factors. Br J Nutr 1999; 81: 211–20
- Lund-Larsen, K. Kostholdsdata fra forbrukerundersøkelsen 1986–88 [Dietary data from the consumer survey 1986–88]. AKF Tablereport No. 8. OsloNorway: Institutt for ernæringsforskning, Universitetet i Oslo; 1991. Norwegian.
- Roos E, Prattala R, Lahelma E, Kleemola P, Pietinen P. Modern and healthy?: Socioeconomic differences in the quality of diet. Eur J Clin Nutr 1996; 50: 753–60
- Steingrímsdóttir, L,þorgeirsdóttir, H,Ægisdóttir, S. Mataræði og mannlif [Food consumption and people's life]. Könnun á mataræði Íslendinga [Survey on food consumption in Iceland]. No. 2. ReykjavikIceland: Manneldisráð Íslands; 1992. Icelandic.
- World Cancer Research Fund (WCRF); American Institute for Cancer Research (AICR) . Body fatness. In: Food, Nutrition, Physical Activity, and the Prevention of Cancer: A global perspective. WashingtonDC (US): AICR; 2007. p. 211–28.
- World Cancer Research Fund (WCRF); American Institute for Cancer Research (AICR) . Physical activity. In: Food, Nutrition, Physical Activity, and the Prevention of Cancer: a Global Perspective. WashingtonDC (US): AICR; 2007. p. 198–209.
- Tamimi R, Hankinson SE, Hunter D. Breast cancer. Textbook of cancer epidemiology, HO Adami, D Hunter, D Trichopoulos. Oxford University Press, New YorkUS 2008; 403–45
- Webb P, Gertig D, Hunter D. Ovarian cancer. Textbook of cancer epidemiology, HO Adami, D Hunter, D Trichopoulos. Oxford University Press, New YorkUS 2008; 494–516
- Hinkula M, Pukkala E, Kyyronen P, Kauppila A. Incidence of ovarian cancer of grand multiparous women–a population-based study in Finland. Gynecol Oncol 2006; 103: 207–11
- Tryggvadottir L, Tulinius H, Eyfjord JE, Sigurvinsson T. Breast cancer risk factors and age at diagnosis: An Icelandic cohort study. Int J Cancer 2002; 98: 604–8
- Mørkeberg, H. Fødslers placering i familiens livsforløb [Child-spacing in the family life cycle]. Socialforskningsinstituttet rapport No. 68. CopenhagenDenmark: Socialforskningsinstituttet; 1976. Danish.
- Hoem, B. Lärare föder fler barn [Teachers have more children]. Välfärdsbulletinen No. 3. StockholmSweden: Statistiska centralbyrån; 1994. p. 17–9. Swedish.
- Lund E. The cancer registry of Norway: pilot study for the evaluation of completeness of reporting to the Cancer Registry. Cancer Registry of Norway, OsloNorway 1981
Appendix 1. Abbreviations of the occupational categories defined by NYK-codes and ISCO-1958 codes.
Appendix 2. Description of the occupational categories.
Appendix 3. Number of persons under follow-up by gender, country and occupational category.
Appendix 4. Number of persons-years under follow-up by gender, country and occupational category.
Appendix 5. Number of new cancer cases during the follow-up period, by country. Men.
Appendix 6. Number of new cancer cases during the follow-up period, by country. Women.
Table of contents: Occupation and cancer – follow-up of 15 million people in five Nordic countries