
Abstract
Background: Solid tumors are known to be spatially heterogeneous. Detection of treatment-resistant tumor regions can improve clinical outcome, by enabling implementation of strategies targeting such regions. In this study, K-means clustering was used to group voxels in dynamic contrast enhanced magnetic resonance images (DCE-MRI) of cervical cancers. The aim was to identify clusters reflecting treatment resistance that could be used for targeted radiotherapy with a dose-painting approach.
Material and methods: Eighty-one patients with locally advanced cervical cancer underwent DCE-MRI prior to chemoradiotherapy. The resulting image time series were fitted to two pharmacokinetic models, the Tofts model (yielding parameters Ktrans and νe) and the Brix model (ABrix, kep and kel). K-means clustering was used to group similar voxels based on either the pharmacokinetic parameter maps or the relative signal increase (RSI) time series. The associations between voxel clusters and treatment outcome (measured as locoregional control) were evaluated using the volume fraction or the spatial distribution of each cluster.
Results: One voxel cluster based on the RSI time series was significantly related to locoregional control (adjusted p-value 0.048). This cluster consisted of low-enhancing voxels. We found that tumors with poor prognosis had this RSI-based cluster gathered into few patches, making this cluster a potential candidate for targeted radiotherapy. None of the voxels clusters based on Tofts or Brix parameter maps were significantly related to treatment outcome.
Conclusion: We identified one group of tumor voxels significantly associated with locoregional relapse that could potentially be used for dose painting. This tumor voxel cluster was identified using the raw MRI time series rather than the pharmacokinetic maps.
A wide range of studies suggests that tumor heterogeneity could become an important biomarker for tumor grading and treatment outcome [Citation1,Citation2]. There is spatial heterogeneity within each tumor, as well as heterogeneity between tumors. Intratumor heterogeneity suggests regions with different physiological properties within the tumor, which may respond differently to treatment. Early identification of such regions can be used to visualize treatment-resistant areas and could therefore be useful in planning targeted therapy.
Functional imaging, such as dynamic contrast enhanced magnetic resonance imaging (DCE-MRI), gives insight into the tumor microenvironment and allows us to assess the heterogeneity within the tumor [Citation1,Citation3]. Pharmacokinetic models can be fitted to DCE-MRI data to ease interpretation of the dynamic image series and to link the information captured in the images to physiological parameters. Two models often used in studies of cervical cancer patients are the Tofts and the Brix models [Citation4,Citation5]. These models are based on different underlying assumptions. The Tofts model requires a measurement of the arterial input function, whereas the Brix model assumes a monoexponential venous clearance of contrast agent. Both Tofts and Brix parameters have been shown to correlate with treatment outcome for cervical cancer [Citation6,Citation7].
Unsupervised clustering techniques such as the K-means clustering algorithm can be used to group voxels according to similarity, without requiring any prior assumptions or knowledge about the voxels [Citation8]. The K-means algorithm is fast and robust, and is appropriate for large data sets, consisting of thousands to millions of voxels [Citation8]. K-means clustering and similar methods may be used in segmenting MR images of the brain [Citation9], but have also been utilized for segmentation of cervical cancers [Citation10]. In a previous study, we used K-means analysis of Tofts parameter maps to identify a voxel cluster associated with treatment outcome [Citation11]. As this cluster was associated with local control, not relapse, it was not a good candidate for targeted therapy. Similar cluster analysis based on Brix parameter maps is particularly appealing, as the Brix amplitude parameter ABrix is known to reflect hypoxia in cervical cancer [Citation12,Citation13]. Unprocessed DCE-MRI data may also be attractive for clustering. Thus, a more comprehensive analysis of cluster features based on DCE-MRI for cervical cancer is warranted.
In this study, we investigated the association between tumor voxel clusters and treatment outcome for patients with locally advanced cervical cancer. Tumor voxels with similar properties were grouped into clusters using the K-means algorithm. Clustering was based on the unprocessed DCE-MRI time series or on physiological parameters derived from the Tofts or Brix models. The cluster volume fractions as well as the spatial distribution of the clusters were then tested for associations with treatment outcome. The significant voxel clusters were evaluated for their potential to be used in treatment planning.
Material and methods
Patients
Eighty-one patients with locally advanced cervical cancer underwent DCE-MRI prior to chemoradiotherapy (). We obtained written informed consent from all patients, and the Regional Committee for Medical Research Ethics in southern Norway approved the study.
Table 1. Summary of the patient cohort. Some statistics are reported as median value (range).
All patients received chemoradiotherapy with curative intent. External beam radiotherapy was given over five weeks (25 fractions; 2 Gy/fr to tumor, 1.8 Gy/fr to pelvis). In addition, each patient was given 5–6 fractions of intracavitary brachytherapy (4.2 Gy/fr) and cisplatin chemotherapy (40 mg/m2 per week).
The clinical end-point was locoregional control, defined as control within the irradiated pelvis. As shows, 32 patients relapsed, nine with local failure and 28 with metastasis. Five patients had both locoregional and distant failure.
Imaging
MRI was performed using a 1.5 T Signa Horizon LX tomograph (GE Medical Systems, Milwaukee, WI, USA) with a pelvic phased array coil. For tumor delineation, we used an axial T2-weighted fast spin echo sequence (FSE; TR, 4220 ms; TE, 85 ms; matrix size, 512 × 512; field of view, 200 mm; slice thickness, 5 mm; slice gap, 1 mm). The DCE-MRI series was acquired using an axial T1-weighted fast spoiled gradient recalled sequence (FSPGR; flip angle, 90°; echo time, 3.6 ms; repetition time, 80 ms; matrix size, 256 × 256; field of view, 200 mm; slice thickness, 5 mm; slice gap, 1 mm). The contrast agent Gd-DTPA (Magnevist®; Schering, Berlin, Germany) was administered manually as a fast bolus injection with a total dose of 0.1 mmol/kg body weight followed by a saline flush.
The DCE-MRI series consisted of one pre-contrast image and up to 13 images acquired after contrast agent injection. The sampling interval was 15 seconds for the first 11 images and one minute for the last two images.
Pharmacokinetic analysis
Voxel clustering based on the Tofts model [Citation5] and the Brix model [Citation4] was compared. Details about these models, as well as the model fitting, can be found in the Supplementary Materials (available online at http://www.informahealthcare.com). Both of these models describe the relative signal increase (RSI) as a function of the time t after contrast injection. The Tofts model yields two parameters. Ktrans is the transfer constant of the contrast agent from the blood to the extravascular extracellular space (EES) and νe is the volume fraction of the EES in the voxel. The Brix model uses three parameters. ABrix is the amplitude, kep is the transfer rate of contrast agent from tissue to blood and kel is the wash-out rate of contrast agent from the blood [Citation4]. Voxels with very high unphysiological values of the pharmacokinetic parameters, ABrix >10, kep >12 min−1 and/or kel >0.5 min−1, were excluded from further analysis after the Brix model fitting. About 0.3% of the voxels had unphysiologically high RSI values (RSI >8). These values were considered as outliers, and were removed before the cluster analysis of the RSI maps.
K-means cluster analysis
K-means cluster analysis is an unsupervised method for dividing data into groups, or clusters, with similar properties [Citation8,Citation14]. In this study, we clustered the image voxels based on the pharmacokinetic parameters (Tofts model: Ktrans, νe; Brix model: ABrix, kep, kel) or on the RSI time series. The clustering algorithm used the squared Euclidian distance, and 30 replicates with different initializations. Initializations had only very minor effects on the resulting clusters (data not shown). The data was scaled to mean zero and standard deviation one before the cluster analysis. The optimal number of clusters was found, as previously described in [Citation11], by comparing the mean intra-cluster distance with the minimum inter-cluster distance [Citation14]. To check the robustness of the clustering, we divided the voxels into clusters based only on the central slice of each tumor, and compared the resulting cluster centroids with the centroid of the clusters based on all tumor voxels in all slices.
Spatial distribution of voxel clusters
The spatial distribution of the voxel clusters within each tumor was analyzed by comparing the number and size of connected areas or patches formed by each cluster. We examined the spatial distribution of clusters in the central slice of each tumor. For each cluster, we counted the number of connected areas (NumArea) formed by the voxels belonging to the cluster. We also calculated the median size (number of voxels) of the connected areas (SizeArea). These two measures were used to assess the heterogeneity of clusters within the tumors. To enable comparison between tumors, both SizeArea and NumArea were normalized by dividing by the total number of voxels in the tumor slice.
Statistical analysis
The volume fraction of each voxel cluster was calculated for each tumor. The patients were then divided in two groups based on the median cluster volume fraction (CVF). In addition, we grouped the patients according to the median value of the spatial parameters SizeArea and NumArea. Differences in treatment outcome between the groups were estimated by log-rank tests and visualized using the Kaplan-Meier estimator. All p-values reported are two-sided and we used a significance level of 0.05 after Bonferroni correction. The association between tumor volume and CVF or the spatial parameters was examined with Pearson’s correlation analysis.
Calculations
The log-rank tests were conducted in R (v3.2.0) using the survival library. All other analyses were conducted in MATLAB (v8.3, R2014a, The Mathworks Inc., Natick, MA, USA). For the K-means cluster analysis and the correlation tests, we used the MATLAB Statistics Toolbox (v9.0). The spatial distribution features were calculated using the MATLAB Image Processing Toolbox (v9.0).
Results
The optimal K-means clustering based on the Tofts parameters divided the voxels into one large and two smaller clusters, as shown in (top row) for two tumors with different treatment outcomes. With the exception of one patient, who had no voxels belonging to the Tofts3 cluster, all tumors contained voxels from all three clusters. shows the centroid of each K-means cluster, as well as the median CVF. The largest voxel cluster, Tofts2, had a median volume fraction of 62%. Although initial significance screening suggested significant relationship between Tofts1 and locoregional relapse (nominal p-value 0.04), this was not significant after correction for multiple testing.
Figure 1. Tofts (top), Brix (middle) and RSI (bottom) voxel clusters in the central slice of tumors from two different patients. These patients had no relapse (left) or locoregional relapse (right), respectively. The white areas in some of the slices are voxels excluded due to unphysiological parameter values.
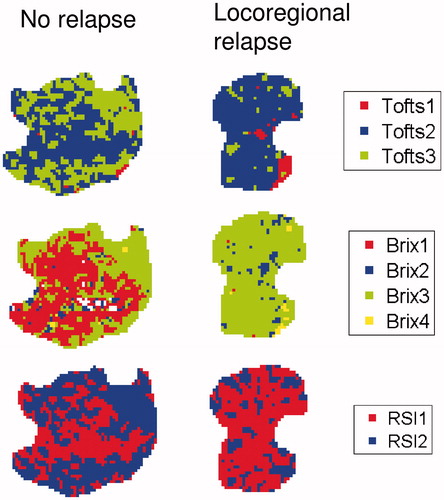
Table 2. Ktrans and νe values for the centroids of the three Tofts-based voxel clusters. The last column gives the median cluster volume fraction (CVF) of the cluster in each tumor.
The optimal clustering based on the Brix parameters resulted in one relatively large cluster, Brix3, with a median CVF of 66% and three smaller clusters (, ). Most tumors contained voxels from all four clusters. The exception was the Brix1 cluster, which was not represented in two tumors, and the Brix4 cluster, which was not seen in three tumors. After Bonferroni correction, none of the Brix clusters were significantly related to treatment outcome.
Table 3. ABrix, kep and kel values for the centroids of the four Brix-based voxel clusters. The last column gives the median cluster volume fraction (CVF) of the cluster in each tumor.
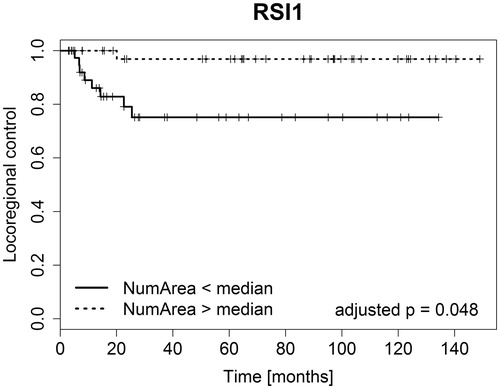
Clustering based on the RSI data resulted in two clusters shown in . The time curves representing the centroids of these clusters, shown in , indicated that RSI1 was a cluster of low-enhancing voxels, while RSI2 contained high-enhancing voxels. The RSI1 cluster was the largest, with a median CVF of 58%, while the RSI2 cluster had a median CVF of 42%. With the exception of one patient, all tumors contained voxels from both clusters. This tumor had only RSI1, i.e. low-enhancing voxels. The number of connected areas (NumArea) of the low-enhancing RSI1 cluster was significantly related to locoregional control (adjusted p-value 0.048, ). Patients with few connected RSI1 areas (NumArea), that is a less patchy distribution of this cluster, had poorer treatment outcomes compared to patients with many low-enhancing patches scattered throughout the tumor (). The NumArea parameter for RSI1 had a significant negative correlation to total tumor volume (p-value <0.001), indicating that larger tumors had fewer low-enhancing patches relative to smaller tumors.
Figure 2. RSI time curves representing the centroids of the two RSI voxel clusters. RSI1 (solid line) was a cluster of low-enhancing voxels, while RSI2 (dashed line) consisted of high-enhancing voxels. The median volume fraction of these voxel clusters was 58% for RSI1 and 42% for RSI2.
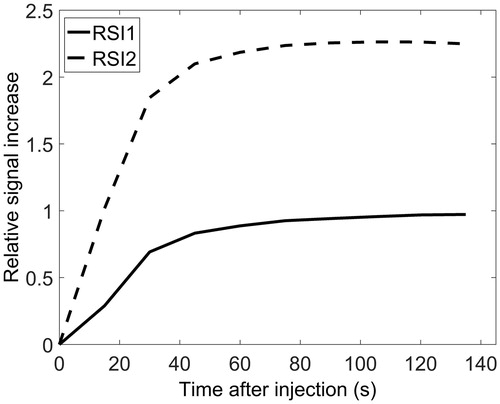
Figure 3. Plot of the Kaplan-Meier estimators for the tumor voxel cluster showing significant differences in treatment outcome between patient groups. Clustering was based on the RSI values. NumArea was the number of connected areas formed by this cluster.
We also performed log-rank test after dividing the patients into two groups according to tumor volume. The tumor volume was not significantly associated with locoregional control (p-value 0.51).
Discussion
Previous work has suggested a potential role of Tofts, Brix and RSI parameters in the treatment planning of cervical cancer [Citation6,Citation15]. Our work may facilitate this strategy by proposing a method for visualizing treatment-resistant regions within the tumors. In this study, we identified a tumor voxel cluster in DCE-MR images that was significantly related to locoregional relapse for patients with cervical cancer. This cluster was based on the RSI, not on the pharmacokinetic maps.
The RSI-based cluster significantly related to locoregional relapse consisted of voxels with low contrast enhancement. Tumor regions of low enhancement most likely reflect areas of low perfusion, low oxygen concentration and thus high radioresistance. These characteristics have previously been found to be negatively associated with outcome [Citation15,Citation16], in line with the findings of this study. The low-enhancement cluster was also found to be significantly correlated to tumor volume. However, tumor volume was not significantly related to locoregional control. Therefore, the significant association between the low-enhancing cluster and locoregional control was not due to correlation with tumor volume, but rather the physiological characteristics of the cluster.
Despite the significance of the RSI-based cluster, none of the Tofts or the Brix clusters were significantly associated with outcome after correction for multiple testing. This suggests that analyzing the raw RSI data retains information related to outcome that may have been lost by pharmacokinetic model fitting. The choice of pharmacokinetic model is much debated [Citation17,Citation18], but our results indicate that pharmacokinetic modeling can be bypassed and the RSI values can be used directly.
It should be noted that Andersen et al. [Citation11] also found three Tofts clusters when analyzing this dataset, but that these clusters are not identical to the ones identified in the current study, due to different scaling of the data. Andersen et al. found that the Tofts-based clusters were mainly separated by νe, and not Ktrans, while the Tofts-based clusters in the current study were separated by both pharmacokinetic parameters, as shown in . The data scaling of the current study thus ensured that both Tofts parameters were reflected in the voxel clusters.
The spatial distribution of the voxel clusters is important if they are to be used for targeted radiotherapy in the form of dose painting [Citation19]. Such tailored treatment will be easier to implement for a continuous tumor region than for more scattered clusters [Citation20]. Voxel clusters related to locoregional relapse would be most relevant to use for dose painting, as such clusters would indicate radiotherapy-resistant areas in the tumor [Citation19]. Of the clusters identified in the current study, the low-enhancing RSI1 cluster appears to be the best candidate for dose painting. In tumors with poor prognosis the low-enhancing RSI1 voxels were gathered in few patches, which potentially could receive a radiation boost. Regions showing low contrast enhancement have in fact been proposed as targets for dose painting [Citation21]. Our study confirms that these regions are indeed linked to locoregional relapse.
In conclusion, voxels from pretreatment DCE-MRIs of cervical cancers were grouped into clusters, one of which was related to locoregional recurrence. This cluster, based on the RSI time series, could potentially be used for targeted radiotherapy.
SupplementaryMaterials.docx
Download MS Word (17.1 KB)Conflicts of interest
The authors report no conflicts of interest. The authors alone are responsible for the content and writing of the paper.
Related Research Data
References
- Alic L, Niessen WJ, Veenland JF. Quantification of heterogeneity as a biomarker in tumor imaging: a systematic review. Plos One 2014;9:e110300.
- O'Connor JPB, Rose CJ, Waterton JC, et al. Imaging intratumor heterogeneity: role in therapy response, resistance, and clinical outcome. Clin Cancer Res 2015;21:249–57.
- Dewhirst MW, Chi J-T. Understanding the tumor microenvironment and radioresistance by combining functional imaging with global gene expression. Semin Radiat Oncol 2013;23:296–305.
- Tofts PS. Modeling tracer kinetics in dynamic Gd-DTPA MR imaging. J Magn Reson Imaging 1997;7:91–101.
- Tofts PS, Brix G, Buckley DL, et al. Estimating kinetic parameters from dynamic contrast-enhanced t1-weighted MRI of a diffusable tracer: standardized quantities and symbols. J Magn Reson Imaging 1999;10:223–32.
- Andersen EK, Hole KH, Lund KV, et al. Pharmacokinetic parameters derived from dynamic contrast enhanced MRI of cervical cancers predict chemoradiotherapy outcome. Radiother Oncol 2013;107:117–22.
- Torheim T, Malinen E, Kvaal K, et al. Classification of dynamic contrast enhanced MR images of cervical cancers using texture analysis and support vector machines. IEEE Trans Med Imaging 2014;33:1648–56.
- Jain AK, Murty MN, Flynn PJ. Data clustering: a review. ACM Comput Surv 1999;31:264–323.
- Gordillo N, Montseny E, Sobrevilla P. State of the art survey on MRI brain tumor segmentation. Magn Reson Imaging 2013;31:1426–38.
- Haack S, Tanderup K, Kallehauge JF, et al. Diffusion-weighted magnetic resonance imaging during radiotherapy of locally advanced cervical cancer – treatment response assessment using different segmentation methods. Acta Oncologica 2015;54:1535–42.
- Andersen EK, Kristensen GB, Lyng H, et al Pharmacokinetic analysis and k-means clustering of DCEMR images for radiotherapy outcome prediction of advanced cervical cancers. Acta Oncol 2011;50:859–65.
- Halle C, Andersen E, Lando M, et al. Hypoxia-induced gene expression in chemoradioresistant cervical cancer revealed by dynamic contrast-enhanced MRI. Cancer Res 2012;72:5285–95.
- Loncaster JA, Carrington BM, Sykes JR, et al. Prediction of radiotherapy outcome using dynamic contrast enhanced MRI of carcinoma of the cervix. Int J Radiat Oncol Biol Phys 2002;54:759–67.
- Rokach L. A survey of Clustering Algorithms. In: Maimon O, Rokach L, eds. Data Mining and Knowledge Discovery Handbook. US: Springer; 2010. 269–98.
- Andersen EKF, Hole KH, Lund KV, et al. Dynamic contrast-enhanced MRI of cervical cancers: temporal percentile screening of contrast enhancement identifies parameters for prediction of chemoradioresistance. Int J Radiat Oncol Biol Phys 2012;82:e485–e92.
- Mayr NA, Huang Z, Wang JZ, et al. Characterizing tumor heterogeneity with functional imaging and quantifying high-risk tumor volume for early prediction of treatment outcome: cervical cancer as a model. Int J Radiat Oncol Biol Phys 2012;83:972–9.
- Kallehauge JF, Tanderup K, Duan C, et al. Tracer kinetic model selection for dynamic contrast-enhanced magnetic resonance imaging of locally advanced cervical cancer. Acta Oncologica 2014;53:1064–72.
- Eyal E, Degani H. Model-based and model-free parametric analysis of breast dynamic-contrast-enhanced MRI. NMR In Biomed 2009;22:40–53.
- Ling CC, Humm J, Larson S, et al. Towards multidimensional radiotherapy (MD-CRT): biological imaging and biological conformality. Int J Radiat Oncol Biol Phys 2000;47:551–60.
- Arnesen MR, Knudtsen IS, Rekstad BL, et al. Dose painting by numbers in a standard treatment planning system using inverted dose prescription maps. Acta Oncologica 2015;54:1607–13.
- Malinen E, Søvik Å, Hristov D, et al. Adapting radiotherapy to hypoxic tumours. Phys Med Biol 2006;51:4903.