
Abstract
Background: Delineation accuracy of the gross tumor volume (GTV) in radiotherapy planning for head and neck (H&N) cancer is affected by computed tomography (CT) artifacts from metal implants which obscure identification of tumor as well as organs at risk (OAR). This study investigates the impact of metal artifact reduction (MAR) in H&N patients in terms of delineation consistency and dose calculation precision in radiation treatment planning.
Material and methods: Tumor and OAR delineations were evaluated in planning CT scans of eleven oropharynx patients with streaking artifacts in the tumor region preceding curative radiotherapy (RT). The GTV-tumor (GTV-T), GTV-node and parotid glands were contoured by four independent observers on standard CT images and MAR images. Dose calculation was evaluated on thirty H&N patients with dental implants near the treated volume. For each patient, the dose derived from the clinical treatment plan using the standard image set was compared with the recalculated dose on the MAR image dataset.
Results: Reduction of metal artifacts resulted in larger volumes of all delineated structures compared to standard reconstruction. The GTV-T and the parotids were on average 22% (p < 0.06) and 7% larger (p = 0.005), respectively, in the MAR image plan compared to the standard image plan. Dice index showed reduced inter-observer variations after reduction of metal artifacts for all structures. The average surface distance between contours of different observers improved using the MAR images for GTV and parotids (p = 0.04 and p = 0.01). The median volume receiving a dose difference larger than ±3% was 2.3 cm3 (range 0–32 cm3).
Conclusions: Delineation of structures in the head and neck were affected by metal artifacts and volumes were generally larger and more consistent after reduction of metal artifacts, however, only small changes were observed in the dose calculations.
Introduction
Modern external beam radiotherapy (RT) planning is based on computed tomography (CT) scans. The planning CT serves two main purposes in RT: to accurately define the target areas and organs at risk (OAR) in the treatment reference frame and to provide the basis for calculation of dose deposition within the patient [Citation1]. The accuracy of the RT plan thus relies on the precision of the CT scan in relation to the true anatomy of the patient.
In the treatment preparation of head and neck (H&N) cancer patients, metallic fillings and dental implants often produce image artifacts on the planning CT due to the high attenuation. Metal artifacts are misrepresentations of the attenuation of the implant itself and the surrounding tissues may be characterized by incorrect Hounsfield units (HU) in the CT image [Citation2]. Such artifacts may potentially impair the visualization and subsequent delineation of tumor extension and OAR. Thus, reducing artifacts from metallic objects may improve the delineation precision of tumor and OAR. In addition, images marked by artifacts will invoke incorrect dose calculation due to erroneous HU pixel values in the dose calculation [Citation3,Citation4].
There are several metal artifact reduction (MAR) software techniques that can reduce the impact of metal in CT images such as interpolations in sinograms, iterative seeding of volumes with known metal components, and filtering metal components out of images. In recent years, commercial MAR software products have become available [Citation5,Citation6]. Such algorithms produce more precise HU representations of patients [Citation7] as demonstrated for different metal implants in various anatomical sites. These studies have mainly focused on image improvement [Citation8–10] and dose calculation effects in phantoms [Citation8,Citation11]. The present study investigates whether application of a MAR algorithm in radiation treatment planning of H&N patients affects the precision of tumor and OAR delineation as assessed by inter-observer variations and changes in calculated absorbed doses in the H&N.
Material and methods
The assessment of MAR on H&N delineation precision and dose calculation was performed in two separate studies.
Delineation precision
During a 3-month period, 56 H&N patients were scanned on a 16-slice Philips Big Bore CT Scanner (Philips Medical Systems, Best, the Netherlands) prior to intended curative RT. In 11 oropharyngeal cancer patients, streaking artifacts from metallic dental implants were observed adjacent to the tumor site. The prescribed dose was 66–68 Gy in 33–34 fractions, six fractions per week according to guidelines from the Danish Head and Neck Cancer Group (DAHANCA) [Citation12].
The patients were immobilized using an Orfit thermoplastic Efficast mask fixed to an AIO base plate, as described in Hansen et al. [Citation13]. All 11 patients presented with a tumor and five patients with a neck metastasis in proximity to the metal artifacts. In six patients, artifacts were evenly distributed bilaterally, in three cases, artifacts predominated on the left hand side, and in two cases on the right hand side.
From the identical raw CT sinogram data, two image sets were reconstructed: one standard image set with the normal clinical settings, and a second image set where the O-MAR algorithm was applied. Simplified, the algorithm initially classifies the scanned tissues into metal and non-metal components. Then, a sinogram is produced as metal data is removed and replaced with interpolated tissue values. From this sinogram, a corrected image with reduced metal artifacts is back projected [Citation7].
All O-MAR image sets were visually reviewed and compared with the standard image sets to validate that the reconstruction was appropriate.
Three experienced radiation oncologists and one experienced radiologist independently delineated the primary tumor (GTV-T) in all patients. Positron emission tomography (PET)/CT positive lymph node metastases (GTV-node) were delineated in five patients irrespectively that the CT was only slightly affected by artifacts.
First, delineations were made on standard reconstructed CT images, and at least 1 month later delineations were made on CT images reconstructed with O-MAR. For the delineation process, all standard information, such as patient files, diagnostic images and surgical reports were available to reflect the clinical situation.
The parotid glands were chosen for delineation for the purpose of this study being the closest OAR in proximity to the dental implants, and for the high priority in the planning process of reducing the risk of xerostomia [Citation14]. The parotids were delineated by four experienced radiation therapists (R.T.T.), as described by Brouwer et al. [Citation15].
The difference in contouring between the observers was evaluated by: differences in volumes, Dice similarity coefficient (DSC) and average surface distance (ASD).
(1)
where, VolX∩Y is the volume of the intersection of the two contours and VolX and VolY are the volumes of the two individual contours. A perfect match would result in a DSC of 1, and a DSC value of 0 represents no overlap of the two structures. The DSC was calculated as the mean DSC of all possible combinations of pairs of structures in both reconstruction data sets [Citation16,Citation17]. The ASD between the contours is defined as the average distances from all points of one contour, created by one observer, to another contour of the same structure delineated by a different observer. A perfect contour match would therefore result in an ASD of 0. The mean ASD was calculated mean of all possible combinations of pairs of structures in both reconstruction data sets.
Paired Student’s t-test between volumes, DSC and ASD were used to evaluate the statistical significance of the observed differences (p < 0.05).
Dose calculation
The first 30 H&N patients with dental implants near the high-dose region were included in this part of the study. Again, two image data sets were reconstructed from the same raw sinogram data: one standard image set with the usual clinical settings and a second image set with the O-MAR algorithm applied. The RTT performing the CT scan visually reviewed and compared all O-MAR image sets with the standard image sets to validate that the reconstruction was appropriate.
For each patient, a step-and-shoot intensity-modulated radiation therapy (ssIMRT) or volumetric arc therapy (VMAT) treatment plan was generated using the standard image set in Pinnacle3 Ver. 9.8 (Philips Healthcare, Fitchburg, WI). The ssIMRT was used for 22 of the 30 patients, with a median of seven beams per plan (range 5–10 beams). For eight patients, a single 360° VMAT arc with 2° control point spacing was used [Citation18]. All plans were generated with the same scripted template in the dose planning system ensuring plan quality consistency between the plans. Each plan was re-calculated on the O-MAR image data set and both dose cubes were exported for dose calculation analysis.
For each voxel inside of the body contour of the CT scan, the HU differences were calculated as:
(2)
and for each dose voxel in the dose cube inside body contour, the differences were calculated as:
(3)
The scan voxel size of the CT scans was 1.0 × 1.0 × 3.0 mm and the dose voxels were 3 × 3× 3 mm.
Results
Delineation precision
Mean DSC, ASD and structure volumes are shown in . For the GTV-T and parotid glands, the DSC was improved on the O-MAR reconstruction. However, this was only statistically significant for the parotid glands (p = 0.001). For GTV-node, the DSC was unchanged.
Table 1. Mean DSC, ASD and volume for standard CT and with O-MAR (±1 standard deviation) for 11 oropharyngeal cancer patients.
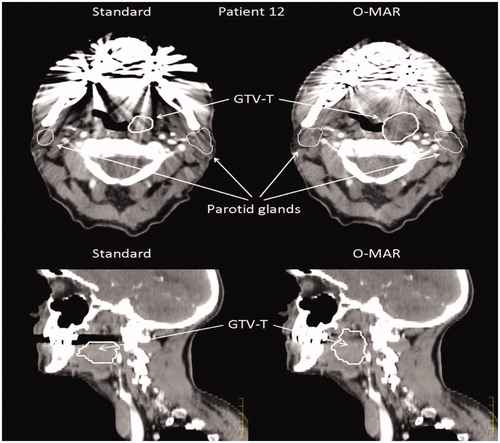
The mean ASD improved significantly on the O-MAR for both the GTV-T and the parotids from 3.8 to 2.2 mm and 3.5 to 1.8 mm, respectively. In the 11 included patients, large differences in tumor delineation were seen in a few patients, as exemplified in , where the same observer contoured the GTV-T very differently. The GTV-node did not improve.
Figure 1. Two examples of delineations performed on the same CT scan of Patient 12 before and after reconstruction with O-MAR. Large differences in GTV-T can be seen in particular in the sagittal plan, where lack of signal in the standard CT impair tumor delineation.
The mean volumes of all delineated structures were larger on O-MAR compared to the than standard reconstruction. The GTV-T increased from 16 to 20 cm3 (p < 0.06) and the parotids increased from 20 to 21 cm3 (p = 0.005).
Dose calculation
For all 30 patients in this part of the study, the reconstruction with the O-MAR algorithm resulted in improved visual quality of the CT images as shown in . In these patients, the average difference of HU between the standard CT set and the O-MAR filter set across the full CT scan was 0.05 ± 0.09 HU, and the average difference of dose was −0.2 ± 1.4 cGy (uncertainties given as one standard deviation). The median volume of a dose difference larger than ±1% and ±3% of the prescribed dose was 8.4 cm3 (range 0.24–99 cm3) and 2.3 (0–32 cm3), respectively, as illustrated in .
Figure 2. (A–G) Slices of Patient 7 reconstructed with and without the O-MAR filter are shown in the left and middle column. The right column shows the absolute dose difference in percent of the prescribed dose (66 Gy). In (A) only at very small artifact reduction is seen and therefore only very small dose differences are observed. In (B–E) large artifact reductions are seen, which also translates in to large local dose differences, though still mainly below 1%. In (F), the dose difference is small compared to the large artifact reduction. The dose differences observed are mainly located very close to the metal artifacts or at the skin of the patient. In (G), the standard and O-MAR CT slices are the identical. However, there is a small difference in the two dose cubes caused by the metal artifacts in the surrounding CT slices.
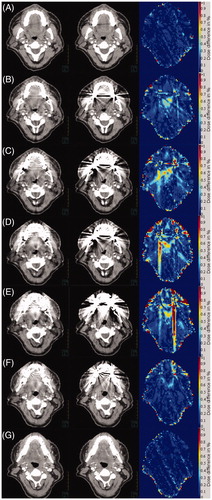
Figure 3. The histogram shows the dose changes in volume for all 30 patients sorted after volume with a dose difference of >1%. Patient 7 is the same patient as in . The dark gray and light gray bars show the patient volume with >1% and >3% dose difference, respectively.
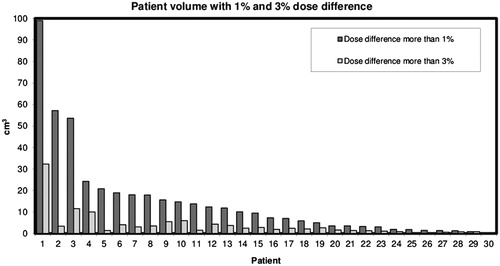
In , the dose differences for all patients are shown. In voxels near the skin, air cavities and metal implants, dose changes of up to 45 Gy were observed. For a few patients, the O-MAR algorithm produced large reductions in metal artifacts, yielding dose changes in relatively large volumes.
No statistical difference was observed between IMRT or VMAT plans (volume of dose difference ±1% and ±3%).
Discussion
The reduction of metal artifacts by MAR images in dose planning of H&N cancer produced significantly larger GTVs compared to standard CT images, with less impact on the outline of the parotid glands. A few patients demonstrated large differences in delineations as shown in , which may have serious clinical consequences.
Differences in delineation seem to arise in areas that lack signal due to artifacts in the standard CT reconstruction. In this study, the mean ASD improved considerably and was almost halved using the O-MAR image set. It has been described by Rasch et al. [Citation19] that image quality is one of the main factors contributing to the precision of target delineation. The bottom part of supports this point as the GTV-T appears to be cut-off in an area void of signal due to metal artifacts. O-MAR has been shown to reduce the inter-observer variability in single 5 mm CT slices when anatomical structures are in the artifact areas [Citation20].
The improvement in DSC of the GTV was not statistically significant in our study. This may be related to the Dice index which is less sensitive to differences in contours in specific directions. In this respect, the ASD is superior in detection of such differences since distances from one contour to the other is measured from all points of the surface contour, increasing the ASD in case of differences in specific directions.
Different MAR algorithms approach the lack of signal in the projection images in different way. Wuest et al. [Citation21] compared linear interpolation MAR and iterative MAR for carcinoma of the oral cavity and oropharynx and found that the iterative algorithm produced the best image quality. Huang et al. [Citation5] tested three different commercial MAR products and found only small improvements for the dental fillings in a head phantom, with the O-MAR algorithm being superior. Since the O-MAR algorithm has been optimized for orthopedic implants this is not surprising. Future improvement could potentially be achieved with focus on smaller metal implants and perhaps more iterations in the iterative optimization.
The observed differences in calculated dose between MAR and standard CT were patient dependent in this study. Artifacts located far from the high-dose regions hardly affected the dose while artifacts close to the high-dose region had significant impact on the local dose. Except for very local effects, in some cases a single voxel typically related to the metal implant, the observed dose differences for the whole cohort were small and without clinical significance in line with Li et al. [Citation8]. The accuracy and precision of the HU and dose using the O-MAR software was tested by Kwon et al. [Citation22] in H&N patients. They found that in a phantom, the HU of the O-MAR images were closer to the HU reference values of the same phantom without metal implants. Of interest, dose differences between O-MAR and standard CT images were dependent on either a closed or an open mouth with insignificant differences in patients with closed mouth. This is similar to the findings of the present study, where the majority of the patients had small and insignificant dose differences, but considerable dose differences in a few cases.
In conclusion, reduction of major metal artifacts with MAR reconstruction of CT scans of the H&N produced larger GTVs, but improved visualization and subsequent delineation of the GTV and parotid glands with reduced inter-observer variations compared to standard reconstruction. The differences in absorbed doses were small for the whole group, however, large variations were observed between patients which supports MAR in dose planning.
Disclosure statement
The authors report no conflicts of interest. The authors alone are responsible for the content and writing of this article.
References
- Chu JC, Ni B, Kriz R, et al. Applications of simulator computed tomography number for photon dose calculations during radiotherapy treatment planning. Radiother Oncol. 2000;55:65–73.
- Barrett JF, Keat N. Artifacts in CT: recognition and avoidance. Radiographics. 2004;24:1679–1691.
- Bedford JL, Childs PJ, Nordmark Hansen V, et al. Commissioning and quality assurance of the Pinnacle3 radiotherapy treatment planning system for external beam photons. BJR. 2003;76:163–176.
- Kim Y, Tomé WA, Bal M, et al. The impact of dental metal artifacts on head and neck IMRT dose distributions. Radiother Oncol. 2006;79:198–202.
- Huang JY, Kerns JR, Nute JL, et al. An evaluation of three commercially available metal artifact reduction methods for CT imaging. Phys Med Biol. 2015;60:1047–1067.
- Andersson KM, Nowik P, Persliden J, et al. Metal artefact reduction in CT imaging of hip prostheses—an evaluation of commercial techniques provided by four vendors. Br J Radiol. 2015;88:20140473.
- Philips Healthcare System. White Paper: Metal artifact reduction for orthopedic implants (O-MAR); 2012; Philips CT Clinical Science, Philips Healthcare, USA [Internet]. [cited 2017 Jan 13] Available from: http://clinical.netforum.healthcare.philips.com/us_en/Explore/White-Papers/CT/Metal-Artifact-Reduction-for-Orthopedic-Implants-(O-MAR).
- Li H, Noel C, Chen H, et al. Clinical evaluation of a commercial orthopedic metal artifact reduction tool for CT simulations in radiation therapy. Med Phys. 2012;39:7507–7517.
- Hilgers G, Nuver T, Minken A. The CT number accuracy of a novel commercial metal artifact reduction algorithm for large orthopedic implants. J App Clin Med Phys. 2014;15:4597.
- Glide-Hurst C, Chen D, Zhong H, et al. Changes realized from extended bit-depth and metal artifact reduction in CT. Med Phys. 2013;40:061711.
- Huang JY, Eklund D, Childress NL, et al. Investigation of various energy deposition kernel refinements for the convolution/superposition method. Med Phys. 2013;40:121721.
- Hansen CR, Johansen J, Kristensen CA, et al. Quality assurance of radiation therapy for head and neck cancer patients treated in DAHANCA 10 randomized trial. Acta Oncol. 2015;54:1669–1673.
- Hansen CR, Christiansen RL, Nielsen TB, et al. Comparison of three immobilisation systems for radiation therapy in head and neck cancer. Acta Oncol. 2014;53:423–427.
- Dijkema T, Raaijmakers CP, Ten Haken RK, et al. Parotid gland function after radiotherapy: the combined Michigan and Utrecht experience. Int J Radiat Oncol Biol Phys. 2010;78:449–453.
- Brouwer CL, Steenbakkers RJHM, Bourhis J, et al. CT-based delineation of organs at risk in the head and neck region: DAHANCA, EORTC, GORTEC, HKNPCSG, NCIC CTG, NCRI, NRG Oncology and TROG consensus guidelines. Radiother Oncol. 2015;117:83–90.
- Dice LR. Measures of the amount of ecologic association between species. Ecology. 1945;26:297–302.
- Sørensen T. A method of establishing groups of equal amplitude in plant sociology based on similarity of species and its application to analyses of the vegetation on Danish commons. Biol Skr 1948;5:1–34.
- Bertelsen A, Hansen CR, Johansen J, et al. Single arc volumetric modulated arc therapy of head and neck cancer. Radiother Oncol. 2010;95:142–148.
- Rasch C, Steenbakkers R, van Herk M. Target definition in prostate, head, and neck. Semin Radiat Oncol. 2005;15:136–145.
- Kohan AA, Rubbert C, Vercher-Conejero JL, et al. The impact of orthopedic metal artifact reduction software on interreader variability when delineating areas of interest in the head and neck. Pract Radiat Oncol. 2015;5:e309–e315.
- Wuest W, May MS, Brand M, et al. Improved image quality in head and neck CT using a 3D iterative approach to reduce metal artifact. AJNR Am J Neuroradiol. 2015;36:1988–1993.
- Kwon H, Kim KS, Chun YM, et al. Evaluation of a commercial orthopaedic metal artefact reduction tool in radiation therapy of patients with head and neck cancer. Br J Radiol. 2015;88:20140536.