
Abstract
Background: In order to determine the relative biological effectiveness (RBE) of protons with high accuracy, radiobiological experiments with detailed knowledge of the linear energy transfer (LET) are needed. Cell survival data from high LET protons are sparse and experiments with low energy protons to achieve high LET values are therefore required. The aim of this study was to quantify LET distributions from a low energy proton beam by using Monte Carlo (MC) simulations, and to further compare to a proton beam representing a typical minimum energy available at clinical facilities.
Materials and methods: A Markus ionization chamber and Gafchromic films were employed in dose measurements in the proton beam at Oslo Cyclotron Laboratory. Dose profiles were also calculated using the FLUKA MC code, with the MC beam parameters optimized based on comparisons with the measurements. LET spectra and dose-averaged LET (LETd) were then estimated in FLUKA, and compared with LET calculated from an 80 MeV proton beam.
Results: The initial proton energy was determined to be 15.5 MeV, with a Gaussian energy distribution of 0.2% full width at half maximum (FWHM) and a Gaussian lateral spread of 2 mm FWHM. The LETd increased with depth, from approximately 5 keV/μm in the entrance to approximately 40 keV/μm in the distal dose fall-off. The LETd values were considerably higher and the LET spectra were much narrower than the corresponding spectra from the 80 MeV beam.
Conclusions: MC simulations accurately modeled the dose distribution from the proton beam and could be used to estimate the LET at any position in the setup. The setup can be used to study the RBE for protons at high LETd, which is not achievable in clinical proton therapy facilities.
Introduction
The enhanced relative biological effectiveness (RBE) of protons compared to photons is currently accounted for in proton therapy planning by applying a constant RBE of 1.1, as recommended by ICRU [Citation1]. There is, however, a large amount of data demonstrating that RBE varies with parameters such as dose, tissue type, biological endpoint and radiation quality [Citation2]. The radiation quality can be quantified by the linear energy transfer (LET), which reflects the ionization density of the traversing particles. Not taking into account the variations in RBE along the proton beam may have important clinical consequences [Citation3], making precise RBE models highly relevant. Several RBE models are based on LET obtained from in vitro experiments in proton beams of different energies [Citation3]. Accurate estimates of LET distributions in cell irradiation setups are therefore of crucial importance for studies of RBE.
Although in vitro data from proton RBE are relatively abundant, the spread in estimated RBE from this data material is large [Citation2]. Previously published clonogenic assay data were reported and systematically analyzed in a comprehensive review in 2014 [Citation2]. While several of these used low energy protons, cell survival data from proton beams with high dose-averaged LET (LETd) values (above 20 keV/μm) are sparse [Citation2], due to challenges producing measurement data (e.g., cell survival) with high LETd values. These challenges include the requirement of high spatial resolution when conducting the experiments, needed because of the short range of low energy protons. Also, the studies given in this review with reported LETd values above 20 keV/μm have not calculated the LETd values in a consistent manner [Citation2]. The majority of the reviewed studies measured the energy and then estimated LETd values from generic stopping power tables, while only two of these studies (with reported LETd values above 20 keV/μm) [Citation4,Citation5] used Monte Carlo (MC) simulations to estimate the LETd. However, the MC simulations in these studies did not include the lateral LETd distribution of the irradiation setup, and only Doria et al. [Citation5] included (simplified) LET spectra. To reduce the uncertainty related to the proton RBE, especially for high LET values, high precision cell irradiation experiments should be coupled with benchmarked MC simulations of the setup to enable detailed spatial mapping of dose and LET.
In this study, we characterized and explored a novel low energy proton beam cell irradiation setup through dosimetry and dedicated MC simulations. Such low energy proton beams are ideal for radiobiological experiments, since low energy proton beams can produce high LETd values and narrow LET spectra. The objective of this study was to determine the initial beam parameters for MC simulations of the novel cell irradiation setup, and further use MC simulations to determine spatial variations in LET in positions intended for cell irradiation. We further compared LET values from our proton beam to LET values from an 80 MeV proton beam, representing a typical minimum energy, and thus maximum LETd, available at clinical facilities [Citation6].
Material and methods
Experimental setup
The MC-35 cyclotron (Scanditronix, Lund, Sweden) at the Oslo Cyclotron Laboratory (OCL) was operated at a cyclotron frequency to produce a nominal proton beam energy of 17 MeV. The irradiation setup is illustrated in Supplementary Figure A1; starting from the vacuum pipe, the proton beam proceeds into air after passing through a beam exit window of tungsten (Supplementary Table A1), designed to scatter the narrow proton beam with minimal energy loss. Due to the beam pipe vacuum, the tungsten plate was slightly curved towards the vacuum, resulting in an offset of 0.26 mm at the center of the plate. A transmission chamber (Supplementary Table A1) for monitoring of the beam intensity was placed 10 cm after the beam exit window. The transmission chamber and the instruments used for measurements were placed on a rail, to ensure a rigid setup.
Measurements and MC simulations were performed at three locations; 28 cm (A), 88 cm (B) and 128 cm (C) from the beam exit window. These positions were chosen to investigate the effects of the scatter plate and air on proton energy degradation and lateral spread, since this is useful information for selecting the optimal cell irradiation position. For depth dose measurements in the three positions, an Advanced Markus ionization chamber, calibrated in terms of dose to water (details in Supplementary Material A), was used. Gafchromic (EBT3) dosimetry films were used to measure the lateral dose profiles, positioned directly in front of the ionization chamber. The dimension of the film holder was 5 × 5 cm2. To alter the measurement depth, variations of absorber sheets of paraffin and Nylon6 and of Gafchromic dosimetry films (Supplementary Table A2) were placed in front of the ionization chamber for depth measurements (details in Supplementary Table A3). To calculate the water equivalent thickness of the absorber sheets, the mean stopping power relative to water for protons with energies 1–17 MeV was calculated from ICRU49 + 73, using the generic stopping power library libdEdx [Citation7]. The water equivalent thickness was calculated according to the equation for heavy charged particles, given in Zhang et al. [Citation8].
Determination of beam parameters
The geometry of the irradiation setup was implemented in the FLUKA MC code [Citation9–11]. For the MC simulations, the origin of the proton beam was set inside the vacuum pipe, 1 mm prior to the beam exit window. Comparisons between MC simulated dose and measurements were used to adjust the beam parameters in the simulations, including the beam energy, energy spread and the lateral shape of the beam.
The method of least squares was used to find the best fit for the proton beam energy and energy spread. Position B was used to determine the proton beam energy and energy spread, since this was the position with most experimental data. To find the lateral shape of the initial proton beam, the lateral dose profiles from the MC simulations were compared with the measurements at position A. This was done by comparing the full width at half maximum (FWHM) of the measured and MC simulated dose profiles. At this position the beam had an inhomogeneous lateral dose distribution and the measured dose profiles were nearly Gaussian.
Monte Carlo simulations of dose and LET
The absorber plates and ionization chamber materials were implemented as water with the appropriate dimensions, after calculating the water equivalent thickness as listed in Supplementary Table A2. The scoring region was defined with a radius of 2.5 cm divided into bins of size 0.4 mm and a depth of 3 mm divided into bins of size 5 μm, chosen to cover the area of a typical cell container in irradiation experiments. The MC simulations were run using standard FLUKA physics settings (PRECISIOn defaults, a delta-ray threshold of 10 keV and a logarithmic width of dp/dx momentum loss tabulated interval of 1.03, as recommended for particle therapy). Both dose and fluence were obtained in the scoring region (using the USRBIN option in FLUKA), while the LET spectra and energy spectra were scored at selected circular planes within the scoring regions (using the USRYIELD option in FLUKA).
The MC simulated doses were obtained as relative doses to enable scaling to match the measured dose. For the depth dose profile, the dose scored within a radius of 2.5 mm was considered to match the sensitive area in the Markus chamber, as well as to ensure a relatively homogeneous lateral dose in the scoring region. The lateral dose profiles were scored in water equivalent depths corresponding to the measurement setups: at 0.20 mm depth for positions A and C, and at 0.20 mm, 0.76 mm and 1.01 mm for position B.
The LET spectra and the LETd were calculated along the MC simulated proton beam in order to study the depth and lateral LET distributions at the measurement positions. The LET spectrum is the distribution of all relevant LET values at a specific position along the beam trajectory. The dose weighted LET spectrum, d( L), is defined so that:
(1)
where L is the LET [Citation12]. The LETd was calculated as:
(2)
where Φi (E) is the particle fluence for particle species i at kinetic energy E, and Li (E) is the unrestricted LET for this energy [Citation13]. Only LET values from primary and secondary protons were calculated.
The LET spectra were scored at different depths along the depth dose profile; at the entrance, at the Bragg peak, at the defined proton range and at the center of the distal dose fall-off. We defined the proton range (R80) as the depth of the distal 80% dose level, and the entrance was defined as 10% of this depth, i.e., 0.1 × R80. The Bragg peak is at the depth of maximum dose, and the center of distal dose fall-off was defined at the center of the distal margin of the Bragg peak given between the R80 and the depth of the distal 20% dose (d20), i.e., 0.5 × (R80+d20).
Comparison to an 80 MeV proton beam
Further, the LETd values and LET spectra from the proton beam were compared with the corresponding LETd values and LET spectra from an 80 MeV proton beam. This beam was selected to represent a typical minimum (initial) proton beam energy available at clinical proton therapy facilities, similar to what was used in Guan et al. [Citation14]. The 80 MeV beam was defined with an energy spread of 0.9% FWHM, and a homogeneous lateral distribution of 5 × 5 cm2. The beam passed through the same setup as the OCL proton beam, and entered a cylinder of water at 88 cm from the beam exit window, i.e., same position as measurement position B. The diameter of the water cylinder was 2.5 cm and depth in the beam direction was 5.5 cm. The dose and LETd were estimated in a region defined at the distal 2.5 cm of the water cylinder, in bins of size 10 μm in the beam direction, while the LET- and energy spectra were scored at three selected positions along the depth dose profile: before the Bragg peak (at the position where the LETd corresponds to the LETd at the entrance of measurement position B for the OCL proton beam), at the Bragg peak and at the center of distal dose fall-off.
Results
A proton beam energy of 15.5 MeV with a Gaussian energy distribution of 0.2% FWHM gave the best fit of measured and MC simulated depth doses at the three different measurement positions based on the least squares method (). The lateral spread of the beam was determined to be 2 mm FWHM (Gaussian), by comparing the FWHM of the measured dose profiles and MC simulated dose profiles at position A (). The best fit parameter configuration of the proton beam resulted in depth dose profiles within 5% of measured dose for the majority of the water equivalent depths considered (). Still, considerably higher deviations were seen in the distal dose fall-off after the Bragg peak.
Figure 1. Measured and MC simulated depth doses (upper panels), and percentage differences between measurements and MC simulations (lower panels) at the three measurement positions. The measurement data following the distal dose fall-off (below d20) were omitted from the lower panels of the figure due to the large relative uncertainties for doses close to zero.
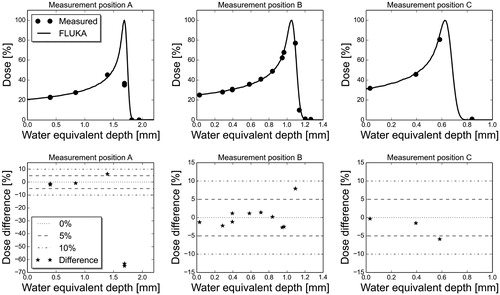
Figure 2. Measured and MC simulated lateral dose profiles, in horizontal (upper panel) and vertical direction (lower panel), as a function of distance from central axis (CAX), at the three measurement positions. The measurements were done at 0.20 mm water equivalent depth. 100% dose for both measurements and simulations represents the dose at CAX.
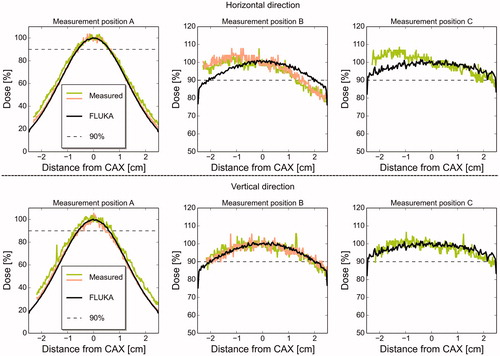
The MC simulated and measured lateral dose at position A was steeply reduced with distance from the central beam axis, while in comparison, the dose profiles were relatively flat at positions B and C (a selection is shown in , with all lateral dose profiles shown in Supplementary Figure B1). Measurements and MC simulations showed good agreement in position A, relative to the fluctuations observed in the experimental data. Fairly good agreement was also obtained at positions B and C in the vertical direction, while the measured dose profiles in the horizontal direction were slightly asymmetric. The dose at position B was above 90% within a lateral range of 4 cm. At position C, the dose profiles remained above 90% dose for the entire measured lateral range of 5 cm.
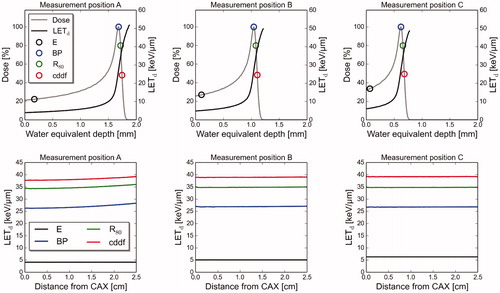
For all three measurement positions, the LETd values were in the range of 4–7 keV/μm at the entrance and increasing with depth, especially at the Bragg peak and beyond (). The LETd values for the three measurement positions were in the range 27–28 keV/μm at the Bragg peak, 34–35 keV/μm at the proton beam range (R80) and 38–39 keV/μm at the center of distal dose fall-off. Values up to approximately 50 keV/μm were observed at the end of the distal dose fall-off. Only minor variations were observed in the lateral direction at each position ().
Figure 3. Dose and LETd values as a function of water equivalent depth (upper panels) and distance from central axis (lower panels), at the three measurement positions. The LETd values as a function of distance from CAX are reported for the entrance (E), the Bragg peak (BP), proton beam range (R80) and at the center of distal dose fall-off (cddf). These positions are illustrated on the depth dose curves.
The LET- and energy spectra at four different depths (entrance, Bragg peak, R80 and center of distal dose fall-off) showed no visible variation between the different measurement positions, except at the entrance, where the spectra were narrower approaching the beam exit window (spectra at position B are shown in , while spectra at all three positions are shown in Supplementary Figure B2). When comparing MC simulated LET spectra from OCL (15.5 MeV) to MC simulated LET spectra from the 80 MeV proton beam, for the same LETd values, the spectra from the OCL were considerably narrower than the spectra from the 80 MeV beam ().
Figure 4. Energy spectra (left) and dose weighted LET spectra (right) at four positions on the depth dose profile at measurement position B; the entrance (E), the Bragg peak (BP), the proton beam range (R80) and the center of the distal dose fall-off (cddf). The LET spectrum at the entrance was scaled to make all the spectra visible within the same vertical axis. The mean energies of the spectra, as well as the scaling of the entrance LET spectra, are given in parenthesis in the legends.
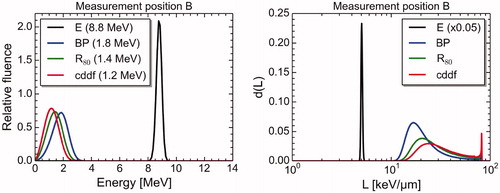
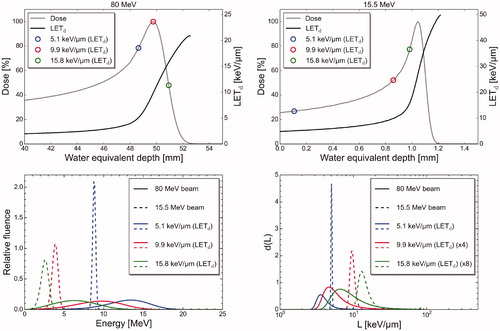
Figure 5. Dose and LETd values as a function of water equivalent depth for the 80 MeV and 15.5 MeV proton beams, with circles marking location of three specific LETd values at the depth dose profiles (upper panels). Energy spectra (lower panels, left) and dose weighted LET spectra (lower panels, right) corresponding to the three marked LETd values, for both the 80 MeV and 15.5 MeV proton beam. Scaling of some of the LET spectra is shown in parenthesis in the legend.
Discussion
In this study, we implemented the geometry of a dedicated cell irradiation setup for protons using the FLUKA MC code and determined the initial beam parameters for the MC simulations through comparison with dosimetric data. Further, we explored the spatial variations in LETd and LET spectra at the cell irradiation positions. The resulting LETd values were higher, and the LET spectra narrower, than what was achievable with the 80 MeV proton beam. The study shows the potential for performing cell irradiation for exploring the RBE–LET relationship for protons, and presents the feasibility of our setup to produce proton beams of radiation quality not available at typical proton therapy facilities.
The implementation of the OCL beamline in FLUKA was validated by comparing MC simulated dose distributions with measurements. The MC simulated depth dose profiles were mostly within 5% of the measured dose in the build-up region and in the Bragg peak, whereas in position A, significantly larger differences were found at the distal end beyond the Bragg peak where the dose curve is very sharp and small uncertainties in depth give large uncertainties in dose. These results therefore illustrate the importance of high precision in all aspects of cell irradiation experiments, in particular when using the distal dose fall-off region of the beam.
A homogeneous lateral dose profile, as well as a homogeneous lateral LETd distribution, is beneficial in cell experiments since the dose and LETd values will stay constant throughout the cell dish at a given depth. The relatively flat lateral dose profiles observed for both positions B and C indicate that these positions may be used for cell irradiation experiments. The asymmetry in the measured dose profiles, especially in the horizontal direction, was not seen in the MC simulated dose profiles. This asymmetry may be due to a bending of the Gafchromic EBT3 films, as discussed by Lewis and Devic [Citation15], which could lead to errors and asymmetry in the dose measurements. Considering the observed steep lateral dose gradients, position A is not suitable for cell irradiation.
The LETd values approached 30 keV/μm in the Bragg peak and further increased to (on average) 40 keV/μm in the distal dose fall-off. Although these high LETd values are not present during treatment with protons, they still provide important insight into the RBE–LET relationship for protons, and can lead to improved RBE models for proton therapy [Citation2,Citation16].
The LETd distribution did not vary significantly between the three measurement positions, as shown in , where all the LETd distributions had the same shape. The lateral LETd distributions were virtually constant for the entire measurement region, also at positions where the lateral dose distributions were inhomogeneous. This is in accordance with a previous study from Chen and Ahmad [Citation17], where MC simulations were used to find the LETd values from a 250 MeV proton beam. The LET spectra at the four defined positions along the depth dose curve were similar at all measurement positions, except at the entrances, where a considerably sharper spectrum was found at position A, compared to at the other positions. LET is a function of particle energy, and this could be seen in the spectra; the spread of both the LET and energy spectra increased with depth, until the distal dose fall-off where the proton fluence decreased rapidly. A peak at about 83 keV/μm was observed in the LET spectra found at the distal dose fall-off. This LET value corresponds to protons with energy 0.08 MeV, and it is the largest obtainable LET value for protons [Citation18].
In addition to the steep change in dose beyond the Bragg peak, we also found a relatively steep increase in the LETd. The LETd values in our experiment increased from approximately 27 keV/μm to 34 keV/μm between the Bragg peak and the proton beam range (R80), a difference in depth of only 40 μm. This demonstrates that high spatial and dosimetric precision is essential for correct assessment of the LETd during cell irradiations. Since there can be a considerable variation in the LETd value at micrometer scale for low energy protons, the LETd may also change significantly through a single cell, herein the cell nucleus which is the primary target for cell inactivation [Citation19,Citation20]. Some previous studies with high LETd values have accounted for the cell thickness [Citation5,Citation16,Citation20–26], while others have neglected this effect. Bettega et al. [Citation20] irradiated C3H10T1/2 cells (cell thickness 3.4 μm) with a low energy proton beam, and found an increase in LETd through a cell of less than 10% up to 35 keV/μm, while more than 10% increase was found for higher LETd values. If considering a cell thickness of 3.4 μm in our setup, this would for our three measurement positions correspond to an increase in LETd below 0.4% in the entrance region and an increase of 1–3% at the Bragg peak and distal dose fall-off. For a cell thickness of 10 μm (V79 cells) [Citation27], the relative increase in LETd would be considerably higher: up to 0.9% at the entrance and 3–8% at the Bragg peak and distal dose fall-off. These variations for different cells and proton beam ranges demonstrate the importance of combining MC simulations with cell experiments to precisely determine the LET over the entire proton beam range.
The MC simulations of the 80 MeV beam, representing typical minimum energy at clinical facilities, resulted in LETd values below 21 keV/μm for all regions. In comparison, the OCL beam can provide LETd values up to approximately 50 keV/μm. We observed significant differences in the energy and LET spectra for the same LETd values for the OCL beam and the 80 MeV proton beam. The different energy and LET spectra could in principle result in different biological effects, even though they result in the same LETd value. This has been shown for several different cell lines [Citation4]. If the RBE increases linearly with LET over the full LET range, the biological effect is unique for a single LETd value, independent of the shape of the LET spectrum [Citation28]. If this is not the case, then RBE models based on data from narrow LET spectra, i.e., close to mono-energetic beams, may provide better estimates of RBE compared to models based on irradiation data from broad energy beams. Proton beams with narrow LET spectra will mainly consist of particles with a LET value equal or close to the LETd of the beam. The measured response in RBE would then correspond to particles with this specific LET value, without the noise from other LET values. Detailed MC simulations as performed in our study also enable further exploration of RBE from different LET spectra resulting in the same LETd, as the depth for achieving the desired LETd for comparison with other cell irradiation experiments can be predicted accurately.
Two previous cell experiments with reported LETd values above 20 MeV have been combined with MC simulations [Citation4,Citation5], although the main focus of these studies was the cell irradiation and not the MC simulations. In addition, the proton beams in these studies were different than our beam. Chaudhary et al. estimated LETd profiles as a function of depth while irradiating cells with a 62 MeV proton beam [Citation4]. The LETd depth distribution had a similar shape as in our study, but with considerably lower maximum LETd values. While the maximum LETd in our results approached 50 keV/μm in the distal dose fall-off, the maximum LETd from the 62 MeV beam was approximately 25 keV/μm. Doria et al. irradiated cells using a laser driven ion source, emitting high intensity ion beams with relatively large energy spread [Citation5]. In their study, the LETd values were only estimated at each measurement position, with the highest resulting LETd value of 28 keV/μm.
The LETd in previously published in vitro experiments has not been calculated and reported consistently [Citation2]. The LET cannot be directly measured and is usually estimated from calculations of the stopping power based on the Bethe–Bloch equation, either by using already generated reference tables or using MC simulations where these calculations are done directly [Citation13,Citation14]. In some previous studies, LETd has been calculated by averaging the LET spectra [Citation14,Citation24], or by finding the LETd value corresponding to the average energy of the particles impinging the cells [Citation2]. As reference tables tend to differ slightly, the reported LETd values are also found to vary with the same energy [Citation7]. In order to enable better comparisons between data from different cell experiments, LETd values should be estimated consistently, preferably using MC simulations of the irradiation setup.
In conclusion, MC simulations accurately modeled the dose distribution around the Bragg peak, and were further used to estimate the LETd and LET spectrum of the proton beam. The MC simulations indicate that the setup can be used to study the RBE of protons, also for high LETd values, above what is achievable using proton beams at clinical facilities.
IONC_1289239_Supplementary_material.pdf
Download PDF (520.2 KB)Disclosure statement
The authors report no conflicts of interest. The authors alone are responsible for the content and writing of this article.
References
- International Commission on Radiation Units and Measurements. Prescribing, recording, and reporting proton-beam therapy (ICRU Report 78). J ICRU. 2007;7.
- Paganetti H. Relative biological effectiveness (RBE) values for proton beam therapy. Variations as a function of biological endpoint, dose, and linear energy transfer. Phys Med Biol. 2014;59:R419–R472.
- Giovannini G, Böhlen T, Cabal G, et al. Variable RBE in proton therapy: comparison of different model predictions and their influence on clinical-like scenarios. Radiat Oncol. 2016;11:68.
- Chaudhary P, Marshall TI, Perozziello FM, et al. Relative biological effectiveness variation along monoenergetic and modulated Bragg peaks of a 62-MeV therapeutic proton beam: a preclinical assessment. Int J Radiat Oncol Biol Phys. 2014;90:27–35.
- Doria D, Kakolee KF, Kar S, et al. Biological effectiveness on live cells of laser driven protons at dose rates exceeding 109 Gy/s. AIP Adv. 2012;2:011209.
- American Association of Physicists in Medicine. Chapter 15, quality assurance, Part 1: machine quality assurance. In: Das IJ, Paganetti H, editors. Principles and practice of proton beam therapy. Wisconsin, USA: Medical Physical Publishing, Inc.; 2015. p. 431.
- Lühr A, Toftegaard J, Kantemiris I, et al. Stopping power for particle therapy: the generic library libdEdx and clinically relevant stopping-power ratios for light ions. Int J Radiat Biol. 2012;88:209–212.
- Zhang R, Taddei PJ, Fitzek MM, et al. Water equivalent thickness values of materials used in beams of protons, helium, carbon and iron ions. Phys Med Biol. 2010;55:2481–2493.
- Battistoni G, Bauer J, Boehlen TT, et al. The FLUKA code: an accurate simulation tool for particle therapy. Front Oncol. 2016;6:Article number 116.
- Böhlen TT, Cerutti F, Chin MPW, et al. The FLUKA code: developments and challenges for high energy and medical applications. Nucl Data Sheets. 2014;120:211–214.
- Ferrari A, Sala R, Fasso A, et al. FLUKA: a multi-particle transport code. INFN/TC. 2005;5:31–49.
- International Commission on Radiation Units and Measurements. Linear energy transfer (ICRU Report 16); 1970.
- Bauer J, Sommerer F, Mairani A, et al. Integration and evaluation of automated Monte Carlo simulations in the clinical practice of scanned proton and carbon ion beam therapy. Phys Med Biol. 2014;59:4635–4659.
- Guan F, Peeler C, Bronk L, et al. Analysis of the track- and dose-averaged LET and LET spectra in proton therapy using the GEANT4 Monte Carlo code. Med Phys. 2015;42:6234.
- Lewis D, Devic S. Correcting scan-to-scan response variability for a radiochromic film-based reference dosimetry system. Med Phys. 2015;42:5692.
- Belli M, Bettega D, Calzolari P, et al. Inactivation of human normal and tumour cells irradiated with low energy protons. Int J Radiat Biol. 2000;76:831–839.
- Chen Y, Ahmad S. Empirical model estimation of relative biological effectiveness for proton beam therapy. Radiat Prot Dosimetry. 2011;149:116–123.
- Wilkens JJ, Oelfke U. A phenomenological model for the relative biological effectiveness in therapeutic proton beams. Phys Med Biol. 2004;49:2811–2825.
- Hall EJ, Giaccia AJ. Chapter 2. DNA strand breaks and chromosomal aberrations. In: Lisa McAllister (Acquisitions Editor), Kerry Barrett (Managing Editor). Radiobiology for the radiologists. Philadelphia, PA: Lippincott Williams & Wilkins; 2006. p. 16.
- Bettega D, Calzolari P, Marchesini R, et al. Inactivation of C3H10T1/2 cells by low energy protons and deuterons. Int J Radiat Biol. 1998;73:303–309.
- Belli M, Cera F, Cherubini R, et al. RBE–LET relationship for survival and mutation induction of V79 cells irradiated with low-energy protons: re-evaluation of the LET values at the LNL facility. Int J Radiat Biol. 1992;61:145–146.
- Belli M, Cera F, Cherubini R, et al. Inactivation and mutation induction in V79 cells by low energy protons: re-evaluation of the results at the LNL facility. Int J Radiat Biol. 1993;63:331–337.
- Belli M, Cherubini R, Finotto S, et al. RBE–LET relationship for the survival of V79 cells irradiated with low energy protons. Int J Radiat Biol. 1989;55:93–104.
- Folkard M, Prise KM, Vojnovic B, et al. The irradiation of V79 mammalian cells by protons with energies below 2 MeV. Part I: Experimental arrangement and measurements of cell survival. Int J Radiat Biol. 1989;56:221–237.
- Goodhead DT, Belli M, Mill AJ, et al. Direct comparison between protons and alpha-particles of the same LET: I. Irradiation methods and inactivation of asynchronous V79, HeLa and C3H 10T1/2 cells. Int J Radiat Biol. 1992;61:611–624.
- Wéra AC, Riquier H, Heuskin AC, et al. In vitro irradiation station for broad beam radiobiological experiments. Nucl Instrum Methods Phys Res B. 2011;269:3120–3124.
- Folkard M, Prise KM, Vojnovic B, et al. Inactivation of V79 cells by low-energy protons, deuterons and helium-3 ions. Int J Radiat Biol. 1996;69:729–738.
- Guan F, Bronk L, Titt U, et al. Spatial mapping of the biologic effectiveness of scanned particle beams: towards biologically optimized particle therapy. Sci Rep. 2015;5:9850.