
Abstract
Background: Hypoxia imaged by positron emission tomography (PET) is a potential target for optimization in radiotherapy. However, the implementation of this approach with respect to the conversion of intensities in the images into oxygenation and radiosensitivity maps is not straightforward. This study investigated the feasibility of applying two conversion approaches previously derived for 18F-labeled fluoromisonidazole (18F-FMISO)-PET images for the hypoxia tracer 18F-flortanidazole (18F-HX4).
Material and methods: Ten non-small-cell lung cancer patients imaged with 18F-HX4 before the start of radiotherapy were considered in this study. PET image uptake was normalized to a well-oxygenated reference region and subsequently linear and non-linear conversions were used to determine tissue oxygenations maps. These were subsequently used to delineate hypoxic volumes based partial oxygen pressure (pO2) thresholds. The results were compared to hypoxic volumes segmented using a tissue-to-background ratio of 1.4 for 18F-HX4 uptake.
Results: While the linear conversion function was not found to result in realistic oxygenation maps, the non-linear function resulted in reasonably sized sub-volumes in good agreement with uptake-based segmented volumes for a limited range of pO2 thresholds. However, the pO2 values corresponding to this range were significantly higher than what is normally considered as hypoxia. The similarity in size, shape, and relative location between uptake-based sub-volumes and volumes based on the conversion to pO2 suggests that the relationship between uptake and pO2 is similar for 18F-FMISO and 18F-HX4, but that the model parameters need to be adjusted for the latter.
Conclusions: A non-linear conversion function between uptake and oxygen partial pressure for 18F-FMISO-PET could be applied to 18F-HX4 images to delineate hypoxic sub-volumes of similar size, shape, and relative location as based directly on the uptake. In order to apply the model for e.g., dose-painting, new parameters need to be derived for the accurate calculation of dose-modifying factors for this tracer.
Introduction
Since the discovery of the oxygen effect and the recognition of its importance in radiotherapy, various strategies to overcome the increased radioresistance caused by hypoxia have been investigated. Following the first use of hyperbaric oxygen chambers, one of the early explored alternatives was to selectively sensitize the hypoxic cells by administering an oxygen-mimetic chemical compound that would accumulate specifically in cells lacking oxygen [Citation1]. In 1979, Chapman suggested that the hypoxia-sensitizing agents could instead be used for imaging purposes by chemically labeling them with radioactive nuclei [Citation2], and in 1981, Chapman et al. [Citation3] demonstrated for the first time how tumor hypoxia could be assessed on histological level using radiolabeled misonidazole and autoradiography. Today, several radiolabeled derivatives of nitroimidazole and other hypoxia-specific agents are used in combination with functional imaging such as positron emission tomography (PET).
To date, the most commonly used tracer for hypoxia is 18F-labeled fluoromisonidazole, 18F-FMISO [Citation4]. One of the tumor types in which 18F-FMISO has been frequently used to assess the oxygenation status before and during radiotherapy is non-small-cell lung cancer (NSCLC) [Citation5–7]. The high prevalence and large range of hypoxia observed in these tumors warrants pretreatment stratification and potential treatment adaptation in NSCLC patients. Dose-painting, in which sub-volumes associated with an increased radioresistance are given a larger dose compared with the rest of the target, is one potential strategy to counteract the increased radioresistance associated with tumor hypoxia [Citation8]. This can in principle be done either by escalating the dose to a volume delineated based on an uptake threshold relative to a well-oxygenated reference region [Citation9] or, by first converting the uptake values into partial oxygen pressure (pO2) [Citation10,Citation11]. The latter approach will allow the calculation of the dose-boost required, as opposed to simply escalating the dose within the limits of the normal tissue toxicity constraints.
While 18F-FMISO has repeatedly proven robust in identifying and quantifying hypoxia, its slow clearance kinetics result in a low image contrast [Citation12], and other tracers with lower lipophilicity have therefore been explored. One such example is 18F-flortanidazole (18F-HX4), another nitroimidazole, but with higher water solubility and more rapid clearance [Citation13].
It was the purpose of this study to investigate whether a model previously derived for converting 18F-FMISO-PET standardized uptake values into oxygen partial pressure [Citation10,Citation11] could be applied to the patients imaged with 18F-HX4 in order to identify hypoxic target volumes for dose-painting. Specifically, the study aimed at exploring the influence of the choice of the mathematical expression for converting the relative tracer uptake into partial oxygen pressure as well as the choice of the reference region on the size, shape, and location of the resulting hypoxic target volume (HTV).
Material and methods
Patient data
18F-HX4 PET-CT imaging data of 10 non-small cell lung cancer (NSCLC) patients were included in the study. These images were acquired for a previous study, and details on the imaging protocol and image acquisition parameters can be found in the original publications describing that study [Citation14,Citation15]. In brief, images were acquired 4 h after injection, in line with what has been identified as optimal for maximal contrast and tumor-to-background ratio in 18F-HX4-PET [Citation13]. All imaging was performed before the commencement of external beam radiotherapy.
Reference regions
For the purpose of identifying hypoxic sub-volumes in the tumor based on the relative intensity in the PET images, a reference region containing well-oxygenated tissue is required. In order to investigate the impact of the choice of reference region on the hypoxic sub-volumes subsequently defined, two different regions with respect to the tracer uptake and kinetics were considered in this study: the aortic arch and a volume of muscle tissue. While both regions can be considered to be well-oxygenated, the tissues they contain are physiologically different in the sense that the tracer has been metabolized in the muscle, but not in the blood. The aortic arch was delineated by an experienced radiation oncologist and the muscle reference region was delineated as a cylinder with a 1.2 cm radius (three times the pixel size) in five consecutive slices in muscle tissue on the opposite side of the tumor. In one of the patients, the aortic arch was outside of the PET uptake area, and, therefore, this patient could not be included in the further analysis.
Using these two reference regions, hypoxic target volumes (HTV) were determined in each of the nine patients eligible for analysis by two different methods: one based directly on the tracer uptake and one based on the conversion of the tracer uptake into oxygen partial pressure, where uptake herein refers to standardized uptake value (SUV).
Hypoxic sub-volumes based on tracer uptake
The average uptake in each reference region was multiplied by 1.4, and all pixels with this intensity or higher were included in an uptake-based HTV, HTVuptake. The choice of 1.4 as the threshold was made in line with previously used uptake thresholds based on both tumor-to-muscle [Citation16] and tumor-to-blood [Citation17] ratios in HX4-imaging of NSCLC. As there was a high signal in the heart, and especially high uptake in the liver in many patients, the volumes potentially identified as hypoxic by the thresholding method based on the 1.4 value would not necessarily be confined to the gross tumor volume (GTV). Therefore, a sphere large enough to encompass the primary CTV was delineated in all patients and only high-uptake volumes in this CTV-encompassing sphere were considered for further analysis since assessing the relative overlap of hypoxic volumes defined using different strategies should be independent on the anatomical regions considered, so long as the delineated volumes are evaluated within the same region for each patient.
To compare the uptake-based HTVs for the two reference regions, the DICE similarity coefficient was calculated [Citation15].
Hypoxic sub-volumes based on a conversion of tracer uptake into pO2
In 2012, Toma-Dasu et al. [Citation11] presented a model for the conversion of 18F-FMISO uptake into oxygen partial pressure in mmHg. In this model, either a linear or a sigmoidal conversion function can be used. The conversion functions are illustrated in Supplementary Figure 1. The equation used for the sigmoidal conversion is typical for inhibitions of chemical reactions:
(1)
with the first term (parameter A) related to the reaction speed in the absence of the inhibitor and the second term (with parameters B and C) describing the inhibition effect. The numerical values for parameters A, B, and C derived for 18F-FMISO are A = 10.9, B = 10.7, and C = 2.5. As long as two compounds are chemically similar and affected by similar reactions, inhibition for example, the equation should be the same although the parameters might be somewhat different. Thus, while maximum SUV values and tumor-to-background ratios can be expected to differ between 18F-FMISO and 18F-HX4 [Citation18], the general uptake distributions of these tracers have been found to be similar both in a pre-clinical study [Citation19] and a recent modeling study [Citation20]. In the present study, an analogous assumption was made such that the relative dependence of the 18F-HX4 uptake on pO2 is similar to that for 18F-FMISO. Hence, the equation derived for 18F-FMISO was applied to the 18F-HX4-PET images, and a range of pO2 thresholds for hypoxia not limited to the conventional levels (e.g. 5–10 mmHg) were considered, given that the individual parameters are likely in need to be adjusted to accurately calculate pO2 for the new tracer. In fact, this would correspond to the first step in deriving the new parameters for 18F-HX4 should the model be able to identify the same pattern of hypoxia.
Since a linear relationship for converting tracer uptake into pO2 was included in the study on 18F-FMISO, a linear function was also considered for 18F-HX4 in the present study. The expression used for conversion is
(2)
with the first term describing the reaction in the absence of the inhibitor being the same as in the case of the sigmoid function, and the second term assuming a linear effect of the inhibition process being determined accordingly. This ensures that the linear and the sigmoid equation will result in the same value of the uptake in the reference region. The numerical values for parameters A and B derived for 18F-FMISO are A = 10.9 and B = 0.171.
In each patient, the three-dimensional 18F-HX4-PET imaging data were converted from normalized uptake to pO2 so that a voxelized three-dimensional oxygen partial pressure map was obtained with the same size and resolution as the original PET image. The conversion was performed using the linear and the sigmoidal conversion functions and considering both the aortic arch and the muscle region as the well-oxygenated reference. Using a large range of pO2 threshold values for the segmentation, new HTVs (HTVpO2) were delineated within the same CTV-encompassing sphere as for the uptake-based HTVs. The HTVuptake and the HTVpO2 were then compared with each other.
The thresholding and segmentation was performed for all cases in a research version of RayStation v4.6.100.4 (RaySearch Laboratories, Stockholm, Sweden) in which the two conversion functions were implemented in an ad-on module.
Results
For the patient cohort considered in this study, the range of maximum uptake values normalized to the average uptake in the reference region was 2.3–5.3 for the aortic arch and 2.4–4.8 for the muscle region. Consequently, the linear conversion of the uptake to pO2 resulted in rather high oxygen tensions in a limited range between on average 50 mmHg and 63 mmHg for the muscle, and 49–63 mmHg for the aortic arch as could be expected by looking at the linear relationship in Supplementary Figure 1. Using the sigmoidal conversion function, however, resulted in a large range of pO2 values and allowed the identification of reasonably sized sub-volumes in all patients. This approach will be hereon exclusively discussed.
Reference regions
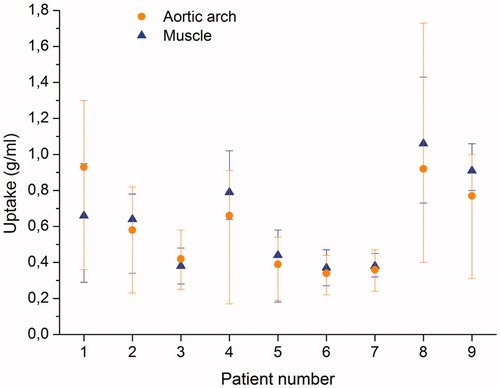
In seven of the nine patients (78%), the average uptake in the muscle region was higher than in the aortic arch, while in two patients, the average uptake was higher in the aortic arch (). The average tracer uptake showed larger variability for the muscle region than for the aortic arch (Supplementary Figure 2).
Figure 1. The average uptake (symbols) and the range of uptake values (bars) from the minimum to the maximum as a function of patient number for the aortic arch (circles) and the muscle (triangles).
Hypoxic sub-volumes based on tracer uptake
In the nine cases considered, the primary GTV ranged in size from 32 cm3 to 853 cm3 with an average volume of 198 cm3. The hypoxic target volumes (HTVuptake) based on an uptake ratio of 1.4 to the average uptake in the respective reference region ranged in size between 5 cm3 and 83 cm3 using the aortic arch as reference, and between 2 cm3 and 344 cm3 with the muscle region as reference. Supplementary Figure 3 shows the HTVuptake based on the aortic arch plotted against the HTVuptake based on the muscle region. The Spearman correlation coefficient for the two volumes was 0.73, which does not exclude the existence of a correlation although further investigation potentially including additional reference regions might be needed.
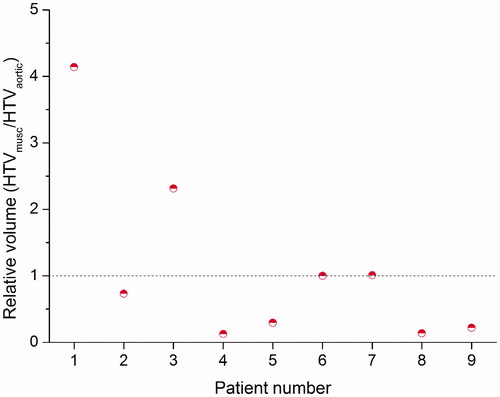
shows the relative volume of the HTVuptake based on the muscle to the HTVuptake based on the aortic arch for each individual patient. As expected from the higher average uptake in the muscle region, the HTVuptake based on the muscle region was smaller than that based on the aortic arch in the majority of the patients (five out of nine). For two patients, the HTVuptake was the same for both reference regions, and in two patients, the HTVuptake based on the muscle was larger. The DICE similarity coefficient ranged between 0.23 and 1.00, with a median value of 0.46 and an average value of 0.57 ± 0.29.
Figure 2. The relative volume of the muscle-based HTV to the HTV based on the aortic arch as a function of patient number.
Hypoxic sub-volumes based on a conversion of tracer uptake into pO2
Based on the conversion of uptake values in g/ml into oxygen partial pressure in mmHg, sub-target volumes (HTVpO2) were delineated by segmentation of the three-dimensional pO2 maps. Given that the extent of the applicability of the parameters derived for 18F-FMISO on the 18F-HX4 images used in this study was unknown, a large range of pO2 thresholds, including values substantially larger than what is conventionally considered as hypoxia, were considered. Interestingly, for both the reference regions, HTVpO2:s of the same or similar size as the uptake-based HTVs (HTVuptake) could be determined within a range of thresholds of only 10 mmHg. In fact, within this 10 mmHg range, HTVpO2:s encompassing the HTVuptake volume with respect to both size and location were found. shows the fraction of the uptake-based- and the pO2-based HTVs that overlap relative to the union of the same volumes. In , Threshold 1 corresponds to 30 mmHg, Threshold 2 corresponds to 35 mmHg, and Threshold 3 corresponds to 40 mmHg. With the muscle as reference region, the 10 mmHg range is reduced to only 5 mmHg, as the highest ratios are obtained either for Threshold 2 or 3. The model derived for 18F-FMISO is thus able to identify hypoxic areas that are of very similar size, shape and location as those based on the SUV, illustrated in for one representative case. In one of the patients, the HTVpO2 completely overlapped with the HTVuptake.
Figure 3. The HTVuptake based on either the aortic arch (orange) or muscle (green) as reference region in three representative slices, and the corresponding HTVpO2 with the highest overlap fractions in red for the aortic arch as reference, and in blue with the muscle as a reference. The figure appears in color in the online version of the article.
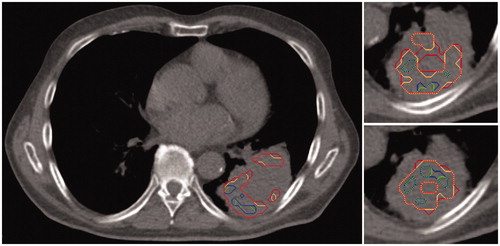
Table 1. The relative overlap of HTVs delineated based on uptake values and oxygen partial pressure for a threshold range of 10 mmHg. Numbers in bold refer to the maximum relative overlap found for each reference region in each patient.
Discussion
As expected, the conversion parameters derived for 18F-FMISO could not be directly applied to obtain reasonable levels of hypoxia in terms of absolute oxygen partial pressure. However, within a limited range of thresholds of only 10 mmHg (between Threshold 3 of 40 mmHg and Threshold 1 of 30 mmHg) the resulting HTVpO2:s showed a high relative overlap with the uptake-based HTVs. This finding indicates that the mathematical expression used for converting uptake to pO2 stated in EquationEquation (1)(1) could be used for the tracer 18F-HX4 as well, but that the parameters A, B, and C need to be modified so that the shape of the conversion curve illustrated in Supplementary Figure 1 is preserved.
The success of hypoxia-based dose painting demands not only to be able to identify and quantify hypoxia but also to reliably calculate the required dose escalation to overcome the increased radioresistance. One of the many caveats in achieving this task is represented by the need to convert the relative information from the functional imaging into absolute numbers for the purpose of the most optimal dose-escalation. In fact, the mere identification of tumor hypoxia based on functional imaging is highly dependent on the tracer kinetics and the time of imaging after injection [Citation13]. This should ideally be the time at which maximal contrast is achieved between tissues in which the tracer is retained, and tissues in which the tracer retention is inhibited. Depending on how much time has passed between the injection of the tracer and the image acquisition, the relationship between the relative uptake in different tissues can vary significantly [Citation15,Citation21]. Regardless of whether a threshold based on relative uptake or oxygen partial pressure resulting from a conversion of uptake into oxygen is applied, the extent and degree of any hypoxia hence identified will be exclusively determined by the contrast in the image. Therefore, the most suitable threshold to distinguish hypoxic tissue from normoxic tissue can be different depending on how much time that has passed between the injection and the image acquisition.
In an experimental rat tumor model, 4 h after the injection of 18F-HX4 was identified as the optimal time point to perform the imaging with respect to the mean tumor-to-blood ratio [Citation13]. In another pre-clinical study, the optimal time point for 18F-HX4 imaging with respect to the tumor-to-blood ratio was 3 hours post-injection (p.i.) [Citation18]. These findings have been clinically confirmed in a number of tumor sites including non-small-cell lung cancer [Citation15], head-and-neck squamos cell carcinoma [Citation16], and esophageal and pancreatic cancer [Citation22].
The image contrast is intimately related to the best choice of uptake threshold for the purpose of segmentation. One of the most commonly used tumor-to-background uptake thresholds in 18F-HX4-PET imaging is 1.4 [Citation15–17,Citation23], which has been based on the standard threshold for 18F-FMISO [Citation5,Citation6]. Due to the differences between 18F-FMISO and 18F-HX4 in primarily the clearance kinetics [Citation16,Citation18], the most appropriate threshold might however be different for the latter.
Several studies have investigated the use of alternative thresholds for 18F-HX4. While a threshold of 1.2 for images taken 2 h p.i. resulted in similar amount of hypoxic lesions detected as for a threshold of 1.4 in images taken 4 h p.i., on one hand, the lower threshold was found to increase the risk of false-positive lesions [Citation15]. On the other hand, a higher threshold could imply the identification of false negative lesions. Indeed, the use of 1.4 as a threshold instead of 1.2 reduced the number of tumors considered to be hypoxic from 15/19 to 9/19 in 19 lung- and head and neck cancer patients [Citation24]. However, no additional measurements of hypoxia were performed and the actual number of hypoxic lesions is therefore not known. Furthermore, the time between injection and image acquisition in this patient group was 99 ± 10 min, quite far below the 4 h-p.i. time which has been identified as optimal for 18F-HX4 [13,15,18]. A larger range of thresholds between 1.1 and 1.6 for 18F-HX4 imaging in NSCLC have also been considered [Citation15,Citation17]. In comparison to the high FDG uptake areas based on an SUV larger than 40%, 50%, or 60% of the maximum SUV, the use of an 18F-HX4 tumor-to-blood ratio defined as (SUVmax)tumor/(SUVmean)aorta of 1.3, 1.4, or 1.5 resulted in similar percentage of the GTV only included in the high-HX4 uptake area [Citation17]. However, since the actual hypoxic volumes were unknown in both the 2013 and the 2014 studies, it is difficult to conclude if one of the thresholds is superior to the others.
In the present study, 18F-HX4-PET imaging data acquired 4 h p.i. were used and segmentation of hypoxic sub-volumes in the nine patients analyzed was based on a threshold of 1.4. Due to the comparative nature of the study, the lack of clear consensus in the scientific literature on which is the most appropriate threshold for 18F-HX4 has limited impact on the results of this study. The focus of the work is on the comparison of uptake-based segmentation and segmentation based on the conversion of uptake to pO2. Thus, even if the 1.4 threshold should prove to be sub-optimal, the main finding in this study is that the segmentation method based on pO2 could identify hypoxic sub-volumes similar to the uptake-based volumes with respect to the size, shape, and location. The choice of uptake threshold could, however, be of greater significance for the purpose of deriving new parameters for the conversion of 18F-HX4 uptake to oxygen partial pressure that would also result in reasonable levels of hypoxia.
The application of a model originally derived for 18F-FMISO on a different tracer naturally makes the similarities between the tracers a topic of key relevance. Indeed, a modeling study by Toma-Dasu et al. [Citation10] showed that different tracers will render different images of the same tumor because of their intrinsic biochemical-, uptake-, and clearance characteristics. While Peeters et al. [Citation18] reported different accumulation patterns with respect to maximum and mean SUV for 18F-FMISO, 18F-HX4, 18F-FAZA, and 18F-FDG in rats, Carlin et al. [Citation19] found a broadly similar tracer distribution between 18F-FMISO and 18F-HX4 in nude mice, with similar mean SUV values of 0.44 and 0.42 for 18F-FMISO and 18F-HX4, respectively.
Clinical studies comparing 18F-HX4 with 18F-FMISO in particular are scarce. Chen et al. used a tumor-to-muscle ratio of 1.3 for both 18F-HX4 and 18F-FMISO in a study including 12 head and neck cancer patients with a p.i. imaging time of 1.5 hours for 18F-HX4 and 2 hours for 18F-FMISO. In the nine of these patients who underwent surgery, immunohistochemical analysis based on the hypoxia-specific marker CA-IX was also performed. With agreement in six out of these nine cases between 18F-HX4 and 18F-FMISO, a strong correlation in uptake was found between the two tracers based on the results of the immunohistochemical analysis [Citation25].
Wack et al. [Citation20] performed a comparative analysis of 18F-FMISO, 18F-FAZA, and 18F-HX4 through mathematical modeling of oxygen distribution and tracer binding. In agreement with the results of the pre-clinical study by Carlin et al. [Citation19], the pO2 at which the tracer binding is inhibited by 50% was assumed to be equal for all three tracers. Using diffusion parameters from the literature and clinically derived data on blood activity and clearance, 18F-HX4 was found to result in the highest image contrast at 4 h p.i., with the clearance of the tracer identified as the decisive factor for the image contrast [Citation17]. The simulated 2D activity distributions were very similar for 18F-FMISO and 18F-FAZA, while for 18F-HX4 the background activity was lower in comparison to the other tracers. However, the pattern of uptake in the representative examples shown is almost identical for all tracers. Thus, while the overall signal is clearly reduced for 18F-HX4, the tracer appears to have a distribution pattern that is very similar to both 18F-FMISO and 18F-FAZA. This is in line with the results of the present study, in which hypoxic sub-volumes based on the conversion of uptake to pO2 has been found to have similar size, shape, and relative location as the corresponding volumes based on an uptake ratio of 1.4 to the average SUV in the reference region.
Regardless if the segmentation is based on uptake directly, or on the conversion of the uptake to oxygen partial pressure, the region used as the well-oxygenated reference is highly influential on the resulting volumes. In the present study, two different types of reference regions were considered: the aortic arch and a region consisting of muscle tissue. The main difference between these regions is that the tracer is only expected to have been metabolized in the muscle, as the aortic arch contains circulating blood carrying the tracer. A higher average uptake in the muscle reference region compared to the aortic arch was found in 78% of the patients, suggesting that there could be a difference in considering either of these two types of tissues as reference. This is also illustrated by the DICE similarity coefficient for the HTVuptake based on either of the two reference regions, which was below 0.5 in more than half of the patients. As the DICE index applied to these volumes indicates their relative overlap with respect to both size and shape, this means that in a majority of the patients included in this study, the overlap between the HTVuptake based on the aortic arch or the muscle was less than 50% of at least one of the volumes. Furthermore, a higher uptake in the reference region translates into a higher threshold for the hypoxic sub-volumes subsequently defined based on an uptake that is 1.4 times higher than the average uptake in the respective reference region. A higher threshold implies smaller hypoxic sub-volumes, which can be problematic if part of the hypoxia is missed as a result of an uptake threshold that is too high. On the contrary, a volume based on a threshold that is too low might be too large to allow for dose-boosting without an unacceptable risk of toxicity. If that volume in fact contains non-hypoxic tissue, it would be equally problematic as the opposite case. Furthermore, the risk of false-positive lesions increases with a lower threshold, as the difference between what is considered hypoxic and the normoxic tissues is reduced, as was observed by Zegers et al. [Citation15]. The success of dose-painting in tumor sub-volumes based on uptake ratios therefore heavily relies on the suitability of the chosen reference region. The choice of reference region will also have a significant impact on the hypoxic sub-volumes identified by segmentation of pO2 threshold values based on a conversion of uptake into oxygen partial pressure. Since the actual hypoxic volumes could not be determined in the patients included in this study, a conclusion on which type of tissue constitutes the most suitable reference region cannot be drawn here. Ultimately, the clinical application of this model for dose-painting based on 18F-HX4 imaging must, therefore, be preceded by further studies on this topic including the derivation of suitable conversion parameters. Having obtained these, the clinical applicability of the model can be evaluated based on the required boost doses predicted for a given level of e.g., tumor control probability, and the feasibility to deliver such dose plans with respect to the normal tissue toxicity constraints.
Despite a limited number of patients in this study, the present results indicate that a model derived for converting tracer uptake into pO2 in 18F-FMISO-PET could be successfully applied to 18F-HX4 in terms of identifying sub-volumes of similar shape and size as based on the uptake directly. However, the absolute values of the calculated pO2 were larger than what is conventionally regarded as hypoxia. Thus, new model parameters for the expression in EquationEquation (1)(1) must be derived for 18F-HX4, such that the shape of the curve is preserved while reasonable values of pO2 can be calculated. This would allow for the calculation of boost doses required in patients imaged with 18F-HX4 for the purpose of e.g., dose-painting.
In conclusion, this study shows that the reference region and the conversion function used for defining the hypoxic volume based on PET imaging are of key importance. A non-linear conversion function between uptake and oxygen partial pressure for 18F-FMISO-PET could be applied to 18F-HX4 images to delineate hypoxic sub-volumes of similar size, shape, and relative location as based on the uptake directly. In order to apply the model for e.g., dose-painting, new parameters need to be derived for the accurate calculation of dose-modifying factors for this tracer.
IONC_1293289_Supplemental_material.pdf
Download PDF (603.9 KB)Acknowledgments
Jakob Ödén and Ana Ureba are gratefully acknowledged for fruitful discussions and valuable consultation.
Disclosure statement
The authors report no conflicts of interest. The authors alone are responsible for the content and writing of this article.
Additional information
Funding
Related Research Data
References
- Dische S. Chemical sensitizers for hypoxic cells: a decade of experience in clinical radiotherapy. Radiother Oncol. 1985;3:97–115.
- Chapman JD. Hypoxic sensitizers-implications for radiation therapy. N Engl J Med. 1979;301:1429–1432.
- Chapman JD, Franko AJ, Sharplin J. A marker for hypoxic cells in tumours with potential clinical applicability. Br J Cancer. 1981;43:546–550.
- Rajendran JG, Krohn KA. F-18 fluoromisonidazole for imaging tumor hypoxia: imaging the microenvironment for personalized cancer therapy. Semin Nucl Med. 2015;45:151–162.
- Koh WJ, Bergman KS, Rasey JS, et al. Evaluation of oxygenation status during fractionated radiotherapy in human nonsmall cell lung cancers using [F-18]fluoromisonidazole positron emission tomography. Int J Radiat Oncol Biol Phys. 1995;33:391–398.
- Rasey JS, Koh WJ, Evans ML, et al. Quantifying regional hypoxia in human tumors with positron emission tomography of [18F]fluoromisonidazole: a pretherapy study of 37 patients. Int J Radiat Oncol Biol Phys. 1996;36:417–428.
- Eschmann SM, Paulsen F, Reimold M, et al. Prognostic impact of hypoxia imaging with 18F-misonidazole PET in non-small cell lung cancer and head and neck cancer before radiotherapy. J Nucl Med. 2005;46:253–260.
- Bentzen SM, Gregoire V. Molecular imaging-based dose painting: a novel paradigm for radiation therapy prescription. Semin Radiat Oncol. 2011;21:101–110.
- Chang JH, Wada M, Anderson NJ, et al. Hypoxia-targeted radiotherapy dose painting for head and neck cancer using (18)F-FMISO PET: a biological modeling study. Acta Oncol. 2013;52:1723–1729.
- Toma-Dasu I, Dasu A, Brahme A. Quantifying tumour hypoxia by PET imaging-a theoretical analysis. Adv Exp Med Biol. 2009;645:267–272.
- Toma-Dasu I, Uhrdin J, Antonovic L, et al. Dose prescription and treatment planning based on FMISO-PET hypoxia. Acta Oncol. 2012;51:222–230.
- Krohn KA, Link JM, Mason RP. Molecular imaging of hypoxia. J Nucl Med. 2008;49(Suppl 2):129s–148s.
- Dubois LJ, Lieuwes NG, Janssen MH, et al. Preclinical evaluation and validation of [18F]HX4, a promising hypoxia marker for PET imaging. Proc Natl Acad Sci U S A. 2011;108:14620–14625.
- Even AJ, van der Stoep J, Zegers CM, et al. PET-based dose painting in non-small cell lung cancer: comparing uniform dose escalation with boosting hypoxic and metabolically active sub-volumes. Radiother Oncol. 2015;116:281–286.
- Zegers CM, van Elmpt W, Wierts R, et al. Hypoxia imaging with [18F]HX4 PET in NSCLC patients: defining optimal imaging parameters. Radiother Oncol. 2013;109:58–64.
- Zegers CM, van Elmpt W, Reymen B, et al. In vivo quantification of hypoxic and metabolic status of NSCLC tumors using [18F]HX4 and [18F]FDG-PET/CT imaging. Clin Cancer Res. 2014;20:6389–6397.
- Zegers CM, Hoebers FJ, van Elmpt W, et al. Evaluation of tumour hypoxia during radiotherapy using [18F]HX4 PET imaging and blood biomarkers in patients with head and neck cancer. Eur J Nucl Med Mol Imaging. 2016;43:2139–2146.
- Peeters SG, Zegers CM, Lieuwes NG, et al. A comparative study of the hypoxia PET tracers [(1)(8)F]HX4, [(1)(8)F]FAZA, and [(1)(8)F]FMISO in a preclinical tumor model. Int J Radiat Oncol Biol Phys. 2015;91:351–359.
- Carlin S, Zhang H, Reese M, et al. A comparison of the imaging characteristics and microregional distribution of 4 hypoxia PET tracers. J Nucl Med. 2014;55:515–521.
- Wack LJ, Monnich D, van Elmpt W, et al. Comparison of [18F]-FMISO, [18F]-FAZA and [18F]-HX4 for PET imaging of hypoxia – a simulation study. Acta Oncol. 2015;54:1370–1377.
- van Loon J, Janssen MH, Ollers M, et al. PET imaging of hypoxia using [18F]HX4: a phase I trial. Eur J Nucl Med Mol Imaging. 2010;37:1663–1668.
- Klaassen R, Bennink RJ, van Tienhoven G, et al. Feasibility and repeatability of PET with the hypoxia tracer [(18)F]HX4 in oesophageal and pancreatic cancer. Radiother Oncol. 2015;116:94–99.
- Zegers CM, van Elmpt W, Hoebers FJ, et al. Imaging of tumour hypoxia and metabolism in patients with head and neck squamous cell carcinoma. Acta Oncol. 2015;54:1378–1384.
- Zegers CM, van Elmpt W, Szardenings K, et al. Repeatability of hypoxia PET imaging using [18F]HX4 in lung and head and neck cancer patients: a prospective multicenter trial. Eur J Nucl Med Mol Imaging. 2015;42:1840–1849.
- Chen L, Zhang Z, Kolb HC, et al. 18F-HX4 hypoxia imaging with PET/CT in head and neck cancer: a comparison with 18F-FMISO. Nucl Med Commun. 2012;33:1096–1102.