
Abstract
Background: Dynamic contrast-enhanced magnetic resonance imaging (DCE-MRI) may provide prognostic biomarkers for cervix carcinoma. We have shown previously that the early phase of the signal intensity-versus-time curve (SITC) may have significant prognostic power. The purpose of the present investigation was to explore the prognostic value of the late phase of the SITC.
Material and methods: DCE-MRI data of 80 patients (FIGO stage IB–IVA) treated with concurrent chemoradiotherapy were examined. Four parameters were calculated from the late-phase SITC: tumor volume with decreasing signal, tumor fraction with decreasing signal, tumor volume with increasing signal (TVIS), and tumor fraction with increasing signal.
Results: Multivariate analysis involving clinical parameters and late-phase SITC parameters suggested that TVIS is a strong independent prognostic factor for both disease-free and overall survival. When early-phase SITC parameters were included in the multivariate analysis, the early-phase SITC, but not the late-phase SITC, was found to have independent prognostic value.
Conclusion: The late-phase SITC can provide prognostic factors for the outcome of cervix carcinoma, that is, a large tumor volume with increasing late-phase SITCs is associated with poor outcome. However, the prognostic power of the late-phase SITC is not as strong as that of the early-phase SITC.
Introduction
Locally advanced carcinoma of the uterine cervix is usually treated with aggressive concurrent cisplatin-based chemoradiotherapy [Citation1,Citation2]. The treatment results in a 5-year survival rate of 65–70% and a high incidence of treatment-induced complications [Citation3]. Precision medicine is an emerging approach in several diseases, and it has been suggested that the outcome of locally advanced cervix cancer may be improved by personalizing the treatment [Citation4]. Because treatment failure and poor survival rates are associated with extensive hypoxia in the primary tumor [Citation5,Citation6], personalized treatment strategies for cervix carcinoma require noninvasive biomarkers reflecting the perfusion and oxygenation status of the tumor tissue [Citation7].
There is significant evidence from preclinical and clinical investigations that dynamic contrast-enhanced magnetic resonance imaging (DCE-MRI) with gadolinium diethylene-triamine penta-acetic acid (Gd-DTPA) as contrast agent may have the power to provide information on the oxygenation of cervix carcinomas [Citation8–10]. Furthermore, the outcome of cervix carcinoma has been shown to be associated with parameters derived from DCE-MRI series by quantitative and/or semiquantitative image analysis [Citation11–17]. However, a robust DCE-MRI strategy for assessing tumor oxygenation and predicting treatment outcome has not been developed for cervix carcinoma thus far. Such a strategy would be useful for guiding personalized radiation therapy, selecting patients for radiation therapy trials involving hypoxia modifications, and monitoring changes in tumor oxygenation induced by therapeutic interventions.
In most DCE-MRI studies of cervix carcinoma, the early phase of the signal intensity-versus-time curve (SITC) is emphasized, whereas rigorous analyses of the later phases are sparse. The early-phase SITC is influenced primarily by tumor blood perfusion and vessel permeability, whereas the late-phase SITC is influenced strongly by tumor cell density [Citation8,Citation11]. Because high cell density may lead to high oxygen consumption and tumor hypoxia, it is possible that the early-phase and late-phase SITC may provide independent prognostic information.
In a previous study of cervix carcinoma, we showed that parameters calculated from images recorded during the first 60 s after contrast administration had significant prognostic power [Citation18]. In that study, large total volume and large fractional volume of low-enhancing tumor voxels correlated with poor disease-free survival (DFS) and poor overall survival (OS). In the present study, we analyzed the late phase of the SITC in the same patient cohort. The primary aim of the study was to explore the prognostic value of the late-phase SITC and to reveal whether any prognostic value may add to that of the early-phase SITC.
Material and methods
Patients
Eighty-five consecutive patients with untreated locally advanced cervix cancer (FIGO stage IB through IVA) admitted to the Norwegian Radium Hospital between September 2004 and May 2007 were included in the study. Five patients were not evaluable due to poor signal-to-noise ratio in the late-phase SITC caused by extensive bowel movement and bladder filling. The demographics of the evaluable patients are presented in Supplementary Table 1. The investigation was approved by the regional committee of medical research ethics in southern Norway and was conducted in accordance with the Declaration of Helsinki. Written informed consent was obtained from each patient.
Patients, imaging, and treatment were described in our previous study of the early-phase SITC [Citation18]. Briefly, pretreatment DCE-MRI was carried out by using an axial T1-weighted spoiled gradient recalled sequence [repetition time: 160 ms; echo time: 3.5 ms; flip angle: 90°; number of excitations (number of averages): 1; field of view: 20 × 20 cm2; image matrix: 256 × 256; slice thickness: 5 mm; slice spacing: 6 mm; voxel size: 0.78 × 0.78 × 5.0 mm3; temporal resolution: 29 s; total sampling time: 10 min]. A total of 21–25 slices covering the genitalia interna were scanned. Tumor volume and lymph node status were assessed by examining T2-weighted MR images in the open source dicom viewer Osirix. The patients were treated with cisplatin-based concurrent chemoradiotherapy with curative intent. The primary endpoints were DFS, defined as the time to local or distant relapse or death from the date of diagnosis, and OS, defined as the interval from diagnosis to death.
Image analysis
The DCE-MR images were analyzed voxelwise by using in-house-made software developed in Matlab. Minor tumor movements during the DCE-MRI were corrected for by moving postcontrast regions of interest to fit with the coordinates of the first precontrast image. Tumor voxels showing signal intensities in T2-weighted images consistent with the presence of water or air were excluded from analysis to diminish any unwanted influence by tumor necrosis and the cervical and uterine cavities.
The late-phase SITC was defined as a 6-min-long time interval, from 3 min to 9 min after the administration of contrast. Linear curves were fitted to the signal intensities in this period by regression analysis, and if statistical analysis showed that the slope of a curve was different from zero by using a significance criterion of p < .05, the corresponding voxel was labeled ‘increasing signal intensity’ when the slope was >0 and ‘decreasing signal intensity’ when the slope was <0. From the number of voxels of each category, the total number of tumor voxels, and the voxel size, four parameters were calculated for each primary tumor: tumor volume with decreasing signal (TVDS), tumor fraction with decreasing signal (TFDS), tumor volume with increasing signal (TVIS), and tumor fraction with increasing signal (TFIS).
Quality control of the image analysis was carried out to validate the software and to ensure that high-quality data were derived from the DCE-MRI series. First, the curve fits were found to be of acceptable quality by examining a large number of voxels in all tumors. Second, late-phase SITC images were constructed for the tumors, and by visual inspection of these images and the corresponding post-contrast T1-weighted images, it was verified that the SITC images were in good agreement with the signal intensity changes seen in the T1-weighted series.
In accordance with the observation that standard first-line treatment fails in approximately one-third of the patients with locally advanced cervix carcinoma [Citation3], we divided the patients into two groups consisting of one-third and two-thirds of the cohort in the same way as in our study of the early-phase SITC [Citation18], implying that the larger group was the group with the highest TVDS, highest TFDS, lowest TVIS, and lowest TFIS. These divisions into groups defined the cutoff values separating low from high TVDS, TFDS, TVIS, and TFIS. The DFS and the OS of the two groups were compared by using the log-rank test, and the results are presented as Kaplan–Meier plots. Univariate and multivariate Cox regression analyses including clinical and/or DCE-MRI–derived parameters were conducted to identify prognostic factors for DFS and OS, using a significance criterion of p < .05. Corrections for multiple comparisons were not performed due to the exploratory nature of the work, and the study should therefore be considered as a hypothesis-generating study.
Results
The actuarial DFS and OS at 5 years were 62% and 66%, respectively. Tumor progression or recurrence was documented in 23 patients, six in the pelvis alone, three in the pelvis and para-aortic lymph nodes or distant sites, and 14 in para-aortic lymph nodes or distant sites alone. Two patients were clinically disease-free after further treatment, whereas 21 patients died from their recurrences (20 patients) or intercurrent disease (one patient).
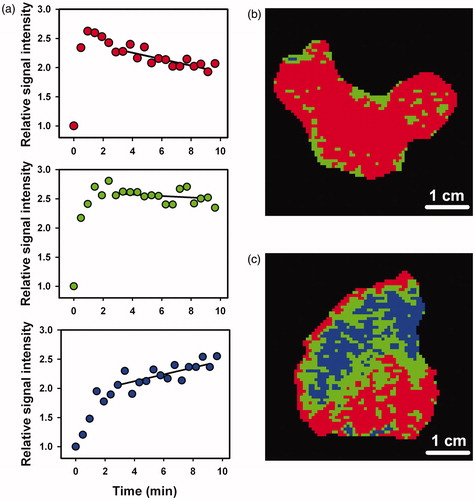
The late-phase SITC showed significant intra- and intertumor heterogeneity. Representative examples of the three main types of SITC are presented in . The SITCs refer to single voxels and show that the curve fits were of acceptable quality. Trinary late-phase SITC images of a tumor with little and a tumor with significant intratumor heterogeneity are presented in . Voxels having SITC with decreasing signal intensity are shown in red, voxels having SITC with increasing signal intensity are shown in blue, and voxels having SITCs with slopes that were not different from zero are shown in green. These examples of SITC images refer to a tumor with high TFDS () and a tumor with high TFIS (). The intertumor heterogeneity in TVDS, TFDS, TVIS, and TFIS was substantial. TVDS and TFDS ranged from 0.3 cm3 to 88 cm3 (TVDS) and from 0.1 to 1.0 (TFDS), whereas TVIS and TFIS were substantially lower and ranged from 0 cm3 to 22 cm3 (TVIS) and from 0 to 0.28 (TFIS).
Figure 1. Relative signal intensity versus time after the administration of contrast agent for single tumor voxels, illustrating the three main types of late-phase SITC and the curve fits (a). Late-phase SITC images of a homogeneous tumor with high TFDS (b) and a heterogeneous tumor with a high TFIS (c). Voxels showing decreasing signal intensity are depicted in red, voxels showing increasing signal intensity are depicted in blue, and voxels having SITCs with slopes that were not significantly different from zero are depicted in green.
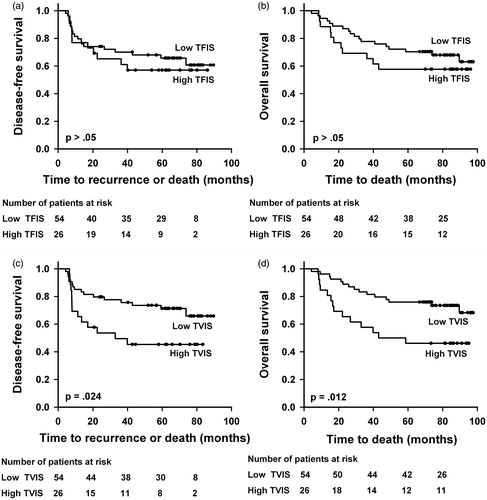
Kaplan–Meier plots for DFS and OS based on TVDS and TFDS are shown in . Patients with low TFDS did worse than those with high TFDS, with a 5-year DFS of 41% versus 73% (p = .0055) and a 5-year OS of 42% versus 77% (p = .0048). There was no significant difference in DFS or OS between the patients with low and those with high TVDS (p > .05 for DFS and OS). Equivalent Kaplan–Meier curves based on TVIS and TFIS are presented in , showing lower DFS and OS for patients with high TVIS than for patients with low TVIS. The 5-year DFS was 45% versus 71% (p = .024) and the 5-year OS was 46% versus 75% (p = .012). Neither DFS nor OS differed between the patients with high TFIS and those with low TFIS (p > .05 for DFS and OS).
Figure 2. Kaplan–Meier curves for DFS and OS stratified by TFDS (a, b) and TVDS (c, d). The cutoff separating low (N = 26) from high (N = 54) TFDS was 0.425, and the cutoff separating low (N = 26) from high (N = 54) TVDS was 5.0 cm3.
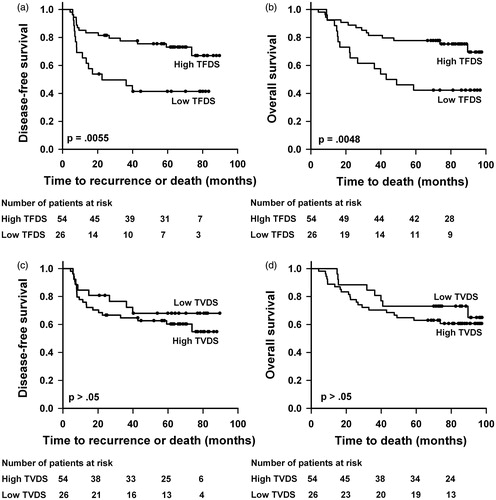
Figure 3. Kaplan–Meier curves for DFS and OS stratified by TFIS (a, b) and TVIS (c, d). The cutoff separating low (N = 54) from high (N = 26) TFIS was 0.040, and the cutoff separating low (N = 54) from high (N = 26) TVIS was 0.7 cm3.
The results from the univariate Cox regression analysis are presented in . The analysis of clinical parameters revealed that DFS and OS were influenced significantly by tumor volume and FIGO stage, but not by lymph node status, tumor histology, and patient age. The analysis of DCE-MRI parameters showed that DFS was influenced significantly by TVIS, whereas the influence by TFIS was of borderline significance. Furthermore, OS was influenced significantly by TFDS, TVIS, and TFIS, whereas the influence by TVDS was of borderline significance.
Table 1. Cox regression analysis of clinical and late-phase SITC parameters.
Multivariate Cox regression analysis including tumor volume, FIGO stage, lymph node status, and TVDS, TFDS, TVIS, or TFIS showed that FIGO stage and TVIS were independent prognostic factors for DFS, whereas TFDS, TVIS, and TFIS were independent prognostic factors for OS (). Even though the univariate analysis revealed that DFS and OS were not influenced significantly by lymph node status, lymph node status was included in the multivariate analysis because many studies have suggested that lymph node status may be an independent prognostic factor in locally advanced cervix cancer. Independent clinical prognostic factors for OS could not be identified; however, the impact of FIGO stage was of borderline significance. In other words, TVIS was the only common independent prognostic factor for DFS and OS, implying that a large TVIS, that is, a large tumor volume with increasing late-phase SITCs was associated with poor outcome.
In our previous study of the early-phase SITC, we found that poor prognosis was associated with low signal enhancement, using four parameters for low-signal enhancement, that is, large low-enhancing tumor volume (LETV) and large low-enhancing tumor fraction (LETF), each assessed by the enhancing fraction (EF)-method and the signal intensity (SI)-method [Citation18]. Multivariate Cox regression analysis was carried out by adding each of these early-phase SITC parameters to the parameters in . The analysis revealed that none of the late-phase SITC parameters had independent prognostic value, whereas the early-phase SITC parameters had ( and Supplementary Tables 2–4). LETF (EF-method) was the most robust independent prognostic factor, that is, a large fraction of low enhancing voxels 60 s after contrast administration correlated strongly with poor outcome ().
Table 2. Multivariate Cox regression analysis of clinical and late-phase SITC parameters together with LETF.
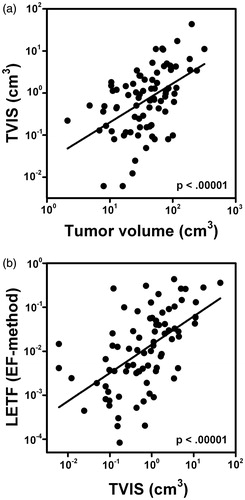
The multivariate Cox regression analyses suggested that there was a colinearity between TVIS and tumor volume and between LETF (EF-method) and TVIS. This was confirmed by plotting TVIS versus tumor volume (p < .00001, R2 = .25, ) and LETF (EF-method) versus TVIS (p < .00001, R2 = 0.31, ).
Figure 4. Plots of TVIS versus tumor volume (a) and LETF (EF-method) versus TVIS (b) for locally advanced cervix carcinoma. Points refer to individual tumors. Curves were fitted to the points by linear regression analysis.
Discussion
Several investigations have revealed that early-phase DCE-MRI may provide prognostic factors for locally advanced cervix cancer [Citation11–17]. In the present study, DCE-MRI was conducted for 10 min after Gd-DTPA administration to investigate whether late-phase DCE-MRI may provide novel and more powerful DCE-MRI-based prognostic factors. Five clinical (tumor volume, FIGO stage, lymph node status, tumor histology, and patient age) and four DCE-MRI (TVDS, TFDS, TVIS, and TFIS) parameters were included in the study, and multivariate Cox regression analysis revealed that TVIS was a common independent prognostic factor for DFS and OS. Standard clinical parameters like tumor volume, FIGO stage, and lymph node status were not identified as common independent prognostic factors, perhaps because the fraction of stage IIB patients was unusually high in our patient cohort. It should also be noticed that there was a significant correlation between TVIS and tumor volume.
In other words, our DCE-MRI study showed that a large tumor volume with increasing late-phase SITCs may be associated with poor outcome in locally advanced cervix carcinoma. An increasing late-phase SITC in a voxel implies that contrast agent diffuses slowly into the voxel. Voxels showing increasing late-phase SITCs are most likely localized in poorly vascularized tumor regions characterized by hypoxia and/or necrosis. Large necrotic regions were identified in T2-weighted images in this study, and these regions were excluded from analysis, suggesting that the tumor regions with increasing SITCs were dominated by hypoxic tissue. According to this suggestion, high TVIS reflects a large tumor volume with hypoxic tissue, and moreover, the association between high TVIS and poor DFS and OS reflects that poor outcome was a consequence of extensive tumor hypoxia. This finding corroborates the understanding that tumor hypoxia causes resistance to radiation therapy and promotes metastatic dissemination and growth in cervix cancer [Citation19–26].
In a previous study of this patient population, we found that large LETV and large LETF assessed 60 s after contrast administration were associated with poor DFS and poor OS [Citation18]. In that study, large LETV and large LETF were interpreted as being a result of extensive tumor hypoxia, and furthermore, that poor DFS and OS were a consequence of hypoxia-induced treatment resistance and lymph node metastasis, similar to the interpretation of the observations reported here. Taken together, these two studies suggest that the early-phase SITC as well as the late-phase SITC have prognostic value for the outcome of locally advanced cervix carcinoma.
The late-phase and the early-phase SITC parameters with the strongest prognostic power were TVIS and LETF, respectively. Both these parameters have advantages and disadvantages as prognostic factors for cervix cancer. The main advantage of LETF is that this parameter can be calculated from short-term DCE-MRI series lasting for only 1–2 min, a significant advantage since scan time is a limiting factor in many radiology departments. The primary disadvantage is that the calculation of LETF requires threshold values for signal intensity, and because signal intensities vary depending upon MR scanner and/or protocol, each radiology department has to establish and use its own threshold values. TVIS has the disadvantage that its assessment requires long scanning times and the advantage that it does not depend on MR scanner or MR protocol, implying that data can be compared easily across different institutions.
Importantly, there was a significant correlation between LETF and TVIS, implying that these parameters are not independent of each other. Multivariate Cox regression analysis involving late-phase SITC parameters, early-phase SITC parameters, and clinical parameters revealed that LETF was an independent prognostic factor for DFS and OS, whereas TVIS was not. This observation suggests that LETF has stronger prognostic power than TVIS, and therefore, LETF may be preferable to TVIS as a DCE-MRI-derived prognostic factor for locally advanced cervix cancer.
Our investigation has some important limitations. First, because the DCE-MRI series were recorded at a time when the spatial and temporal resolutions of the recordings were poorer than today due to MR scanner limitations, validation in an independent patient population is warranted. Second, DCE-MRI data of only 80 evaluable patients were examined. Third, T2-weighted images were used to delineate tumors and to exclude image regions clearly influenced by tumor necroses and cavities, and although the T2-weighted images were recorded at high spatial resolution and the delineation was conducted by two experienced radiologists, we cannot exclude the possibility that some regions were missed. Despite these limitations, our study provides significant evidence that a large tumor volume with increasing late-phase SITCs is associated with poor outcome in locally advanced cervix carcinoma.
In summary, DCE-MRI is a powerful noninvasive method for providing prognostic information on locally advanced cervix carcinoma. Prognostic factors independent of conventional clinical prognostic factors such as tumor volume, FIGO stage, and lymph node status can be derived from the late-phase as well as the early-phase SITC, and the early-phase SITC has stronger prognostic power than the late-phase SITC. A large fraction of low-enhancing voxels 60 s after the administration of contrast agent or a large tumor volume with increasing signal intensity 3–9 min after contrast administration are associated with poor DFS and OS in cervix cancer patients treated with concurrent cisplatin-based chemoradiotherapy.
IONC_1294762_Supplemental_material.pdf
Download PDF (108 KB)Acknowledgements
Hans Henrik Lien and Kjetil Knutstad, Department of Radiology and Nuclear Medicine, are thanked for their active cooperation in the study.
Disclosure statement
The authors report no conflicts of interest. The authors alone are responsible for the content and writing of the paper.
Additional information
Funding
Related Research Data
References
- Eifel PJ. Concurrent chemotherapy and radiation therapy as the standard of care for cervical cancer. Nat Clin Pract Oncol. 2006;3:248–255.
- Barbera L, Thomas G. Management of early and locally advanced cervical cancer. Semin Oncol. 2009;36:155–169.
- Green JA, Kirwan JM, Tierney JF, et al. Survival and recurrence after concomitant chemotherapy and radiotherapy for cancer of the uterine cervix: a systematic review and meta-analysis. Lancet. 2001;358:781–786.
- Klopp AH, Eifel PJ. Biological predictors of cervical cancer response to radiation therapy. Semin Radiat Oncol. 2012;22:143–150.
- Höckel M, Knoop C, Schlenger K, et al. Intratumoral pO2 predicts survival in advanced cancer of the uterine cervix. Radiother Oncol. 1993;26:45–50.
- Vaupel P, Mayer A. Hypoxia in cancer: significance and impact on clinical outcome. Cancer Metastasis Rev. 2007;26:225–239.
- Barwick TD, Taylor A, Rockall A. Functional imaging to predict tumor response in locally advanced cervical cancer. Curr Oncol Rep. 2013;15:549–558.
- Ellingsen C, Hompland T, Galappathi K, et al. DCE-MRI of the hypoxic fraction, radioresponsiveness, and metastatic propensity of cervical carcinoma xenografts. Radiother Oncol. 2014;110:335–341.
- Cooper RA, Carrington BM, Loncaster JA, et al. Tumour oxygenation levels correlate with dynamic contrast-enhanced magnetic resonance imaging parameters in carcinoma of the cervix. Radiother Oncol. 2000;57:53–55.
- Lyng H, Vorren AO, Sundfør K, et al. Assessment of tumor oxygenation in human cervical carcinoma by use of dynamic Gd-DTPA-enhanced MR imaging. J Magn Reson Imaging. 2001;14:750–756.
- Zahra MA, Hollingsworth KG, Sala E, et al. Dynamic contrast-enhanced MRI as a predictor of tumour response to radiotherapy. Lancet Oncol. 2007;8:63–74.
- Yuh WTC, Mayr NA, Jarjoura D, et al. Predicting control of primary tumor and survival by DCE MRI during early therapy in cervical cancer. Invest Radiol. 2009;44:343–350.
- Yamashita Y, Baba T, Baba Y, et al. Dynamic contrast-enhanced MR imaging of uterine cervical cancer: pharmacokinetic analysis with histopathologic correlation and its importance in predicting the outcome of radiation therapy. Radiology. 2000;216:803–809.
- Mannelli L, Patterson AJ, Zahra M, et al. Evaluation of nonenhancing tumor fraction assessed by dynamic contrast-enhanced MRI subtraction as a predictor of decrease in tumor volume in response to chemoradiotherapy in advanced cervical cancer. AJR Am J Roentgenol. 2010;195:524–527.
- Semple SIK, Harry VN, Parkin DE, et al. A combined pharmacokinetic and radiologic assessment of dynamic contrast-enhanced magnetic resonance imaging predicts response to chemoradiation in locally advanced cervical cancer. Int J Radiat Oncol Biol Phys. 2009;75:611–617.
- Andersen EKF, Hole KH, Lund KV, et al. Pharmacokinetic parameters derived from dynamic contrast enhanced MRI of cervical cancers predict chemoradiotherapy outcome. Radiother Oncol. 2013;107:117–122.
- Hawighorst H, Weikel W, Knapstein PG, et al. Angiogenic activity of cervical carcinoma: assessment by functional magnetic resonance imaging-based parameters and a histomorphological approach in correlation with disease outcome. Clin Cancer Res. 1998;4:2305–2312.
- Lund KV, Simonsen TG, Hompland T, et al. Short-term pretreatment DCE-MRI in prediction of outcome in locally advanced cervical cancer. Radiother Oncol. 2015;115:379–385.
- Kolstad P. Intercapillary distance, oxygen tension and local recurrence in cervix cancer. Scand J Clin Lab Invest Suppl. 1968;106:145–157.
- Fyles AW, Milosevic M, Wong R, et al. Oxygenation predicts radiation response and survival in patients with cervix cancer. Radiother Oncol. 1998;48:149–156.
- Sundfør K, Lyng H, Tropé CG, et al. Treatment outcome in advanced squamous cell carcinoma of the uterine cervix: relationships to pretreatment tumor oxygenation and vascularization. Radiother Oncol. 2000;54:101–107.
- Nordsmark M, Loncaster J, Aquino-Parsons C, et al. The prognostic value of pimoni-dazole and tumour pO2 in human cervix carcinomas after radiation therapy: a prospective international multi-center study. Radiother Oncol. 2006;80:123–131.
- Sundfør K, Lyng H, Rofstad EK. Tumour hypoxia and vascular density as predictors of metastasis in squamous cell carcinoma of the uterine cervix. Br J Cancer. 1998;78:822–827.
- Pitson G, Fyles A, Milosevic M, et al. Tumor size and oxygenation are independent predictors of nodal diseases in patients with cervix cancer. Int J Radiat Oncol Biol Phys. 2001;51:699–703.
- Höckel M, Schlenger K, Aral B, et al. Association between tumor hypoxia and malignant progression in advanced cancer of the uterine cervix. Cancer Res. 1996;56:4509–4515.
- Fyles A, Milosevic M, Pintilie M, et al. Long-term performance of interstial fluid pressure and hypoxia as prognostic factors in cervix cancer. Radiother Oncol. 2006;80:132–137.