
Abstract
Background: Pre-treatment magnetic resonance imaging (MRI) can give patient-specific evaluation of suspected pathologically involved volumes in the seminal vesicles (SV) in prostate cancer patients. By targeting this suspicious volume we hypothesize that radiotherapy is more efficient without introducing more toxicity. In this study we evaluate the concept of using MRI-defined target volumes in terms of tumor control probability (TCP) and rectal normal tissue complication probability (NTCP).
Material and methods: Twenty-one high-risk prostate cancer patients were included. Pre-treatment CT images, T2 weighted (T2w) MRI and two multi-parametric MRI were acquired. Overlap between a suspicious volume in the SV observed on T2w images and a suspicious volume observed on either multi-parametric MRI was assumed to reflect a true malignant region (named ‘MRI positive’). In addition the entire SV on the CT-scan was delineated. Three treatment plans of 2 Gy ×39 fractions were generated per patient: one covering the MRI positive volume in SV and prostate with margin of 11 mm to the MRI positive in the SV and two plans covering prostate and SV using 11 and 7 mm SV margin, respectively. All plans were prescribed the same PTV mean dose. Rectal NTCP grade ≥2 was evaluated with the Lyman–Kutcher–Burman model and TCP was estimated by a logistic model using the combined MRI positive volume in SV and prostate as region-of-interest.
Results: Fourteen of twenty-one patients were classified as MRI positive, six of which had suspicious volumes in all three MRI modalities. On average TCP for the plan covering prostate and the MRI positive volume was 3% higher (up to 11%) than the two other plans which was statistically significant. The increased TCP was obtained without increasing rectal NTCP grade ≥2.
Conclusions: Using functional MRI for individualized target delineation in the SV may improve the treatment outcome in radiotherapy of prostate cancer without increasing the rectal toxicity.
Introduction
High-risk prostate cancer patients have an increased probability of seminal vesicles (SV) involvement especially in the proximal 2 cm [Citation1]. The mobility of the prostate and the SV during a course of radiotherapy, both in between fractions and during a single fraction, is well-documented [Citation2]. Inter-fraction variation of the prostate position is usually dealt with by applying adequate margins and using fiducial markers in combination with daily imaging. However, when the SV is part of the target volume, the relative motion of the two organs needs to be taken into account. The standard deviation of the daily variation of the center of mass for the SV is reported to be 2.6 mm in [Citation3] which agrees with other reported results [Citation2]. It has been shown that a margin of 11 mm around the SV ensures dose coverage when daily image guidance without rotational correction is used on the prostate [Citation3,Citation4]. However, adding such large margins may increase the dose to the rectum and bladder and, as a result, the risk of toxicity.
Pre-treatment functional magnetic resonance imaging (MRI) can give a patient-specific evaluation of suspected pathologically involved volumes in prostate cancer patients [Citation5–8]. For this study we used the two functional scans diffusion weighted imaging (DWI) and dynamic contrast enhanced (DCE) MRI. We assumed that the two functional scans together with the anatomical T2 weighted (T2w) MRI could define the target volume in SV and consequently tumor control. Under this assumption we investigated the impact on tumor control probability (TCP) and normal tissue complication probability (NTCP) for different planning target volume (PTV) strategies. The aim was to compare three different PTV strategies and evaluate the treatment plans by the TCP and NTCP for rectal toxicity.
Material and methods
Twenty-four consecutive prostate cancer patients referred to radiotherapy with an intact prostate scanned between March 2015 and April 2016 were enrolled in the study; three of these patients were excluded due to poor quality of the functional MRI scans. All patients were classified as high-risk patients: PSA ≥10 and/or Gleason score ≥7 and/or T stage ≥ T2b (see supplementary material S1). This work was performed as a retrospective quality assurance study of current clinical practice.
Imaging protocol
The radiotherapy planning CT was performed on a Siemens Somatom Definition AS 64-slice scanner (Siemens Healthineers, Erlangen, Germany) with Combifix fixation (CIVCO Medical solutions, Orange City, LA) and a slice thickness of 2 mm. Pre-treatment MRI was acquired on a Siemens Magnetom Espree 1.5 T scanner (Siemens Healthineers, Erlangen, Germany) using the same fixation. A surface coil placed directly on the patient was used. An imaging protocol of 28 min containing sequences described below was performed. A transverse T2 weighted turbo spin echo sequence was acquired with TR = 4100 ms, TE = 93 ms, a field-of-view of 250 mm and voxel size of 0.8 × 0.8 × 3 mm. The DWI sequence was performed with b = 0, 500 and 1000, TR = 3200 ms, TE = 104 ms, fat saturation and voxel size of 2 × 2×4 mm. The apparent diffusion coefficient (ADC) map was calculated online using the Siemens scanner software (Syngo MR Acquisition Workplace, Numaris/4, version Syngo MR B19) including all b values. Prior to DCE imaging, two T1 weighted sequences with flip angles of 2 and 15 degrees, respectively, were obtained for absolute T1 values needed for modeling. Following injection of Gadovist contrast agent (Bayer Pharma AG, Berlin, Germany, injected in a concentration of 1.0 mmol per ml, 0.1 ml per kg, maximum 10 ml) a T1 weighted sequence was repeated 50 times to monitor contrast enhancement over a time period of 6 min. For this sequence, TR = 5.03 ms, TE = 1.71 ms and the voxel size 1.5 × 1.5 × 3 mm. Calculation of the transfer constant Ktrans was performed using the module ‘Syngo Tissue 4D’ in Syngo Multimodality Workplace (Syngo B19 VE52A, Siemens Healthineers, Erlangen, Germany) fitting the data to the Toft model with extraction of Ktrans [Citation9]. A generic arterial input function appropriate of the prostate was used instead of an individual measurement in order to avoid measurement uncertainties. For Ktrans we used a routine within the software to correct for motion between successive images. The correction was visually inspected.
CT and MRI were performed on the same day and approximately 1 hour apart. Registration between the scans was done on inserted Nickel–Titanium based implanted markers (Beammarks®, Beampoint AB, Kista, Sweden) with a dimension of 2 × 5 mm. The markers were also used for daily setup prior to each fraction of radiotherapy. Patients were given laxatives and scanned/treated with comfortable filled bladder.
Structure delineation
SV, rectum, bladder and femoral heads were delineated in the planning CT by an experienced radiation oncologist following department guidelines. Current clinical practice in our clinic for high-risk patients is to include the 2 cm proximal part of the SV in the treatment volume as recommended [Citation1], except for patients with clinical stage T3b where the entire SV is included. The delineation of the SV were extended for all patients for this study to include the entire organ and defined as the CTV for the SV (CTV_SV). The outer contour of the rectum was extended in the target region of the largest PTV in all cases. Study delineations of the rectum and SV were performed by a medical physicist, where the SV delineations were reviewed by either a radiologist or a radiation oncologist. Delineations of suspicious volumes in the T2w image and in the functional MRIs were performed by an experienced (>10 year) radiation oncologist, in a separate session, but not blinded. The contour of the prostate (CTV_prostate) was adopted without modifications from the clinical delineation based on the T2w images, and transferred by rigid registration based on the implanted markers to the planning CT. A rigid manual registration of the Ktrans and ADC maps to the T2w image was performed to account for motion between sequences.
Positive volumes in the different MR images were contoured retrospectively for the purpose of this study: in the T2w images, hypointense volumes were defined as GTVs if they could be distinguished from the surrounding anatomy [Citation5]. Volumes within the prostate were included in the GTV if it was hypointense and asymmetrical (particularly in the transverse slice) or poorly defined and/or disrupted transition between the zones of the prostate. The GTV volume in the SV was required to be contiguous and visible in at least two abutting slices. In the Ktrans map, extracted from the DCE sequence, volumes were included in the GTV if it was hyperintense and was within the SV or prostate. Transitions between different tissues were difficult to identify in the Ktrans maps and, therefore, the T2w images were used for anatomical guidance when needed. In the ADC map calculated from the DWI, hypointense volumes were delineated as GTV if they were within either the SV or the prostate. The anatomy was easier to determine compared to the Ktrans map, however, the T2w images were used for anatomical guidance when needed.
MRI defined volumes lying directly in the vicinity of setup markers in the prostate were assumed to be artifacts and were therefore excluded from the delineation of GTVs in the different MR images.
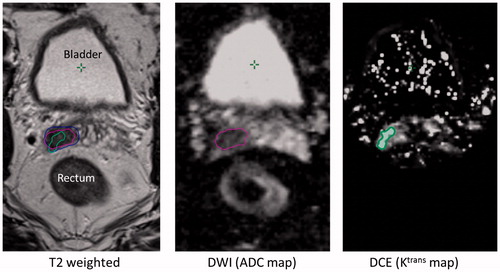
Based on T2w images the GTVs were separated into SV and prostate parts. The T2w GTV in the SV was considered confirmed, corresponding to a ‘true malignant volume’, if there was an overlap with either the GTV found in the ADC map and/or GTV in the Ktrans map. This confirmed volume was defined as an MRI positive volume and the scans/images/patient were denoted as MRI positive. An example of GTVs in the right SV found in all three MRIs is shown in . For patients with no or non-confirmed GTV in the T2w image, the MRI was defined as negative, see supplement material S2.
Figure 1. Example of a suspicious volume in the right side of the SV found in the T2w image and confirmed by both ADC and Ktrans map. The blue, pink and green contours are the delineated GTVs in the T2w image, the ADC map and the Ktrans map, respectively. The Ktrans map is not calculated in the complete image due to software limitations.
Two CTVs were defined for the MRI positive volumes: the MRI positive volume in the prostate (CTV_prostate_MRI) and the MRI positive volume in the SV (CTV_SV_MRI). Three different PTV strategies were used when planning the dose to the SV and prostate for each patient:
PTV_MRI+: the union of CTV_SV_MRI with 11 mm margin and CTV_prostate_MRI with a margin of 5 mm/5 mm/7 mm in the anterior–posterior (AP), left–right (LR) and craniocaudal (CC) directions.
PTV_SV 11 mm: the union of CTV_SV with a margin of 11 mm and CTV_prostate with a margin of 5 mm/5 mm/7 mm in the AP, LR and CC directions.
PTV_SV 7 mm: the union of CTV_SV with a margin of 7 mm and CTV_prostate with a margin of 5 mm/5 mm/7 mm in the AP, LR and CC directions.
MRI positive volumes were transferred to the CT scan by a deformable registration in SmartAdapt (Varian Medical systems, Palo Alto, CA).
Treatment planning
Treatment plans were calculated to deliver 78 Gy in 39 fractions to the entire PTV of the respective planning strategy. All plans were volumetric arc plans and normalized to a mean dose of 78 Gy to the relevant PTV. The majority (61 out of 63) of plans were optimized with RapidPlan using the clinically commissioned algorithm PO 13.6.23 (Varian Medical Systems, Palo Alto, CA). The remaining two plans were optimized without using the RapidPlan model but using the same optimization module. The model in RapidPlan had been trained with a representative selection of 34 clinically approved plans for prostate cancer patients with target being the prostate and SV. The planning goal was to ensure that 95% of the respective PTV should be covered by 98% of the prescribed dose as the highest priority. Dose to rectum, bladder and femoral heads were included in the optimization to ensure the lowest dose possible without compromising the dose coverage of the PTV. An example is shown in supplementary material S3 of the dose distribution for a MR +11 mm plan with the contours for the PTVs for the SV 11 and SV 7 mm plans shown for comparison.
In addition to organ at risk doses, conformity index (CI) and homogeneity index (HI) were calculated as follows: CI = volume of the 98% isodose/volume of the PTV [Citation10]. HI = (D2–D98%)/D50%, where DX% is the minimum dose to X% of the volume of the PTV and were extracted from the dose-volume-histograms (DVH) of the PTV dose coverage [Citation11].
Statistical comparison of dose and planning metrics was performed by Wilcoxon signed rank test using a two-sided significance level of 0.05. Comparison of CI and HI between the MRI positive and MRI negative groups were performed by two-sample t-test with a significance level of 0.05.
NTCP and TCP modeling
The NTCP of rectal toxicity of grade ≥2 was modeled using the Lyman–Kutcher–Burman formulation from the QUANTEC paper using the parameters n = 0.09, m = 0.13 and TD50 = 76.9 Gy [Citation12,Citation13] and DVH for the rectum. The equation is included in the supplementary material S4. The model parameter n describes the volume effect, m the slope of the dose-response curve and TD50 the uniform dose corresponding to a 50% risk of complications. The bladder NTCP for grade ≥1 was modeled using the equations in supplementary material S4 using the parameters n = 0.00995, m = 0.022 and TD50 = 77.6 Gy [Citation14].
TCP was modeled using a logistic dose-response function with parameters defined through a meta-analysis of randomized dose escalation trials [Citation15,Citation16]. The equation was included in the supplementary material S4. Calculations were performed with γ50=0.78 as the slope of the dose-response curve. The uniform dose corresponding to 50% probability of tumor control D50 is calculated by requiring TCP (78 Gy) = 0.80 leading to D50=54 Gy [Citation15,Citation17]. The dose entered in the TCP calculation was the mean dose to PTV_MRI + (the MRI positive PTV in both SV and prostate). Please note that this definition of the target is an important modeling decision; it reflects an ansatz that MRI correctly defines the tumor mass and we investigate the potential benefits of individualized target definition under this ansatz.
Results
For 14 of the 21 patients with evaluable scans MRI positive volumes were detected. For six of these patients, the MRI positive volume in the T2w image was confirmed by both functional scans.
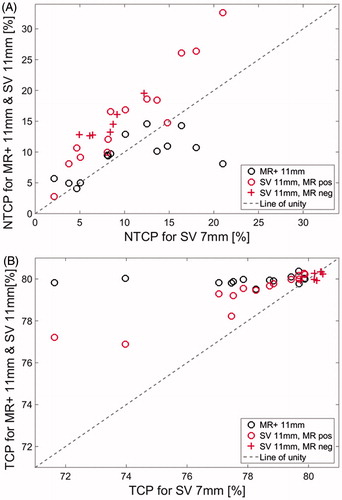
The results showed that TCP for the MR +11 mm plan was significantly higher compared to the SV 7 and SV 11 mm plans with p = .0001 and p = .03, respectively. The median rectal NTCP for the MR +11 mm plans were 10% (4–15%). Comparing rectal NTCP of grade ≥2 for the SV 7 and SV 11 mm plans, including both MRI positive and MRI negative patients, the NTCP of grade ≥2 increased from a median of median 8% (2–21%) to a median of 15% (3–33%). Rectal toxicity NTCP for grade ≥2 was not statistical significantly different (p = .67) between the MR +11 and SV 7 mm plans (). The rectal NTCP for grade ≥2 the SV 11 mm plans were significantly higher compared to the MR +11 mm plans and SV 7 mm plans with p<.001 for both. The results for the bladder NTCP for grade ≥1 are shown in supplementary material S5.
Figure 2. Estimates of the NTCP for rectal toxicity higher than grade 2 (A) and estimated TCP (B). The horizontal axes are the estimates for the plan SV 7 mm. The vertical axes are the estimates of the plan SV 11 mm and MR + 11 mm. See text and supplementary material for details on calculations and plan definitions. Circles and crosses indicate plans for MRI positive and MRI negative patients, respectively. The line of identity is depicted with a slashed line in gray. The rectal NTCP of grade 2 for the SV 7 mm plans were not significantly different from the MR +11 mm plans (p = .76). The TCP for the MR + 11 mm plans were significantly higher compared to the SV 7 and SV 11 mm plans (p ≤ .03)
The MR +11 mm plans had a significantly lower V70Gy and V75Gy for the rectum compared to the SV 11 mm plans of 43 and 46%, respectively (). Comparing MR +11 and SV 7 mm plans there was no statistical difference in the V70Gy and V75Gy for the rectum (p > .3). The MR +11 mm plans had a significantly lower V50Gy to the bladder of 54 and 41% when compared to the SV 11 and SV 7 mm plans, respectively, both with p = .0001.
Table 1. Descriptive dose-volume and plan quality metrics for the three plan types. Values are median (range). The ideal CI and HI values were 1 and 0, respectively. Comparing the high dose volumes for MR +11 and SV 7 mm plans no statistical significance was found for rectum (p>.3) but for the bladder the V50Gy was significantly lower for the MR +11 mm plan (p=.0001). The first three columns are data from MRI positive patients and the last three columns are from MRI negative patients.
No statistical significant difference in homogeneity or conformity was observed between the MRI positive and MRI negative patients. Comparing the different types of plans for the MRI positive patients there was no statistical significant different in HI and CI for MR +11 mm and SV 7 mm, CI was statistically higher for MR +11 mm compared to SV 11 mm plans but HI was not statistically different. Comparison of SV 11 and SV 7 mm showed a statistical higher CI and a statistical lower HI for SV 7 mm.
Discussion
In this study the impact of using MRI for delineation of targets in the SV was investigated. Three treatment strategies were compared: one targeting the MRI positive volumes in SV and prostate with a margin of 11 mm to the MRI positive volume in the SV and two targeting the SV and prostate with margins to the SV of 11 and 7 mm, respectively. We calculated the TCP under the assumption that the MRI positive volume was the crucial part of the SV to target. Under this assumption, we showed that treating MRI positive volumes with appropriate margins could significantly improve the TCP by up to 11% (on average 3%) without a significant increase in rectal NTCP of grade ≥2 compared to the SV 7 mm plans.
The NTCP grade ≥1 for the bladder was calculated and showed a large variability as the NTCP grade ≥1 is modeled with the bladder as a serial organ highly dependent on hotspots. The results of the bladder NTCP grade ≥1 should be interpreted with caution because the model contains large uncertainties originating from a poor relation between dose-volume effects, large deformability and variability in volume [Citation18].
The SV 7 mm plans resembled a clinical plan and were for this work used as a standard when comparing the treatment plans. This approach was chosen as the complete SV typically was not included clinically unless the patient had been clinically staged with SV involvement (stage T3b) where the complete organ would have been included (as explained in the materials and methods section). The clinical staging and the finding of a MRI positive volume in the SV did not agree for all patients (see supplementary material S1) which correspond to studies which have investigated the diagnostic value of DWI and DCE MRI information [Citation9].
The evaluation of TCP on the PTV is an approximation because it is truly the CTV that contains tumor cells. However, the CTV do not include effects of motion during the treatment course but by evaluation of the dose distribution to the PTV we used this as surrogate for the resulting dose distribution to the MRI positive volume. A more accurate TCP could have been estimated if MRI information had been available from every treatment fraction or alternative a simulation of the movement could have been performed similar to [Citation19]. If tumor involvement was present outside of the MRI positive volume, there is a risk of decreased TCP due to the compromise of radiation to other parts of the SV.
Where the NTCP modeling follows conventional arguments, TCP modeling of prostate cancer when compromising part of the target cannot at present be done without simplifying assumptions as applied here. The TCP model used dose-response data from randomized trials and uses mean dose to target as carrier of TCP. Furthermore, the TCP model assumes that the MRI positive regions of the target were indeed the driver of recurrence risk. Consequently, the main risk would be false negative regions of the SV, which should have been targeted and were not penalized by the models. Thus the TCP modeling uncertainty was associated with the uncertainties of MRI defining the cancer as discussed below.
In 6 out of 14 patients, positive volumes were observed in all types of MR images. The functional DWI and DCE MRI has shown great potential for distinguishing malignant from nonmalignant tissue [Citation5,Citation9,Citation20]. Sensitivity and specificity within the prostate has been reported to be above 90% using a 1.5T scanner [Citation21]. In supplementary material S1, the characteristic of the patient group is shown stratified for patients with MRI positive/negative images. For patients with MRI positive images, 5 out of 14 (36%) had two clinical high-risk features and 9 out of 14 (64%) had three high-risk features. Compared to the patients with MRI negative images, 5 out of 7 (71%) and 2 out of 7 (29%) had two and three high-risk features, respectively.
In this study we presupposed that a potential MRI positive volume should be visible in the T2w MRI. The reason for this choice was that the anatomical information in the functional images were limited, for especially the Ktrans maps, and subjected to artifacts, especially the ADC maps, from the implanted seeds and gas in the rectum. The choice was more practical than clinical and improving the registration of the DWI and DCE to the T2w MRI, as has been done for brain targets, would make it more reliable to connect volumes in the functional scans to the anatomical scans and would give rise to extended use of the functional MRI.
In the pelvic area there can be both slow movements and fast transient movements which can be challenging if scans are recorded during such a movement since it is possible that it causes deformations and hence change the anatomy from one MRI sequence to the next. In the calculation of the Ktrans map an auto-registration of the single MR images was performed to correct for movements between images but for some patients with large movements the correction was not sufficient causing an increased uncertainty in the Ktrans map. The ADC maps of some patients had many artifacts in the area of the SV, probably due to gas in the rectum. The registration of the Ktrans and ADC maps to the T2w image was performed manually. We transferred the GTV delineation from the T2w image to the CT for treatment planning by deformable registration. The deformable registration was not able to correct for all changes in anatomy so for several patients the GTV found in the SV of the MRI extended out of the SV delineated in the CT which indeed introduced a systematic error. If volumes outside the prostate should be transferred to the CT, further work should be done on the registration of the different images to increase the precision.
The HI and CI for the SV 7 mm plans compared to the SV 11 mm plans were statistically significantly lower and higher, respectively. However, for the HI and CI for the MR +11 mm plans no statistical difference was seen when comparing to SV 7 mm. This could be a result of RapidPlan was trained with plans similar to the SV 7 mm plans whereas the SV 11 mm plans have a larger PTV giving less distance to OAR and stressing the constraints for tumor coverage and OAR compromise. It is the opposite case for the MR +11 mm plans which had a smaller PTV making it easier for the algorithm to meet the constraints. However, it is possible the dose to the OAR could be reduced further for the MR +11 mm plans since the RapidPlan used the same constraints regardless of the PTV size.
A number of weaknesses and limitations regarding the MR images of this study should be acknowledged. In the study we employed a surface coil. Using an endorectal coil improves the signal-to-noise ratio resulting in higher quality images and possibly better ability to distinguish malignant and nonmalignant tissue [Citation22]. However, an endorectal coil could deform the prostate and SV introducing a systematic error because it is not present at the treatment. Furthermore, it could be hypothesized that using higher field strength for functional MRI could lead to greater sensitivity [Citation23]. However, higher field strength increases the geometric distortion and accuracy in the radiotherapy treatment [Citation23]. In addition to this there is an inter-observer uncertainty in the delineations of the GTVs in the T2w, DWI and DCE MRI as they were performed by one radiation oncologist.
Kerstin et al. suggested that including the most proximal 2 cm of the SV in the CTV would be sufficient to cover the spread of cancerous cells in 99% of all patients. However, they mention that the appropriate dose to be delivered to the SV is not known. For this reason, many institutions have implemented relatively small PTV margins (5–7 mm) with an image-guidance strategy based on prostate markers as opposed to the 11 mm suggested by de Boer et al. as necessary to cover the full extent of the CTV_SV. It should be noted that the most distal part of the SV is more movable and hence requires larger margin [Citation1]. As a cautionary note to this strategy, studies have indicated potential loss of biochemical control in patients with large rectal extend at planning, which could be due to motion aspects [Citation24,Citation25]. While the fiducial marker image guidance will cover the prostate motion of such patients, the above-mentioned margins may be insufficient to include SV which may be particularly problematic if the MRI scans indicate SV involvement.
In this study we showed that when treating prostate cancer patients with risk of SV involvement but target the MRI suspicious volume in the SV with an appropriate margin of 11 mm, the rectal NTCP for grade ≥2 is decreased 34% compared to target the entire SV volume. The TCP increased with up to 11% (on average by 3%) when estimated using the assumption that control depended on the dose coverage of the MRI positive volume with a PTV margin of 11 mm. Though the use of MR images to identify SV involvement needs to be clinically validated, it would provide the possibility to identify patients with SV involvement (intermediate or high-risk patients) directly, instead of relying on a probability based on general clinical features. This would, in turn, enable treating only the involved SV volume using larger margins only in a subset of patients.
IONC_1300684_supplemental_material.zip
Download Zip (1 MB)Acknowledgments
The authors wish to thank radiologist Anne Kiil Berthelsen and radiation oncologist Joen Sveistrup for supporting SD in delineation of the SV.
Disclosure statement
The authors acknowledge support from Varian Medical systems. M. A. acknowledges support from Cancer Research UK [grant no C8225/A21133], as well as core funding from Cancer Research UK, the UK Medical Research Council and the British Heart Foundation to the Oxford University Clinical Trial Service Unit. The funding source has not had any influence on the published data or the decision to publish.
Additional information
Funding
Related Research Data
References
- Kestin LL, Goldstein NS, Vicini FA, et al. Treatment of prostate cancer with radiotherapy: should the entire seminal vesicles be included in the clinical target volume? Int J Radiat Oncol Biol Phys. 2002;54:686–697.
- McPartlin AJ, Li XA, Kershaw LE, et al. MRI-guided prostate adaptive radiotherapy: a systematic review. Radiother Oncol. 2016;119:371–380.
- Boer J, Herk M, Pos FJ, et al. Hybrid registration of prostate and seminal vesicles for image guided radiation therapy. Int J Radiat Oncol Biol Phys. 2012;86:177–182.
- Thörnqvist S, Hysing LB, Zolnay AG, et al. Treatment simulations with a statistical deformable motion model to evaluate margins for multiple targets in radiotherapy for high-risk prostate cancer. Radiother Oncol. 2013;109:344–349.
- Groenendaal G, Borren A, Moman MR, et al. Pathologic validation of a model based on diffusion-weighted imaging and dynamic contrast-enhanced magnetic resonance imaging for tumor delineation in the prostate peripheral zone. Int J Radiat Oncol Biol Phys. 2012;82:537–544.
- Appayya MB, Johnston EW, Punwani S. The role of multi-parametric MRI in loco-regional staging of men diagnosed with early prostate cancer. Curr Opin Urol. 2015;25:510–517.
- Lips IM, van der Heide UA, Haustermans K, et al. Single blind randomized phase III trial to investigate the benefit of a focal lesion ablative microboost in prostate cancer (FLAME-trial): study protocol for a randomized controlled trial. Trials. 2011;12:255.
- Borren A, Groenendaal G, Monan MR, et al. Accurate prostate tumor detection with multiparametric magnetic resonance imaging: dependence on histological properties. Acta Oncol. 2013;53:88–95.
- van der Heide UA, Korporaal JG, Groenendaal G, et al. Functional MRI for tumor delineation in prostate radiation therapy. Imaging Med. 2011;3:219–231.
- Feuvret L, Noel G, Mazeron J, et al. Conformity index: a review. Int J Radiat Oncol Biol Phys. 2006;64:333–342.
- International Commission on Radiation Units and Measurements (ICRU). Report 83: prescribing, recording, and reporting photon-beam intensity-modulated radiation therapy (IMRT). J ICRU 2010;10:1–106.
- Michalski JM, Gay H, Jackson A, et al. Radiation dose-volume effects in radiation-induced rectal injury. Int J Radiat Oncol Biol Phys. 2010;76:123–129.
- Liu M, Moiseenko V, Agranovich A, et al. Normal tissue complication probability (NTCP) modeling of late rectal bleeding following external beam radiotherapy for prostate cancer: a test of the QUANTEC-recommended NTCP model. Acta Oncol. 2010;49:1–10.
- Cheung MR, Tucker SL, Gong L, et al. Investigation of bladder dose and volume factors influencing late urinary toxicity after external beam radiotherapy for prostate cancer. Int J Radiat Oncol Biol Phys. 2007;67:1059–1065.
- Vogelius IR, Bentzen SM. In response to Dr. Williams. Int J Radiat Oncol Biol Phys. 2010;80:639–640.
- Diez P, Vogelius IS, Bentzen SM. A new method for synthesizing radiation dose-response data from multiple trials applied to prostate cancer. Int J Radiat Oncol Biol Phys. 2010;77:1066–1071.
- Sveistrup J, Munck af Rosenschöld P, Deasy JO, et al. Improvement in toxicity in high risk prostate cancer patients treated with image-guided intensity modulated radiotherapy compared to 3D conformal radiotherapy without daily image guidance. Radiat Oncol. 2014;9:44.
- Viswanathan AN, Yorke ED, Marks LB, et al. Radiation dose-volume effects of the urinary bladder. Int J Radiat Oncol Biol Phys. 2010;76:116–122.
- Thörnqvist S, Muren LP, Bentzen L, et al. Degradation of target coverage due to inter-fraction motion during intensity-modulated proton therapy of prostate and elective targets. Acta Oncol. 2013;52:521–527.
- Groenendaal G, van den Berg CAT, Korporaal JG, et al. Simultaneous MRI diffusion and perfusion imaging for tumor delineation in prostate cancer patients. Radiother Oncol. 2010;95:185–190.
- Hara N, Okuizumi M, Koike H, et al. Dynamic contrast-enhanced magnetic resonance imaging (DCE-MRI) is a useful modality for the precise detection and staging of early prostate cancer. Prostate. 2005;62:140–147.
- Ghafoori M, Alavi M, Shakiba M, et al. The value of prostate MRI with endorectal coil in detecting seminal vesicle involvement in patients with prostate cancer. Iran J Radiol. 2015;12:e14556.
- Mazaheri Y, Varga HA, Nyman G, et al. Image artifacts on prostate diffusion-weighted magnetic resonance imaging: trade-offs at 1.5 Tesla and 3.0 Tesla. Acta Radiol. 2013;20:1041–1047.
- Heemsbergen WD, Hoogeman MS, Witte MG, et al. Increased risk of biochemical and clinical failure for prostate patients with a large rectum at radiotherapy planning: results from the Dutch trial of 68 GY versus 78 Gy. Int J Radiat Oncol Biol Phys. 2007;67:1418–1424.
- Engels B, Soete G, Verellen D, et al. Conformal arc radiotherapy for prostate cancer: increased biochemical failure in patients with distended rectum on the planning computed tomogram despite image guidance by implanted markers. Int J Radiat Oncol Biol Phys. 2009;74:388–391.