
Abstract
Purpose: To assess the effect of additional magnetic resonance imaging (MRI) alongside the planning computed tomography (CT) scan on target volume delineation in pancreatic cancer patients.
Material and methods: Eight observers (radiation oncologists) from six institutions delineated the gross tumor volume (GTV) on 3DCT, and internal GTV (iGTV) on 4DCT of four pancreatic cancer patients, while MRI was available in a second window (CT + MRI). Variations in volume, generalized conformity index (CIgen), and overall observer variation, expressed as standard deviation (SD) of the distances between delineated surfaces, were analyzed. CIgen is a measure of overlap of the delineated iGTVs (1 = full overlap, 0 = no overlap). Results were compared with those from an earlier study that assessed the interobserver variation by the same observers on the same patients on CT without MRI (CT-only).
Results: The maximum ratios between delineated volumes within a patient were 6.1 and 22.4 for the GTV (3DCT) and iGTV (4DCT), respectively. The average (root-mean-square) overall observer variations were SD = 0.41 cm (GTV) and SD = 0.73 cm (iGTV). The mean CIgen was 0.36 for GTV and 0.37 for iGTV. When compared to the iGTV delineated on CT-only, the mean volumes of the iGTV on CT + MRI were significantly smaller (32%, Wilcoxon signed-rank, p < .0005). The median volumes of the iGTV on CT + MRI were included for 97% and 92% in the median volumes of the iGTV on CT. Furthermore, CT + MRI showed smaller overall observer variations (root-mean-square SD = 0.59 cm) in six out of eight delineated structures compared to CT-only (root-mean-square SD = 0.72 cm). However, large local observer variations remained close to biliary stents and pathological lymph nodes, indicating issues with instructions and instruction compliance.
Conclusions: The availability of MRI images during target delineation of pancreatic cancer on 3DCT and 4DCT resulted in smaller target volumes and reduced the interobserver variation in six out of eight delineated structures.
Introduction
Radiotherapy for pancreatic cancer aims at delivering a high radiation dose to the tumor while minimizing the dose delivered to the organs at risk (OARs). Several developments have improved the accuracy of radiotherapy of pancreatic cancer. The introduction of intensity modulated radiotherapy and volumetric modulated arc therapy enabled steep dose gradients close to the tumor, reducing the dose to OARs [Citation1]. Also, patient alignment has greatly improved with the introduction of intratumoral fiducial markers combined with daily cone-beam computed tomography (CBCT) [Citation2,Citation3]. Furthermore, motion management has been improved with the introduction of 4D computed tomography (CT) [Citation4] and breath holding [Citation5]. One of the remaining major challenges in radiotherapy for pancreatic cancer patients is precise and accurate target volume definition [Citation6–9].
So far, studies on delineation accuracy investigated delineations on 3DCT in 1–2 patients with 11–25 observers [Citation6–8], except for one recent study in which clinical delineations of 60 patients were compared to a gold standard defined by a team of experts [Citation9]. However, no quantitative information was reported on the interobserver conformity of the delineated volumes, or on local and overall observer variations expressed as standard deviations (SD). Such parameters are especially relevant for determining appropriate planning treatment volume margins [Citation10] and quantifying improvement in interobserver variation after intervention [Citation11]. In an earlier study with eight observers and four patients, we confirmed a substantial interobserver variation when the tumor was delineated on 3DCT and 4DCT based on these parameters [Citation12].
One of the reasons for this considerable interobserver variation may be the poor contrast between pancreatic tumors and the surrounding tissue on CT images. Potentially, magnetic resonance imaging (MRI) provides better tumor visibility [Citation13,Citation14]. For several other organs, MRI has been shown to improve interobserver variation [Citation15–17]. For pancreatic tumors, delineations based on MRI were only studied in single institute studies (1–3 observers), which did not quantify the interobserver variation [Citation18,Citation19]. To our knowledge, no multi-center study that assesses the value of MRI for target volume delineation in pancreatic cancer patients is available.
The aim of this feasibility study was to evaluate the effect of offering MRI alongside the planning CT for delineation of the target volume in pancreatic cancer patients. In this study, we quantify the interobserver variation and compare it to our previously published results [Citation12] on CT-based delineation with the same eight observers and four patients.
Material and methods
In our previous study (CT-only) [Citation12], eight observers (radiation oncologists) from six Dutch institutions participating in the PREOPANC trial [Citation20] delineated target volumes of four pancreatic cancer patients using only diagnostic and planning CTs. In the current study (CT + MRI), we asked the same observers to repeat the delineations for the same patients, now offering a diagnostic MRI alongside the CTs. All CT-only data presented in this paper as comparison come from the earlier study [Citation12].
Patients
The same patients were selected as in the CT-only study [Citation12]. In that study, we selected the first four patients with histologically proven (borderline) resectable pancreatic ductal adenocarcinoma who participated in the PREOPANC (EudraCT number 2012-003181-40) trial [Citation20] (radiochemotherapy arm) and MIPA (NCT01989000) study. The patients gave written informed consent to both studies, which were approved by the local medical ethics committees (PREOPANC: Erasmus Medical Center, Rotterdam; MIPA: Academic Medical Center, Amsterdam).
Imaging
Patients underwent a diagnostic CT, MRI and planning CT examination. The diagnostic CT scans (contrast-enhanced; CE) were acquired as part of standard patient care at the referring hospitals. Experienced abdominal radiologists from our institution reviewed these scans and considered them adequate for diagnostic purposes.
After diagnosis, all patients received three markers (intratumoral golden fiducial markers) that were visible on CT, but not on MRI [Citation2,Citation21]. Furthermore, patients 1–3 received metallic biliary stents, and patient 4 received percutaneous biliary drainage. All were placed after the diagnostic CT, but before the MRI and planning CT.
MRI was performed on an Ingenia 3T scanner (Philips Healthcare, Best, the Netherlands) as part of the MIPA study. Four MRI scans were obtained using various sequences: T1-weighted spoiled gradient echo (T1W GE), CE T1W GE, T2-weighted turbo spin echo (T2W TSE) and diffusion-weighted imaging (DWI) for which the apparent diffusion coefficient map was displayed (examples in ).
Figure 1. Example slices of GTV delineated on 3DCT + MRI (a) or 3DCT-only [Citation12] (b) and iGTV delineated on the Ave-IP using 4DCT + MRI (c) or 4DCT-only [Citation12] (d). The MRI images (e–h) show the manually selected corresponding slice. The apparent diffusion coefficient map from the DWI acquisition is shown (h). T1W: T1-weighted; GE: gradient echo; CE: contrast enhanced; T2W: T2-weighted; TSE: turbo spin echo; DWI: diffusion-weighted imaging.
![Figure 1. Example slices of GTV delineated on 3DCT + MRI (a) or 3DCT-only [Citation12] (b) and iGTV delineated on the Ave-IP using 4DCT + MRI (c) or 4DCT-only [Citation12] (d). The MRI images (e–h) show the manually selected corresponding slice. The apparent diffusion coefficient map from the DWI acquisition is shown (h). T1W: T1-weighted; GE: gradient echo; CE: contrast enhanced; T2W: T2-weighted; TSE: turbo spin echo; DWI: diffusion-weighted imaging.](/cms/asset/a65e5f39-f237-42f7-b37d-2be5bd38dba7/ionc_a_1304654_f0001_c.jpg)
The planning CT scans were acquired at our radiation oncology department on a GE LightSpeed RT 16 scanner (General Electric Company, Waukesha, WI, USA). Two planning CT scans were acquired, a CE 3DCT and a 4DCT. Several image sets were reconstructed from the 4DCT scan: the 10 respiratory phases, average intensity projection (Ave-IP) and maximum intensity projection (MIP). Further details of all scans are discussed in the Supplementary Materials.
Delineation
Observers delineated the gross tumor volume (GTV) on the 3DCT (CE) and the internal GTV (iGTV) on the Ave-IP reconstruction of the 4DCT. The GTV was defined as the macroscopically visible tumor and pathological lymph nodes. The iGTV was defined as the GTV delineated on the Ave-IP reconstruction, extended to encompass the GTV on the 10 respiratory phases of the 4DCT. The current study (CT + MRI), consisted of a 3DCT + MRI and 4DCT + MRI stage, in which the GTV and iGTV, respectively, were delineated under the guidance of MRI. The results were compared to the results from the 3DCT-only and 4DCT-only stages of the CT-only study [Citation12]. For both studies, observers received the same instructions on what to delineate, taken from the PREOPANC trial [Citation20].
In both studies, observers received the Big Brother software [Citation22]. The software showed a primary window, in which the iGTV was delineated, and a secondary window that could display selected other available images (). When viewed in the secondary window, the displayed slice from the 3DCT and 4DCT image and cursor position was linked to the primary window (i.e., same slice and a dot indicating cursor position). Furthermore, observers had access to the radiology reports of the diagnostic CT and, in the CT + MRI study, the radiology reports of the MRI. These reports, from experienced abdominal radiologists, described the tumor extent. For the CT report, the associated pathological lymph nodes were also described: two suspicious locoregional lymph nodes in patient 2; ‘some’ (cited) enlarged lymph nodes in patient 4, which were not characterized further.
Table 1. Overview of the images.
First, the software for the CT-only study was sent to all observers. Four weeks after an observer returned their CT-only delineations, that observer received a PowerPoint document. In this document, the visibility of pancreatic tumors on the abovementioned MRI scans was discussed for nine pancreatic cancer patients (different from those included in this study). Observers received the software for the CT + MRI study at least six weeks after returning their CT-only delineations. During delineation, the diagnostic CT and MRI were not registered to the planning CT. As the pancreas and other abdominal organs had deformed between the three image sessions, a deformable registration would be required. The use of deformable image registration for this purpose is not widely validated. Therefore, we chose not to register the images.
CT + MRI
The analyses were performed using the Big Brother software [Citation22]. A resident radiation oncologist (EV) visually assessed the individually delineated iGTVs. She counted the number of observers who included the stents/drain, markers and pathological lymph nodes in the delineated volume. The average volume of the iGTVs, and generalized conformity index (CIgen) [Citation23] per patient was calculated with the Big Brother software. CIgen is the sum over all observer pairs of their common volume (delineated by both observers), divided by the sum over all observer pairs of their encompassing volumes (delineated by at least one observer). CIgen is a measure of overlap of the iGTVs (1 = full overlap, 0 = no overlap). A median surface was defined using Big Brother. This surface was the 3D closed surface comprising the volume that was included in the iGTV by at least 50% of the observers. The median surface was sampled with approximately equidistant (0.5 mm) points. For each point, the perpendicular distances from the median surface to the surfaces of the eight individually delineated iGTVs were measured. If the surface of a delineated iGTV was not within 2 cm, the distance to the closest point on that surface was used instead. The SD over these eight distances was used as a measure of local observer variation (local SD). The overall observer variation (overall SD) was defined as the root-mean-square of all local SDs [Citation22]. Average overall SDs were calculated as root-mean-square over all patients. To assess the dependence of the CIgen and overall SD on individual observers, we reported the range of values in a leave-one-out analysis. In this approach, the analyses were repeated eight times, successively leaving out one of the observers.
Comparison of CT + MRI with CT-only
The results were compared to results from the CT-only study [Citation12]. All statistical analyses were performed using SPSS (version 22.0.0.2, IBM, New York, NY, USA). Plots were made with GraphPad Prism (version 5.00, GraphPad Software, San Diego, CA, USA). To test for differences in mean delineated target volumes, CIgen and mean overall SD, we used a two-sided Wilcoxon signed-rank test between the CT-only and CT + MRI studies (significance level α = 0.05). Histograms of the local SDs per patient were compared between the CT-only study and CT + MRI study. Finally, we compared the 3D median surfaces from both studies and calculated for each median surface from the CT-only study the percent of the volume surrounded by the median surface of the CT + MRI study and vice versa.
Results
Observers had on average 10.6 years (range 3–17 years) of experience in radiotherapy. Observer 4 (12 years of experience in radiotherapy) only just started treating pancreatic cancer. The remaining seven had an average of 5.4 years (range 2–12.5 years) of experience treating pancreatic cancer. These observers saw an average of 3.5 pancreatic cancer patients (range 1–7.5 patients) per year. All observers had experience with MRI in radiotherapy, and four had experience with MRI for pancreatic cancer.
CT + MRI
The maximum ratio between delineated target volumes within one patient was 6.1 for 3DCT + MRI and 22.4 for 4DCT + MRI (). The mean CIgen was 0.36 for 3DCT + MRI and 0.31 for 4DCT + MRI (). The mean (root-mean-square over all patients) overall observer variation expressed by overall SD was 0.41 cm for 3DCT + MRI and 0.73 cm for 4DCT + MRI. Despite the instructions that pathological lymph nodes should be included in the iGTV, the different lymph nodes were only delineated by 1–4 (range) out of eight observers (Supplemental Table B.I). Furthermore, the iGTVs showed large variations close to stents/drain, in particular in patient 3 in whom four out of eight observers included the stent for 4DCT + MRI and five out of eight for 4DCT + MRI (Supplemental Table B.II).
Table 2. Average volume, CIgen, and overall observer variation.
Comparison of CT + MRI with CT-only
Delineated iGTVs were 32% smaller when based on CT + MRI compared to CT-only (p < .0005, Z = −3.826, and ). There was no significant difference in mean CIgen between the CT + MRI study (CIgen = 0.34) and CT-only study (CIgen = 0.32; p = .844, Z = −0.280). The mean overall observer variation was not significantly smaller in the CT + MRI study (root-mean-square overall SD = 0.59 cm) than in the CT-only study (0.72 cm; p = .078, Z = −1.820). However, they were smaller in six out of eight delineated structures (three out of four GTVs, three out of four iGTVs).
Figure 2. Scatter plots of the volume of the delineated iGTV on 3DCT + MRI (a), 4DCT + MRI (b), 3DCT-only (c) and 4DCT-only (d) per patient per observer. Median and interquartile ranges are indicated. Observer colors in the online article correspond to Figure 1(a–d). Graphs (c) and (d) are from Versteijne et al. [Citation12].
![Figure 2. Scatter plots of the volume of the delineated iGTV on 3DCT + MRI (a), 4DCT + MRI (b), 3DCT-only (c) and 4DCT-only (d) per patient per observer. Median and interquartile ranges are indicated. Observer colors in the online article correspond to Figure 1(a–d). Graphs (c) and (d) are from Versteijne et al. [Citation12].](/cms/asset/b0a5365a-311a-4408-a8c9-25896cc12ecb/ionc_a_1304654_f0002_c.jpg)
Making MRI available decreased the local observer variation particularly in regions that had a large (>1 cm) local SD in the CT-only study (). The histograms of local SD reflect this effect (Supplemental Figure C1). These histograms show shorter tails at high local SD for CT + MRI compared to CT-only, especially for the GTV of patients 1 and 2, and the iGTV of patients 3 and 4.
Figure 3. The local observer variation (local SD) projected on the median surfaces of the iGTV for 3DCT + MRI (a), 3DCT-only (b), 4DCT + MRI (c) and 4DCT-only (d). Colors correlate to the local SD, with white (online: red) indicating local SD ≥9.4 mm. Volumes are viewed posterior of the patient (dummy). Note that for patient 2, the portocaval lymph node was included in b–d. Figures b and d are from Versteijne et al. [Citation12].
![Figure 3. The local observer variation (local SD) projected on the median surfaces of the iGTV for 3DCT + MRI (a), 3DCT-only (b), 4DCT + MRI (c) and 4DCT-only (d). Colors correlate to the local SD, with white (online: red) indicating local SD ≥9.4 mm. Volumes are viewed posterior of the patient (dummy). Note that for patient 2, the portocaval lymph node was included in b–d. Figures b and d are from Versteijne et al. [Citation12].](/cms/asset/3c2de50b-4e2d-4ec7-9eae-c02c86fb174d/ionc_a_1304654_f0003_c.jpg)
The median delineated surfaces of the iGTV of patient 2 each consisted of two separate volumes (except during the 3DCT + MRI stage), one encompassing the main tumor and one encompassing a suspicious portocaval lymph node (). As only 4–5 observers delineated this lymph node (Supplemental Table B.I), the local observer variation was large for that part of the median surface (, patient 2: local SD >1 cm). Excluding this lymph node from the median surface resulted in an overall SD = 0.72 cm (leave-one-out range: 0.50–0.75 cm) in the 3DCT-only stage, 0.86 cm (0.44–0.91 cm) in the 4DCT + MRI stage and 0.49 cm (0.37–0.51 cm) in the 4DCT-only stage.
The median surfaces from the CT + MRI study were on average for 97% and 92% included within the median surfaces of the CT-only study for the GTV (3DCT) and iGTV (4DCT), respectively (). Vice versa, the median surfaces from the CT-only study were for 56% and 64% included within the median surface of the CT + MRI study.
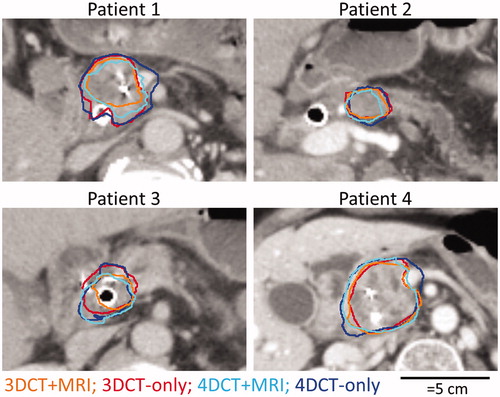
Figure 4. For each patient, median surfaces for CT + MRI study (orange and light blue in the online version) and the CT-only study (red and dark blue in the online version) are shown.
The number of observers who delineated a specific lymph node only varied by a maximum of one observer between the two studies (Supplemental Table B.I). An exception was the portocaval lymph node in patient 2, which was delineated by two observers in the 3DCT + MRI stage, instead of 4–5 observers in all other stages. There was a poor agreement in all stages on whether to include stents/drains in the iGTV (Supplemental Table B.II). There was a small difference ( < 17% for all patients) between the CT + MRI study and CT-only study in the percentage of markers included in the iGTV (Supplemental Table B.III), except in patient 3. In patient 3, the markers were less often included for CT + MRI than for CT-only delineations.
Discussion
We are the first to study the effect of offering MRI alongside the planning CT for delineation of pancreatic tumors in a multi-center setting. When MRI was available, the precision, represented by the overall SD, improved in six out of eight delineated structures. Furthermore, the volumes of the iGTV decreased significantly. The overlap of delineated iGTV, represented by CIgen, remained similar, despite the smaller volumes. These findings suggest an extra value of adding MRI for pancreatic tumor delineation. However, even with MRI the observer variations were large compared to other organs, and in the future better education, more elaborate delineation instructions and better instruction compliance are required to further improve delineations.
In our study, as well as in other studies [Citation18,Citation19], delineated target volumes in pancreatic cancer patients were smaller when (partially) based on MRI than when based on CT-only. Similar findings have been reported for other types of cancer [Citation15,Citation16]. There are two possible causes for this decrease in volume. The tumor volume size could be overestimated on CT due to poor tumor contrast and uncertain tumor boundaries. Furthermore, tumor size could be underestimated on (CT+MRI). Therefore, appropriate clinical target volume (CTV) margins should be determined.
We assessed the number of interactions done in Big Brother with the various MRI sequences and found that observers focused on the CE T1W GE (results not shown). In one study [Citation24], pancreatic tumor sizes were underestimated when assessed on CE MRI. In a different study [Citation18], it was shown that delineations of pancreatic cancer tumors on MRI were larger when based on DWI than when based on CE T1W GE images. Future protocol instructions for MRI-based tumor delineation should be developed taking into account these issues. In addition, detailed education for observers on what the different MRI sequences visualize may stimulate the use of the other sequences being offered and hence further improve delineations.
The addition of MRI mainly decreased the local SD in regions that had large local observer variation (local SD >1 cm). The fact that less decrease was seen in other regions of low local observer variation could be a result of the MRI images not being registered to the planning CT images. Translating the MRI information to the CT images may be challenging for the observers. Potentially, registration of the CT and MRI images decreases the overall observer variation further.
Clear instructions and consensus on what to delineate decreases interobserver variation, as was shown in various organs [Citation11]. In our study, no specific instructions on whether to include stents/drains into the iGTV were given. The large variation on including stents suggests the necessity of such instructions. Our delineation instructions did state that pathological lymph nodes should be included in the iGTVs. The large variation concerning the inclusion of lymph nodes in the iGTV suggests that observer compliance is also important. As these confusions affected both the CT-only and CT + MRI studies (Supplemental Tables B.I–B.III), we believe they did not influence the comparison between the CT-only and CT + MRI delineations.
Several limitations were associated with this paper. Due to the relatively large amount of pancreatic tumor delineations done (four patients, four times) in a relatively short time, observers may have improved their skills between both studies. Furthermore, despite the gap of at least six weeks between both studies, observers may have recognized patients during the CT + MRI study. Both factors could result in smaller observer variation for CT + MRI. Furthermore, the MRI was not obtained as part of the radiotherapy treatment. When MRI is obtained for radiation treatment, different settings or sequences may be preferred with higher resolutions, such as e.g., alternating repetition time balanced steady-state free precession imaging, as alternative for T2W TSE [Citation25].
Similar to findings for other organs [Citation15–17], we found that the overall observer variation decreased when MRI was available during delineation. Consequently, potentially smaller planning treatment volume margins can be used for CT + MRI delineations than for CT-only delineations. However, due to the exploratory nature of this research, the overall SD was based on a small patient group and, therefore, does not necessarily represent typical overall SDs for the pancreatic cancer patient population. This study should be repeated using more patients to quantify treatment margins.
In conclusion, this exploratory study demonstrates the feasibility of adding MRI during treatment planning. The availability of MRI images to CT during target volume delineation for pancreatic cancer improved (decreased) the overall observer variation for six out of eight structures and resulted in smaller delineated volumes compared to CT-only delineation. Yet, large local observer variations existed close to the biliary stent and/or pathological lymph nodes, indicating issues with instructions and instruction compliance.
IONC_1304654_Supplementary_materials.pdf
Download PDF (321.5 KB)Acknowledgments
The authors would like to thank Karen Neelis (Leiden University Medical Center, Leiden), Gati Ebrahimi (Academic Medical Center, Amsterdam), Jeroen Buijsen (MAASTRO clinic, Maastricht) and M. Willemijn Kolff (Academic Medical Center, Amsterdam) for their contribution as observer in this study.
Disclosure statement
Dr A. Bel does consultancy work for Elekta and is the project leader of several Elekta-sponsored projects outside of this work. Professor J. Stoker has a research consultancy for MRI in Crohn’s disease with Robarts Clinical Trials.
Additional information
Funding
Related Research Data
References
- Yovino S, Poppe M, Jabbour S, et al. Intensity-modulated radiation therapy significantly improves acute gastrointestinal toxicity in pancreatic and ampullary cancers. Int J Radiat Oncol Biol Phys. 2011;79:158–162.
- van der Horst A, Wognum S, Dávila Fajardo R, et al. Interfractional position variation of pancreatic tumors quantified using intratumoral fiducial markers and daily cone beam computed tomography. Int J Radiat Oncol Biol Phys. 2013;87:202–208.
- van der Horst A, Lens E, Wognum S, et al. Limited role for biliary stent as surrogate fiducial marker in pancreatic cancer: stent and intratumoral fiducials compared. Int J Radiat Oncol Biol Phys. 2014;89:641–648.
- Keall PJ, Starkschall G, Shukla H, et al. Acquiring 4D thoracic CT scans using a multislice helical method. Phys Med Biol. 2004;49:2053–2067.
- Lens E, van der Horst A, Kroon PS, et al. Differences in respiratory-induced pancreatic tumor motion between 4D treatment planning CT and daily cone beam CT, measured using intratumoral fiducials. Acta Oncol. 2014;53:1257–1264.
- Caravatta L, Macchia G, Mattiucci GC, et al. Inter-observer variability of clinical target volume delineation in radiotherapy treatment of pancreatic cancer: a multi-institutional contouring experience. Radiat Oncol. 2014;9:198.
- Yamazaki H, Nishiyama K, Tanaka E, et al. Dummy run for a phase II multi-institute trial of chemoradiotherapy for unresectable pancreatic cancer: inter-observer variance in contour delineation. Anticancer Res. 2007;27:2965–2971.
- Fokas E, Clifford C, Spezi E, et al. Comparison of investigator-delineated gross tumor volumes and quality assurance in pancreatic cancer: analysis of the pretrial benchmark case for the SCALOP trial. Radiother Oncol. 2015;117:432–437.
- Fokas E, Spezi E, Patel N, et al. Comparison of investigator-delineated gross tumour volumes and quality assurance in pancreatic cancer: analysis of the on-trial cases for the SCALOP trial. Radiother Oncol. 2016;120:212–216.
- van Herk M. Errors and margins in radiotherapy. Semin Radiat Oncol. 2004;14:52–64.
- Rasch CRN, Steenbakkers RJHM, Fitton I, et al. Decreased 3D observer variation with matched CT-MRI, for target delineation in nasopharynx cancer. Radiat Oncol. 2010;5:21.
- Versteijne E, Gurney-Champion OJ, van der Horst A, et al. Considerable interobserver variation in delineation of pancreatic cancer on 3DCT and 4DCT: a multi-institutional study. Radiat Oncol. 2017;12:58.
- Andreychenko A, Heerkens H, Meijer G, et al. SU-E-J-07: a functional MR protocol for the pancreatic tumor delineation. Med Phys. 2014;41:155–156.
- Barral M, Taouli B, Guiu B, et al. Diffusion-weighted MR imaging of the pancreas: current status and recommendations. Radiology. 2015;274:45–63.
- Rasch C, Keus R, Pameijer FA, et al. The potential impact of CT-MRI matching on tumor volume delineation in advanced head and neck cancer. Int J Radiat Oncol Biol Phys. 1997;39:841–848.
- Rasch C, Barillot I, Remeijer P, et al. Definition of the prostate in CT and MRI: a multi-observer study. Int J Radiat Oncol Biol Phys. 1999;43:57–66.
- den Hartogh MD, Philippens MEP, van Dam IE, et al. MRI and CT imaging for preoperative target volume delineation in breast-conserving therapy. Radiat Oncol. 2014;9:63.
- Dalah E, Moraru I, Paulson E, et al. Variability of target and normal structure delineation using multimodality imaging for radiation therapy of pancreatic cancer. Int J Radiat Oncol Biol Phys. 2014;89:633–640.
- Li J, Denniston KA, Hussain SM, et al. Comparison of CT and MRI-based gross tumor volume and organ at risk delineation for pancreatic cancer patients undergoing neoadjuvant stereotactic body radiation therapy. Int J Radiat Oncol. 2014;90:S356.
- Versteijne E, van Eijck CHJ, Punt CJA, et al. Preoperative radiochemotherapy versus immediate surgery for resectable and borderline resectable pancreatic cancer (PREOPANC trial): study protocol for a multicentre randomized controlled trial. Trials. 2016;17:127.
- Gurney-Champion OJ, Lens E, van der Horst A, et al. Visibility and artifacts of gold fiducial markers used for image guided radiation therapy of pancreatic cancer on MRI. Med Phys. 2015;42:2638–2647.
- Steenbakkers RJHM, Duppen JC, Fitton I, et al. Observer variation in target volume delineation of lung cancer related to radiation oncologist-computer interaction: a ‘Big Brother’ evaluation. Radiother Oncol. 2005;77:182–190.
- Kouwenhoven E, Giezen M, Struikmans H. Measuring the similarity of target volume delineations independent of the number of observers. Phys Med Biol. 2009;54:2863–2873.
- Hall WA, Mikell JL, Mittal P, et al. Tumor size on abdominal MRI versus pathologic specimen in resected pancreatic adenocarcinoma: implications for radiation treatment planning. Int J Radiat Oncol Biol Phys. 2013;86:102–107.
- Gurney-Champion OJ, Nederveen AJ, Klaassen R, et al. Revisiting the potential of alternating repetition time balanced steady-state free precession imaging of the abdomen at 3 T. Invest Radiol. 2016;51:560–568.