
Introduction
For the first time in history, curing cancer with radiotherapy and restoring health in the cancer survivor seem to be realistic goals for tumors in the pelvic cavity. The risk of radiation-induced long-term effects that decrease quality of life is low for postoperative radiation of the breast [Citation1]. This success rests on scientific achievements made possible by computerized tomography imaging systems and computerized treatment planning systems along with the development of modern linear accelerators administering ionizing radiation. The scientific achievements were implemented into treatment planning and the delivery of ionizing radiation. With the arrival of multileaf collimators and Intensity-Modulated Radiation Therapy techniques such as Volumetric Arc Therapy, it appears possible that our level of ambition can be increased to reach a similar level of risk for irradiation of tumors in the pelvic cavity as for tumors in the breast. What kind of scientific knowledge do we need to move forward to achieve that? Does the new technology require a refined clinical science being necessary to reach our ultimate goal? We want to deliver ionizing irradiation in a way that eliminates the tumor cells and at the same time allows the surrounding normal tissue to recover in such a way that the organs in the pelvic cavity regain their normal functioning.
An important part of the scientific groundwork that builds the backbone of modern radiotherapy was done during the 1960s and 1970s. In 1971, Kirk et al. [Citation2] presented a formula for calculating the biological effects on normal tissue, effects designated as the cumulative radiation effect (CRE). Their work was an effort to understand the results by Ellis and coworkers, to make an extended use of results concerning skin sensitivity and implement these in clinical practice [Citation3,Citation4]. In refining the formulas, our arsenal has been enriched with approaches that also take into account injured cells (Biological Effective Dose, BED) [Citation5,Citation6]. Moreover, discussing whether an organ has a ‘serial’ or ‘parallel’ organization can be regarded as attempts to build in an understanding of the pathophysiology that the radiation triggers. Probably a fruitful way forward would be to continue on that line of thinking and develop a modern radiophysiology based on empirical results of tissue reactions on the physiological level.
As we learn more and more about the tumor–stroma interactions, we understand that these physiological dynamics of the tumor must be accounted for when we predict cure rates. Likewise, we have a plethora of interactions at the physiological level that we may incorporate into modern radiophysiology to understand normal-tissue [Citation7]. We have a rapid knowledge growth concerning the normal physiology of the gut wall and its interaction with the gut microbiota. The gut wall gets its energy, and some nutrients, from the gut microbiota. Many receptors in the gut wall respond to substances produced by bacteria in the microbiota [Citation8]. When we understand better the interplay between these receptors, their dependence on the function and composition of the gut microbiota, the bacterial production of the fatty acids that nurture the endothelial cells in the gut wall, and the retained capacity of crypt stem cells after having received ionizing radiation, we can most likely improve our means of delivering radiotherapy.
Methods
For more than 10 years, we have been developing a methodology to irradiate juvenile mouse brain with a small field [Citation9]. To be able to understand better the radiation-induced changes in the bowel, we transferred this technology to irradiate about 1.5 cm of the distal end of the bowel in C57Bl/6 mice. Being able to use a linear accelerator (Varian Clinac 600 CD) during a weekend we delivered two, three or four fractions of 6 Gy in the first experiment. Humans undergoing radiotherapy typically receive one fraction per day, however, the cell cycle of dividing mouse colon crypt cells is several times faster compared to human colon crypt cells [Citation10]. We thus spaced the fractions by 12 hours, which according to current evidence provides enough time for sub-lethal DNA damage repair in surviving mouse stem cells [Citation11]. To lessen the risk that anesthesia would confound the comparisons we make, all animals (irradiated and sham-irradiated) were anesthetized the same number of times with similar intervals. Since the mice appeared healthy throughout the duration of the experiment (six weeks), we performed a second, identical experiment but with a higher dose of 8 Gy per fraction. Six weeks after the irradiation we sacrificed the mice, removed seven mm of the distal bowel and fixed the tissue in Histofix before embedding in paraffin. To clearly visualize the crypts, the specimens were sectioned in 4 μm thin transverse sections and stained with Neutral Fast Red (cell nuclei) and Alcian Blue (goblet cells). Using a Leica DMi6000 microscope, all clearly degenerated crypts in six sections 72 μm apart were counted per subject. The Kruskal–Wallis test was used to determine if the frequency of degenerated crypts differed between a specific group of irradiated mice and sham-irradiated mice.
The BED was calculated as follows:
where n is the number of fractions, and d is the dose per fraction. The ratio of α over β is equal to a dose α/β, where the linear and quadratic components of cell killing are equal.
Results
We irradiated 24 mice with 6 Gy fractions and 24 mice with 8 Gy fractions. For one mice receiving two fractions of 8 Gy, the tissue could not be used. The picture in shows a typical degenerating crypt. Besides the dilated appearance of these crypts, few or no cells in the crypt walls stained for the proliferation marker Ki67 () [Citation12], while adjacent crypts displayed an abundance of ki67-positive cells. The lack of proliferating cells indicates that the dilated crypts were indeed degenerating, and not in the process of regenerating.
Figure 1. (A) The number of degenerating crypts in six analyzed colorectal circumferences per subject in the 6 Gy cohort. (B) The number of degenerating crypts in six analyzed colorectal circumferences per subject in the 8 Gy cohort. (C) Mucosa stained with Nuclear Fast Red for nuclei, and Alcian Blue for goblet cells six weeks after four fractions of 8 Gy. A degenerating crypt, depicted with an asterisk, is flanked by seemingly healthy crypts (arrow). (D) A magnification of the degenerating crypt in (C), showing a top-to-bottom degenerative progress, as the crypt wall and a few goblet cells are still visible at the base of the crypt (arrow). (E) DAB-stain of ki67-positive proliferating cells. No labeled cells are visible in the degenerated crypt (asterisk), while multiple darkly stained ki67-positive nuclei are visible in a nearby crypt (arrows). Data presented as number of degenerating crypts in six circumferences per subject ± SEM: 6 Gy cohort; SHAM-IRR = 0.00 ± 0.00, IRR 2 × 6 Gy = 0.00 ± 0.00, IRR 3 × 6 Gy = 0.5 ± 0.33, IRR 4 × 6 Gy = 5.5 ± 1.24. 8 Gy cohort; SHAM-IRR = 0.00 ± 0.00, IRR 2 × 8 Gy = 0.71 ± 0.36, IRR 3 × 8Gy = 0.63 ± 0.42, IRR 4 × 8 Gy = 11.3 ± 2.09. Statistical analysis was performed using the nonparametric Kruskal–Wallis. Scale bar = 50 μm.
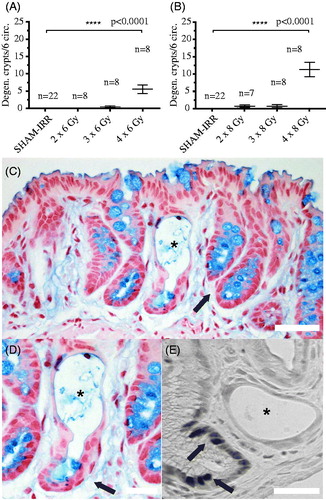
No degenerating crypts were found in the large group of non-irradiated control animals (SHAM-IRR, n = 44). No or few degenerated crypts were found in the animals that had received two fractions of 6 or 8 Gy. Unexpectedly, mice that had received three times 8 Gy, corresponding to a BED of 88.0 Gy3 (, α/β = 3, late-tissue reaction), displayed very few degenerating crypts. In stark contrast, mice that had received four times 6 Gy, corresponding to a somewhat smaller BED of 72.0 Gy3, displayed a high occurrence of degenerating crypts (); 4 × 6 Gy versus 3 × 8 Gy). For this outcome, data indicate the real-life biological effect (formation of degenerated crypts) of 24 Gy (physical dose) given in three fractions is less than the real-life biological effect of 24 Gy given in four fractions. Not until the fourth 8-Gy fraction was delivered, corresponding to a BED of 117.3 Gy3, did we see numerous degenerating crypts in the 8 Gy cohort. The three fractions were delivered during 24 hours and the four during 36 hours.
Table 1. Biological effective doses (BED) and physical doses for different fractionation schedules.
Discussion
Our data suggest a threshold for crypt degeneration that is dependent on the number of fractions, rather than on a calculated dose of the biological effect (for example, calculated as BED). Duration of the radiotherapy may also be of importance. One may speculate a factor besides the fractionation could confound the results. We believe it is unlikely such a factor exits which significantly influence the results. Staff, materials and logistical means (including tissue handling and histochemistry) were by and large identical between the two experiments. We do not know if the duration of the radiotherapy or the number of fractions determines the diverging effects; it may be crucial to account for the overall treatment time in our prediction models. Moreover, information on if chemotherapy was given or not may also be important. More data are needed before we can conclude if the number of fractions, or duration of radiotherapy, in a similar setting predicts the outcome better than a calculated BED (with current means).
One explanation for our results may be that each fraction, if the dose is high enough, gives hypoxia. At the fourth fraction, the capacity of the tissue to compensate, for example, by angiogenesis, is exhausted. Hypoxia remains a fact, triggering an ischemia that ultimately leads to degrading crypts (possibly enhanced inflammatory or fibrotic processes that to some part may be facilitated by bacteria migrating through disrupted tight junctions). Another explanation may be that the fourth fraction eliminates the last stem cell in some crypts, starting degradation. If our results can be corroborated, we have a finding that challenges us to find better prediction models for the real-life biological effects on normal tissue than we have today. Models within a modern radiophysiology.
Acknowledgments
The authors would like to thank Dr John Swanpalmer for dosimetric calculations, and B. Sc. Rita Grandér for her excellent technical expertise.
Disclosure statement
The authors report no conflicts of interest. The authors alone are responsible for the content and writing of this article.
Additional information
Funding
References
- Lundstedt D, Gustafsson M, Malmstrom P, et al. Symptoms 10–17 years after breast cancer radiotherapy data from the randomised SWEBCG91-RT trial. Radiother Oncol: J Eur Soc Ther Radiol Oncol. 2010;97:281–287.
- Kirk J, Gray WM, Watson ER. Cumulative radiation effect. I. Fractionated treatment regimes. Clin Radiol. 1971;22:145–155.
- Ellis F. Dose, time and fractionation: a clinical hypothesis. Clin Radiol. 1969;20:1–7.
- Turesson I, Notter G. Control of dose administered once a week and three times a day according to schedules calculated by the CRE formula, using skin reaction as a biological parameter. Radiology. 1976;120:399–404.
- Jones B, Dale RG, Deehan C, et al. The role of biologically effective dose (BED) in clinical oncology. Clin Oncol (R Coll Radiol). 2001;13:71–81.
- Barendsen GW. Dose fractionation, dose rate and iso-effect relationships for normal tissue responses. Int J Radiat Oncol Biol Phys. 1982;8:1981–1997.
- Ferreira MR, Muls A, Dearnaley DP, et al. Microbiota and radiation-induced bowel toxicity: lessons from inflammatory bowel disease for the radiation oncologist. Lancet Oncol. 2014;15:e139–e147.
- Tremaroli V, Backhed F. Functional interactions between the gut microbiota and host metabolism. Nature. 2012;489:242–249.
- Fukuda H, Fukuda A, Zhu C, et al. Irradiation-induced progenitor cell death in the developing brain is resistant to erythropoietin treatment and caspase inhibition. Cell Death Differ. 2004;11:1166–1178.
- Potten CS. Radiation, the ideal cytotoxic agent for studying the cell biology of tissues such as the small intestine. Radiat Res. 2004;161:123–136.
- Cai WB, Roberts SA, Potten CS. The number of clonogenic cells in crypts in three regions of murine large intestine. Int J Radiat Biol. 1997;71:573–579.
- Gerdes J, Li L, Schlueter C, et al. Immunobiochemical and molecular biologic characterization of the cell proliferation-associated nuclear antigen that is defined by monoclonal antibody Ki-67. Am J Pathol. 1991;138:867–873.
- Followill DS, Kester D, Travis EL. Histological changes in mouse colon after single- and split-dose irradiation. Radiat Res. 1993;136:280–288.