
Abstract
Background: For tumours near organs at risk, there is concern about unintended increase in biological dose from elevated linear energy transfer (LET) at the distal end of treatment fields. The objective of this study was therefore to investigate how different paediatric posterior fossa tumour locations impact LET and biological dose to the brainstem during intensity-modulated proton therapy (IMPT).
Material and methods: Multiple IMPT plans were generated for four different simulated tumour locations relative to the brainstem for a five-year-old male patient. A prescribed dose of 59.4 Gy(RBE) was applied to the planning target volumes (PTVs). Plans with two lateral and one posterior non-coplanar fields were created, along with plans with modified field arrangements. The dose-averaged LET (LETd) and the physical dose × RBELET (D × RBELET), where RBELET=1+c × LETd, were calculated using the FLUKA Monte Carlo code. A scaling parameter c was applied to make the RBELET represent variations in the biological effect due to LET.
Results: High LETd values surrounded parts of the PTV and encompassed portions of the brainstem. Mean LETd values in the brainstem were 3.2–6.6 keV/μm. The highest absolute brainstem LETd values were seen with the tumour located most distant from the brainstem, whereas lower and more homogeneous LETd values were seen when the tumour invaded the brainstem. In contrast, the highest mean D × RBELET values were found in the latter case (54.0 Gy(RBE)), while the case with largest distance between tumour and brainstem had a mean D × RBELET of 1.8 Gy(RBE).
Conclusions: Using IMPT to treat posterior fossa tumours may result in high LETd values within the brainstem, particularly if the tumour volume is separated from the brainstem. However, the D × RBELET was greater for tumours that approached or invaded the brainstem. Changing field angles showed a reduction of LETd and D × RBELET in the brainstem.
Introduction
Irradiating tumours in the posterior fossa may lead to brainstem injury, an infrequent but potentially devastating condition, especially for paediatric patients [Citation1]. The brainstem controls many vital functions, such as respiration, consciousness and heartbeat [Citation2]. In long-term survivors, brainstem radiation toxicity can reduce the quality of life due to defects in essential functions such as motor and sensory capabilities [Citation3]. Ependymomas occur most commonly in young children and approximately two thirds originate in the posterior fossa [Citation4]. Thus, children with ependymomas are at particular risk of brainstem injury [Citation5].
For brain tumours, proton therapy results in superior radiation dose distributions compared to photon therapy, with considerable reduction in doses to the surrounding normal tissue [Citation6]. This property can be beneficial, in particular for tumours near the brainstem [Citation7]. Protons also have a greater biological effect compared to conventional photon therapy, which is accounted for clinically by using a generic relative biological effectiveness (RBE) of 1.1 [Citation8]. It is, however, widely known that the linear energy transfer (LET) amplifies at the distal end of a proton beam and that the RBE increases with increasing LET [Citation9,Citation10]. Intensity-modulated proton therapy (IMPT) plans are currently optimised using dose/volume constraints for the brainstem, but there is concern about the clinical consequences of the elevated LET surrounding tumour volumes and potentially within adjacent organs at risk. A recent paper by Peeler et al. provided clinical evidence of biological changes in brain tissue related to elevated LET [Citation11]. For posterior fossa tumours invading or in proximity to the brainstem, the higher LET may therefore result in an unintended increased biological dose to the brainstem.
Giantsoudi et al. have previously investigated different treatment planning techniques in passive scattering proton therapy for paediatric posterior fossa tumours [Citation12]. Furthermore, Unkelbach et al. have demonstrated the feasibility of LET sparing for critical organs near target volumes [Citation13], while Bassler et al. earlier showed the theoretical ability to increase LET in tumours to achieve more effective cell kill [Citation14,Citation15]. More knowledge on the variations of LET with tumour location and field arrangement could improve IMPT plans for brain tumours and help optimise plans also based on LET or biological dose constraints. The objective of this study was therefore to investigate how various posterior fossa tumour locations, in addition to various treatment field arrangements, may impact the LET and biological dose distributions in the brainstem when treating with IMPT.
Material and methods
Patient material and treatment planning
Computed tomography (CT) and magnetic resonance (MR) images from a five-year-old male patient with a posterior fossa tumour were used for treatment planning and contouring. The contoured structures, including organs at risk and target volumes, were from an actual patient diagnosed with ependymoma. In order to systematically study the influence of distance between tumour location and brainstem, the planning target volume (PTV) (29 cm3) was subsequently shifted to simulate different posterior fossa tumour locations relative to the brainstem; full overlap between tumour and brainstem (FO), half overlap (HO), juxtaposed posterior (JP) and 1 cm posterior of the brainstem (1cmP) (Figure A1 and Table A1 in Supplementary material A).
Dose calculations and optimisations were performed in the Eclipse treatment planning system (TPS) (Varian Medical Systems, Palo Alto, CA, USA). Three-field IMPT plans were created for each of the four different tumour locations including two lateral fields and one posterior non-coplanar field. Field arrangements were, according to standard proton therapy treatment protocols, defined to minimize RBE uncertainties at the end of the treatment fields. This included using multi-field plans and avoiding more than one third of the beams ending within the brainstem [Citation7]. A dose of 59.4 Gy(RBE) in 33 fractions was prescribed to the PTVs (95% dose coverage), in accordance with typical treatment schemes for ependymomas [Citation16]. For the case of the juxtaposed tumour volume (JP), we also investigated the influence of different beam angle configurations. We therefore created plans with; a vertex treatment field (directed towards the most cranial part of the head, in craniocaudal direction) (JP_V), a 45-degree cranial field (JP_45), lateral anterior fields (JP_A), a vertex field in conjunction with lateral anterior fields (JP_AV), and a 45-degree field (JP_A45) (Table A2 in Supplementary material A). Additionally, we created plans using two different spot spacings, of 3 mm (JP_S3) and 9 mm (JP_S9) (spot sizes are linearly dependent on the spot spacing).
In all plans, dose constraints based on clinically applied metrics were applied to the brainstem and brainstem core (brainstem cropped by 3 mm) to keep the risk of brainstem necrosis below 5% (further details in Supplementary material B). The scanning proton beams were generated from generic beam data based on the first-generation Varian ProBeam machine using the Proton Convolution Superposition algorithm: PCS_11.0.31-70MeV. All plans were optimised using IMPT (multi-field optimisation) assuming a constant RBE value of 1.1.
Monte Carlo (MC) simulations
CT images of the patient, as well as relevant treatment parameters (isocentre position, gantry angles, treatment table rotation angles, air gaps, beam energies as well as spot positions, sizes and weights), were imported from the TPS into FLUKA 2011.2c.4 [Citation17,Citation18] using in-house developed software [Citation19] together with DICOM tools in the Flair [Citation20] user interface for FLUKA. The FLUKA MC system was calibrated to match material densities and stopping powers of the Eclipse TPS (see Supplementary material C for details).
Quantities in FLUKA were scored on a voxel-by-voxel basis using the grid specified by the TPS. The scoring region was defined to encompass all relevant patient volumes, with voxel sizes of 1.37 × 1.37 × 3 mm3 in the sagittal, coronal and axial plane of the patient, respectively. Each separate treatment field was simulated using 30 million primaries with resulting mean dose uncertainties below 1% in the PTV and ranging from 1 to 20% in the brainstem, where high uncertainties occurred in very low dose voxels due to few events.
The dose-to-water and dose-averaged LET (LETd) in water were estimated by applying FLUKA user routines. The LETd for each voxel was calculated using the following equation [Citation21]:
(1) where Φi,v(E) is the fluence of particle species i with kinetic energy E in voxel ν, LETi,v(E) is the unrestricted LET for the same kinetic energy (and voxel), and ρw is the density of water (1 g/cm3). The LET from only primary and secondary protons was scored as described by Grassberger and Paganetti [Citation22] (see Supplementary material D for more information on the MC simulations).
Furthermore, offline normalisations were conducted in Python to obtain RBELET = 1+c × LETd and physical dose × RBELET. The LETd was, for each plan, scaled by a parameter c [μm/keV] [Citation13]. We defined this plan-specific c such that the mean RBE within a normalisation volume [Citation23] (a ∼1.44 cm3 box located in the centre of the PTV) was 1.1 for any given treatment plan. The RBELET thereby represented variations in biological effect from LET relative to each specific plan. Thus, physical dose × RBELET (hereafter referred to as D × RBELET) is an approximation of the LET-effect, but not a full estimate of the biological dose. In addition, to investigate the potential reduction in dose homogeneity compared to the assumption of RBE1.1 = 1.1, the D × RBELET was compared to physical dose × RBE1.1 (hereafter referred to as D × RBE1.1).
Results
For the plans with different tumour locations, particularly high LETd values were observed in areas near the distal end of the treatment fields (), and depending on tumour location, the high-LETd edge overlapped with the brainstem. Higher RBELET values were observed in the same areas that had increased LETd. The D × RBELET and D × RBE1.1 had greater differences at the distal edges of the PTV along the beam directions. The most noticeable LETd values in the brainstem occurred in the plans with no overlap between the PTV and brainstem (1cmP and JP) and for the case with half overlap (plan HO). The latter case also showed the largest increase in D × RBELET compared to D × RBE1.1. For the brainstem, the highest mean LETd value (6.6 keV/μm) was seen for the posterior tumour location (1cmP), while the lowest mean LETd value (3.2 keV/μm) occurred in plan FO (). The greatest mean D × RBELET values of 54.0 Gy(RBE) and 43.1 Gy(RBE) (increasing from D × RBE1.1=52.9 Gy(RBE) and 41.3 Gy(RBE)) were seen in the cases where the tumour invaded the brainstem; plans FO and HO, respectively (). Plan 1cmP yielded the lowest mean D × RBELET value (1.8 Gy(RBE)). The mean D × RBELET and D × RBE1.1 values for the PTVs were similar for all tumour locations.
Figure 1. Distributions of physical dose (column 1), LETd (column 2), RBELET=1+c × LETd (column 3), and dose difference between D × RBELET and D × RBE1.1 (column 4) for the treatment plans with different tumour locations. Positive values for the difference plots indicate higher dose using RBELET. The PTVs are indicated in red and the brainstem in magenta. Voxels with dose below 0.01% of the prescription dose are set transparent.
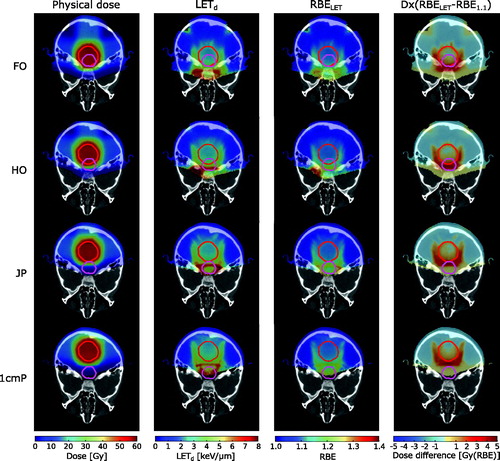
Table 1. Mean LETd values and LETd range in the brainstem and PTVs for all tumour locations and treatment plans.
Table 2. Mean D×RBELET and D×RBE1.1 values and range in the brainstem and PTVs for all tumour locations and treatment plans. The applied scaling parameters c are listed in the far-right column.
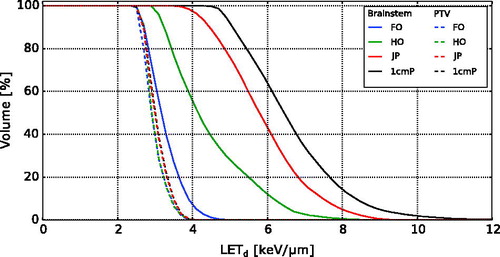
The LETd volume histograms (LVHs) for the different tumour locations showed that plan 1cmP delivered the highest LETd values to the brainstem (). For the remaining tumour locations, decreasing LETd values in the brainstem were seen with increasing overlap between brainstem and tumour. The differences in LETd for the PTVs were less apparent.
Figure 2. LETd volume histograms for the four tumour locations for the brainstem and the PTVs.
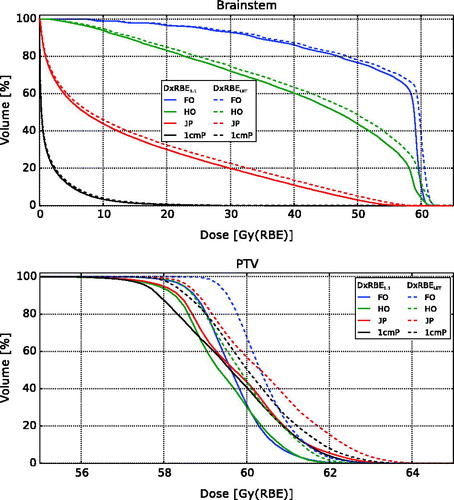
Dose volume histograms (DVHs) comparing D × RBELET and D × RBE1.1 for the four different tumour locations show that the D × RBELET in the brainstem was higher for all tumour locations, most prominent for plan FO, HO and JP (). A slight increase in dose to the PTVs for all tumour locations was also seen.
Figure 3. Brainstem and PTV dose volume histograms calculated from RBE1.1 = 1.1 (D × RBE1.1) and RBELET = 1+c × LETd (D × RBELET) for the four different tumour locations.
Variations in LETd, RBELET and dose difference in the brainstem were found when changing treatment field angles for the juxtaposed tumour location, where plan JP_A and JP_AV showed the overall lowest values for LETd and RBELET (Figure E1 in Supplementary material E). These plans also had the lowest difference in brainstem dose compared to D × RBE1.1. Applying a vertex field (plan JP_V) reduced the mean LETd in the brainstem from 5.9 keV/μm to 4.4 keV/μm, which was further reduced to 4.0 keV/μm by also applying lateral anterior treatment fields (plan JP_AV) (). When changing treatment field angles, the mean D × RBELET in the brainstem could be altered while keeping the mean D × RBELET values for the PTVs relatively constant (). A slight increase in mean D × RBELET (0.9 Gy(RBE)) in the brainstem was seen when changing the spot spacing from 3 mm to 9 mm.
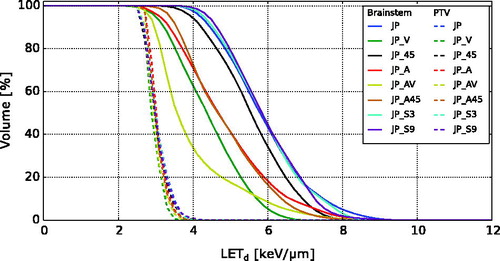
For the JP case, all field arrangements gave higher LETd values in the brainstem compared to in the PTV (), and changing from a posterior to a vertex treatment field showed a reduction in LETd. Lower LETd was also seen from the plans with the two lateral anterior treatment fields (plan JP_A and JP_A45). A combination of a vertex and two lateral anterior fields (plan JP_AV) gave the overall lowest LETd values. Changing the spot spacing only lead to minor differences in the LETd distributions.
Figure 4. LETd volume histograms for plan JP treatment field variations for the brainstem and the PTVs.
Discussion
In this study, we investigated how different tumour locations relative to the brainstem would influence LETd and biologically weighted doses in the brainstem when treating paediatric posterior fossa tumours with IMPT. We also explored different treatment angles and spot spacing for a selected tumour location. The results showed that high-LETd regions may occur within the brainstem, especially for tumours located posterior of the brainstem. However, when using LETd to weight the dose, the cases with overlapping volumes reported the highest values within the brainstem. Furthermore, a reduction in LETd was seen when adjusting treatment field angles.
The highest LETd values occurred at the end of the distal dose fall-off for the proton fields (). This is in agreement with previous LET investigations of spread-out proton Bragg peaks [Citation22,Citation24–26]. In our simulations, applying a posterior cranial treatment field to the PTV posterior of the brainstem resulted in the distal dose fall-off of the beam occurring near the brainstem and, as a consequence, high LETd regions appeared within the brainstem. By changing the posterior cranial treatment field to a vertex field, the mean LETd in the brainstem was reduced by 25%. This indicates that in order to spare the brainstem from high LET, a vertex treatment field should be considered for posterior fossa tumours located posterior of the brainstem. It should, however, be noted that for such posterior tumour locations the physical dose to the brainstem will typically be low, and thereby also reflected in the resulting biological dose. For tumours overlapping the brainstem, the high LETd regions appeared anterior to the brainstem. In these cases, in order to fulfil the planning aims and dose prescription to the PTV, the physical dose to the brainstem will be significantly increased. Therefore, for overlapping tumours, the physical dose to the brainstem will be of much greater concern than the LET.
When changing the spot spacing for the treatment plans, no clearly visible differences in the LETd distributions for the brainstem were seen. However, a (slightly) higher mean D × RBELET value was observed for larger spot spacing (). Increased spot spacing, and thus larger spot sizes, may lead to additional physical dose outside a PTV for the same optimisation criteria [Citation27,Citation28]. For tumours in very close proximity to organs at risk, an increase in physical dose to these organs can therefore occur. This may explain the higher D × RBELET values observed for the plan with increased spot spacing. On the other hand, the slightly higher maximum LETd values for the larger spot spacing () may also have been a contributing factor. A dedicated analysis including further details should be performed to better establish the correlation between spot spacing and LET.
The LET distributions were scored on a voxel-by-voxel basis, using the scoring grid as defined by the TPS. To obtain a single appropriate LET value in each voxel, the average value of the LET spectrum can be used, most often calculated as either the LETd or the track-averaged LET (LETt). By using the LETd as an estimate of the LET, one can typically obtain higher values than using LETt [Citation26,Citation29]. It is, however, presumed that LETd has a better correlation with biological damage to cells compared to LETt and it is the most common method of obtaining LET [Citation29]. It was therefore chosen for our calculations.
High LET does not necessarily result in a drastic increase in biological effect if the physical dose in the same area is low, e.g., following the distal dose fall-off. Many models have been developed for estimation of biological effects of proton beams depending on factors such as tissue type, radiation sensitivity, dose, fractionation, biological endpoint and LET [Citation9,Citation30–32]. However, as there are considerable differences between the biological dose estimation by the models [Citation33], and as we primarily wanted to investigate the inhomogeneity of the LET distributions (outside the target volume), we chose to employ a technique to highlight the increased LET compared to the LET delivered to the target volume. In order to relate the results to the generic RBE = 1.1 weighting scheme, we applied a scaling parameter c to the LETd. A separate c for each treatment plan was used to normalise the RBE to the 1.1 reference frame in the centre of the PTV. The D × RBELET values are therefore not directly comparable between each treatment plan, but will moreover represent increase in dose relative to the PTV. The relative differences between the c parameters were, however, quite small (<9%). The RBELET will thus not be a perfect indicator of the RBE value itself, but it will provide an indication of where elevated RBE values occur relative to the PTV. Alternatively, using a generic c for all treatment plans would imply selecting one treatment plan scenario (with identical beams and PTV), and would not allow for directly showing the elevated RBE values relative to the specific PTV.
In conclusion, when treating children with posterior fossa tumours with IMPT, our modelling study showed elevated LETd values in the brainstem, in particular if the tumour volume was distant from the brainstem. However, the impact of LETd on overall biologically weighted doses was greater for tumours that approached or invaded the brainstem. Adjusting the treatment field angles showed a potential of reducing the LETd in the brainstem, while maintaining the LETd, and thereby the biological effect in the PTV.
IONC_A_1314007_Supplementary_Information.pdf
Download PDF (4.4 MB)Disclosure statement
The authors report no conflicts of interest. The authors alone are responsible for the content and writing of this article.
Additional information
Funding
Related Research Data
References
- Murphy ES, Merchant TE, Wu S, et al. Necrosis after craniospinal irradiation: results from a prospective series of children with central nervous system embryonal tumors. Int J Radiat Oncol Biol Phys. 2012;83:e655–e660.
- Ford AA, Colon-Perez L, Triplett WT, et al. Imaging white matter in human brainstem. Front Hum Neurosci. 2013;7:400.
- Uh J, Merchant TE, Li Y, et al. Differences in brainstem fiber tract response to radiation: a longitudinal diffusion tensor imaging study. Int J Radiat Oncol Biol Phys. 2013;86:292–297.
- Smyth MD, Horn BN, Russo C, et al. Intracranial ependymomas of childhood: current management strategies. Pediatr Neurosurg. 2000;33:138–150.
- Yock TI, Constine LS, Mahajan A. Protons, the brainstem, and toxicity: ingredients for an emerging dialectic. Acta Oncol. 2014;53:1279–1282.
- MacDonald SM, Safai S, Trofimov A, et al. Proton radiotherapy for childhood ependymoma: initial clinical outcomes and dose comparisons. Int J Radiat Oncol Biol Phys. 2008;71:979–986.
- Indelicato DJ, Flampouri S, Rotondo RL, et al. Incidence and dosimetric parameters of pediatric brainstem toxicity following proton therapy. Acta Oncol. 2014;53:1298–1304.
- ICRU. Prescribing, recording, and reporting proton-beam therapy – ICRU report 78. J ICRU. 2007;7:26–27.
- Wedenberg M, Toma-Dasu I. Disregarding RBE variation in treatment plan comparison may lead to bias in favor of proton plans. Med Phys. 2014;41:91706.
- Paganetti H. Relative biological effectiveness (RBE) values for proton beam therapy. Variations as a function of biological endpoint, dose, and linear energy transfer. Phys Med Biol. 2014;59:R419–R472.
- Peeler CR, Mirkovic D, Titt U, et al. Clinical evidence of variable proton biological effectiveness in pediatric patients treated for ependymoma. Radiother Oncol. 2016;121:395–401.
- Giantsoudi D, Adams J, MacDonald SM, et al. Proton treatment techniques for posterior fossa tumors: consequences for linear energy transfer and dose-volume parameters for the brainstem and organs at risk. Int J Radiat Oncol. 2017;97:401–410.
- Unkelbach J, Botas P, Giantsoudi D, et al. Reoptimization of intensity-modulated proton therapy plans based on linear energy transfer. Int J Radiat Oncol Biol Phys. 2016;96:1097–1106.
- Bassler N, Jäkel O, Søndergaard CS, et al. Dose- and LET-painting with particle therapy. Acta Oncol. 2010;49:1170–1176.
- Bassler N, Toftegaard J, Lühr A, et al. LET-painting increases tumour control probability in hypoxic tumours. Acta Oncol. 2014;53:25–32.
- Merchant TE, Sharma S, Xiong X, et al. Effect of cerebellum radiation dosimetry on cognitive outcomes in children with infratentorial ependymoma. Int J Radiat Oncol Biol Phys. 2014;90:547–553.
- Ferrari A, Sala PR, Fasso A, et al. FLUKA: a multi-particle transport code. Cern INFN/TC_05/11, SLAC-R-773; 2005.
- Böhlen TT, Cerutti F, Chin MPW, et al. The FLUKA code: developments and challenges for high energy and medical applications. Nucl Data Sheets. 2014;120:211–214.
- Fjæra LF. Development of a Monte Carlo based treatment planning verification tool for particle therapy [master’s thesis]. Bergen: University of Bergen; 2016. Available at: http://hdl.handle.net/1956/12582
- Vlachoudis V. FLAIR: a powerful but user friendly graphical interface for FLUKA. In: International Conference on Mathematics, Computational Methods & Reactor Physics (M&C 2009), Saratoga Springs, New York; 3–7 May. 2009:1–11.
- Bauer J, Sommerer F, Mairani A, et al. Integration and evaluation of automated Monte Carlo simulations in the clinical practice of scanned proton and carbon ion beam therapy. Phys Med Biol. 2014;59:4635–4659.
- Grassberger C, Paganetti H. Elevated LET components in clinical proton beams. Phys Med Biol. 2011;56:6677–6691.
- Jia Y, Beltran C, Indelicato DJ, et al. Proton therapy dose distribution comparison between Monte Carlo and a treatment planning system for pediatric patients with ependymoma. Med Phys. 2012;39:4742.
- Romano F, Cirrone GAP, Cuttone G, et al. A Monte Carlo study for the calculation of the average linear energy transfer (LET) distributions for a clinical proton beam line and a radiobiological carbon ion beam line. Phys Med Biol. 2014;59:2863–2882.
- Cortés-Giraldo MA, Carabe A. A critical study of different Monte Carlo scoring methods of dose average linear-energy-transfer maps calculated in voxelized geometries irradiated with clinical proton beams. Phys Med Biol. 2015;60:2645–2669.
- Guan F, Peeler C, Bronk L, et al. Analysis of the track- and dose-averaged LET and LET spectra in proton therapy using the GEANT4 Monte Carlo code. Med Phys. 2015;42:6234.
- Steneker M, Lomax A, Schneider U. Intensity modulated photon and proton therapy for the treatment of head and neck tumors. Radiother Oncol. 2006;80:263–267.
- Van De Water TA, Lomax AJ, Bijl HP, et al. Using a reduced spot size for intensity-modulated proton therapy potentially improves salivary gland-sparing in oropharyngeal cancer. Int J Radiat Oncol Biol Phys. 2012;82:313–319.
- Granville DA, Sawakuchi GO. Comparison of linear energy transfer scoring techniques in Monte Carlo simulations of proton beams. Phys Med Biol. 2015;60:N283–N291.
- Wilkens JJ, Oelfke U. A phenomenological model for the relative biological effectiveness in therapeutic proton beams. Phys Med Biol. 2004;49:2811–2825.
- McNamara AL, Schuemann J, Paganetti H. A phenomenological relative biological effectiveness (RBE) model for proton therapy based on all published in vitro cell survival data. Phys Med Biol. 2015;60:8399–8416.
- Carabe-Fernandez A, Dale RG, Jones B. The incorporation of the concept of minimum RBE (RBEmin) into the linear-quadratic model and the potential for improved radiobiological analysis of high-LET treatments. Int J Radiat Biol. 2007;83:27–39.
- Giovannini G, Böhlen T, Cabal G, et al. Variable RBE in proton therapy: comparison of different model predictions and their influence on clinical-like scenarios. Radiat Oncol. 2016;11:68.