
Abstract
Background: Proton therapy dose distributions are sensitive to range variations, e.g. arising from inter-fraction organ motion. The aim of this study was to evaluate the inter-fraction motion robustness of proton beams from different beam angles in irradiation of pelvic lymph nodes (LNs).
Material and methods: Planning CT (pCT) and multiple repeat CT (rCT) scans of 18 prostate cancer patients were used. Considering left and right LNs separately, the average water equivalent path length (WEPL) over all ray paths in the beams eye view of the LNs were calculated for all gantry/couch angle combinations across all rCTs versus the corresponding pCT. Single beam proton plans were optimized on the pCT for all gantry angles (0° couch) and were re-calculated on all rCTs for each respective patient. WEPL and dose parameters were extracted and a statistical clustering analysis performed to identify patient sub-populations in terms of patterns in which angles were robust.
Results: The WEPL analysis showed a general pattern of least variation for 0° couch beam angles where three minima were found across gantry angles for the left LNs and two for the right LNs. The clustering analysis identified three patient sub-groups for the left LNs and two groups for the right LNs. The dose calculations showed similar results as the WEPL variation, e.g. for the left LNs angles around 25°–35°, 100°–110°, and 160°–170° were consistently preferable for both target and organs at risk.
Conclusions: Sub-populations of patients with similar patterns of WEPL variations across beam angles were identified. The most robust angles found for WEPL variations were also confirmed by the dose/volume analysis.
Introduction
The established indications for proton therapy, mainly childhood cancer and selected brain tumors, represent only a minor fraction (2–3%) of the patients that are treated today with radiotherapy (RT) [Citation1]. However, given the fundamental characteristics of protons, this modality has a large potential to improve clinical outcomes for a much larger fraction of cancer patients [Citation2], often estimated to 10–15% of all patients receiving RT [Citation3]. Most of the tumor sites that represent potential new proton therapy indications are located in the thorax, abdomen and pelvis [Citation1]. A common feature of these new indications is that the precision of treatment is challenged by a considerable degree of intra- and inter-fractional organ motion, varying across site and also between patients [Citation4].
With intensity-modulated proton therapy (IMPT), a high and uniform dose across the tumor volume can be obtained [Citation5]. However, given the sensitivity of the proton range to density changes [Citation4], the dose distribution is at risk of being degraded unless the uncertainties in range are accounted for [Citation6–9]. When irradiating large targets such as the pelvic lymph nodes (LNs), the influence of factors such as internal organ motion, weight loss and positioning should be analyzed and considered to ensure that the prescribed dose is delivered accurately to the target [Citation10,Citation11]. This is usually done by adding a margin around the target volumes; however, the resulting expanded volume could increase to a size where the benefit of protons, i.e. sparing the normal tissue, is lost. Instead robust treatment plan, optimization has been reported as being preferable to the use of conventional margins [Citation12].
The beam angles giving least density change in the materials traversed by the proton beams are considered most robust to range uncertainties. The range uncertainties are, therefore, closely coupled to the changes in the water equivalent path length (WEPL) of the proton pencil beams towards the target [Citation13–15]. Robust optimization has been explored by several studies [Citation6,Citation12,Citation16–18]; however, only few studies have so far investigated the advantages of minimizing the WEPL in regard to beam angles for the purpose of identifying the most robust beam directions for proton therapy [Citation13,Citation19–22]. In a previous study from our institution, Casarez-Magaz et al. [Citation13] investigated the correlation of WEPL variation with dose degradation on 4D-CT scans of lung cancer patients. Van der Voort et al. [Citation19] implemented a method for robust optimization by estimating the set-up uncertainty with lateral beam shifts and the range uncertainty by scaling the CT values. Recently, we developed a method where initial results indicated the possibility to identify patient groups with similar beam angle robustness patterns with respect to inter-fraction motion, relating WEPL changes to degradations in the dose distributions [Citation14].
The aim of this study was, therefore, to investigate across a larger patient population, which beam angles were more robust to inter-fraction motion in the setting of pelvic LN irradiation for prostate cancer patients. We also aimed to identify any sub-populations of patients with similar patterns in the motion-robustness across beam angles, as well as to explore whether the robust angles could be identified using few repeat CT scans for each patient.
Material and methods
Patient cohort and image material
The study used data sets from 18 patients with locally advanced prostate cancer, each set consisting of a planning CT (pCT) (Prospeed SX Power, GE Medical Systems, Milwaukee, WI) and 7–10 repeat CT (rCT) scans acquired twice weekly throughout the course of treatment. The patients were previously treated using IMRT at Haukeland University Hospital, Bergen, Norway. The CT scans were acquired with the patients in supine position, using the same fixation device as for treatment. The images extended from the L4 vertebrae to the inferior end of the coccyx with a slice thickness of 2–3 mm and an image size of 512 × 512 pixels. All targets and organs at risk (ORs) were delineated by the same experienced radiation oncologist for all pCTs and rCTs. The treatment protocol and further details have been described previously [Citation10,Citation11,Citation23].
Water equivalent path length computation
The average WEPL was calculated as the average over each beams eye view (BEV) ray path WEPL map to the distal surface of the LN CTV for each beam angle. The average WEPL was calculated for all possible single-beam configurations, i.e. for both gantry and couch angle in 5° intervals, creating a 2D map, with the left and right LNs studied separately. The standard deviation of the absolute differences in the averaged WEPL between the pCT and all rCTs were subsequently extracted. Further details of the method can be found in our previous publication [Citation13]. Furthermore, for a couch angle of 0°, the mean and the standard deviation of the WEPL differences, over all rCTs and the pCT WEPL map, were extracted for every patient in the population for further analysis.
Treatment planning and beam angle evaluation
For all gantry angle configurations at couch angle 0°, single-beam spot scanning proton plans were optimized using TRiP [Citation24,Citation25] avoiding contralateral angles. The plans covered the LN planning target volume (PTV), generated from the clinical target volume (CTV) using four different isotropic margin alternatives (0, 3, 5, and 7 mm), separately for left and right LN volumes. To describe the dose to target and ORs with as few variables as possible, only the target PTV for the given side, left or right, was included in the plan for optimization.
Dose distributions were subsequently re-calculated on the rCTs by applying the optimized fluence maps from the pCT for each beam angle onto all rCTs, using the center of mass of the prostate for rigid translational alignment. For each CT, the dose volume histograms (DVHs) and average dose were computed for the right and left LN CTV, the bladder and rectum. For six patients (including pCTs and 42 rCTs in total) similar calculations were performed also for the bowel cavity.
Patient clustering comparison
A k-nearest-neighbor cluster comparison analysis was performed to identify possible sub-populations of patients with similar patterns in motion robustness with respect to beam angles [Citation26]. This analysis compared patients against angles for log2 normalized WEPL difference and log2 normalized dose degradation. The log2 normalization was done by subtracting the mean of the row from each point in that row, and then dividing by the standard deviation of that row and finally taking log2 of that number; the resulting value was therefore unit less. The patients and angles were grouped and sorted by similarity using the k-nearest-neighbor distance to identify patient populations and simultaneously the robust angles for these groups.
Predictive analysis
To explore if the results found in this study could be identified using less data early on in the course of treatment, the analysis as described above was repeated using only data from the first two rCTs (from the first week) of each patient.
All data analysis was carried out in in-house scripts made for Python 2.7 (www.python.org) [Citation25], Matlab v.R2015a (The MathWorks Inc., Natick, MA) and the R software (www.r-project.org) [Citation14].
Results
Water equivalent path length analysis
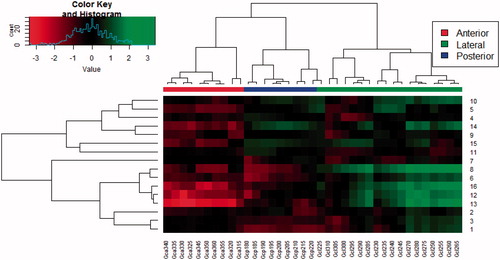
For 11 patients, the WEPL maps showed larger variations (standard deviation of WEPL >2.5 mm) across angles, with the highest values at the lateral angles (80–100°), whereas other patients did not have any clear patterns in the WEPL maps. The WEPL analysis for the left and right section of the LNs showed a general pattern of least variation around the axial plane, i.e. for couch angle =0°. Furthermore, the smallest WEPL variation in the axial plane were seen at gantry angles of 0°–25°, 125°–140°, and 170°–180° for the left section, as well as gantry angles of 180°–220° and 330°–355° for the right section, which also appeared to be the angles of lowest variation among all patients (). For the left section of the LNs, the clustering analysis of the WEPL maps at couch angle =0° against gantry angles showed that the patients split into three groups from which one group of two patients (patients 1 and 15) showed a clearly different pattern of lower variation in the lateral and posterior angles. The other fourteen patients were closer correlated and showed highest variation for the lateral angles (Supplementary Figure 1). For the right section of the lymph nodes, the patients were split into two groups of seven and nine patients, where the group of seven had a higher variation in the posterior angles, while the group of nine had larger variation for the lateral angles ().
Figure 1. Standard deviation of WEPL over the difference of all rCTs to the pCT for each mean over BEV ray path (to the right section of the lymph nodes) map in every 5° in a semicircle on the axial plane (couch =0°) on the right side of the patients. The upper plot is all the individual patients numbered 1->16; the lower plot is the mean and standard deviation across all the patients for each angle.
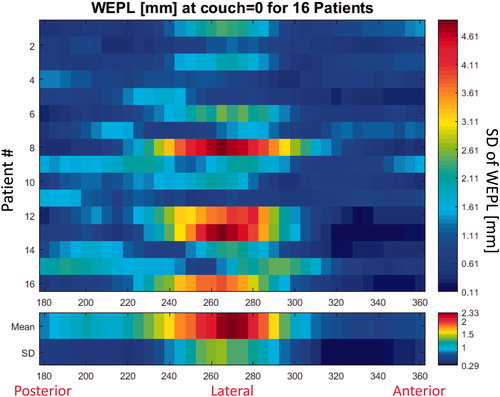
Figure 2. Cluster comparison plot for the log2 normalized mean WEPL deviation to the right section of the LNs. A higher “Value” corresponds to a higher WEPL variation (top left). Correlating patients (rows) against angles (columns). The branch length corresponds to the Pearson distance between rows and columns.
Treatment plan analysis
For all patients throughout all scans, we found three minima of lowest dose to the bladder and bowel. In order of increasing dose these angles were 35°, 170°, and 100° for the bladder and 160°, 110°, and 25° for the bowel, left-right symmetrically. For the rectum, we found peaks of higher dose mainly at 45°, 120°, and 180°. Furthermore, the LNs showed most dose degradation around 145°, between 0° and 25° and for one patient at 65°. Across the DVHs for all volumes of interest, we found that the intervals 25°–35°, 100°–110°, and 160°–170° all showed lower OR doses while maintaining target coverage, when compared with other angles.
The mean-dose analysis generally showed two beam angle intervals of larger dose degradation to the bladder, prostate and rectum: 0°–20° and 110°–130°. Additionally, for the rectum direct posterior and, left-right symmetrically, 50°–60°, showed higher dose degradation. The bowel received an increasing amount of dose as the gantry angles approached anterior. These patterns were seen for both the 3 and 5 mm margins.
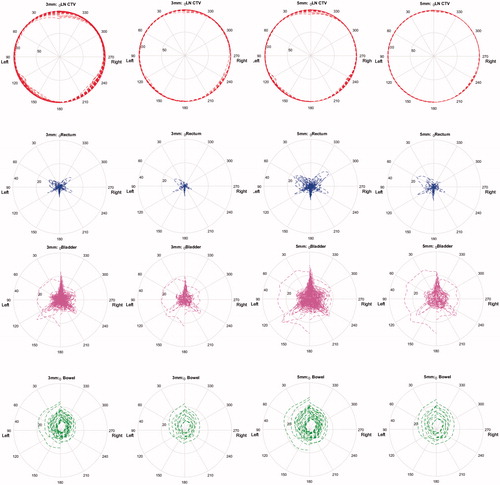
The analysis using only two rCTs per patient identified very similar patterns, again both for the 3 and 5 mm margins. Independent of margin size, the dose degradation was well described for the LN and bowel, whereas it was underestimated for the rectum and bladder ().
Figure 3. Polar-plot of mean dose to the LNs (red), Rectum (blue), Bladder (purple), and bowel (green). The gantry angle corresponds to the angular axis only treating from ipsi-lateral angles, meaning the left section of the LNs is treated for 0°–180° and the right section for 180°–360°, the radius corresponds to the mean dose (percent of prescribed dose). All pCTs and rCTs of all patients are plotted on top of each other in the first and third column, the second column, and fourth column only use two rCTs per patient. The two left columns are using a 3 mm isotropic margin, the two right columns using a 5 mm margin.
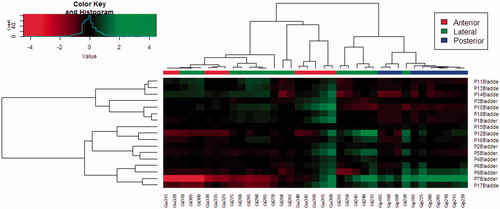
The mean-dose cluster comparison analysis yielded the same patient groups for the rectum and bladder as for the WEPL clustering. Among the two main groups of seven and nine patients, we, respectively, observed that the posterior and anterior angles had a more favorable dose distribution ().
Figure 4. Cluster comparison plot for the log2 normalized mean dose to the bladder when treating the right section of the LNs with a 5 mm isotropic margin. A higher “Value” corresponds to a higher mean dose variation (top left). Correlating patients (rows) against angles (columns). The branch length corresponds to the Pearson distance between rows and columns respectively (one patient was excluded, due to outliers disturbing the visibility).
Discussion
By calculating, analyzing, and comparing WEPL maps and treatment planning endpoints for each side of the lymph nodes across the possible beam directions in a large cohort of patients, we have in this study developed and applied a method to identify beam angles which were more robust to organ motion for different sub-groups of patients. Previous studies of beam angle evaluation/optimization with respect to plan robustness have explored primarily intra-fraction motion/uncertainties quantified using 4D-CT scans [Citation13,Citation27,Citation28] or simulations of set-up uncertainties by isocenter shifts [Citation19]. Our method adds to these previous studies as it addresses inter-fraction organ motion.
In this study, we have explored the existence of robust angles for sub-populations of patients with respect to inter-fraction motion, expressed as variations in WEPL. In our results, we did not observe a direct correlation between WEPL variation and robustness in terms of dose degradation; however, the patient populations were separated by having different magnitude of overall WEPL variation. This could mean that taking the average over each BEV map may not always be representative for dose degradation in large targets such as the lymph nodes.
We identified two main patient sub-populations using the WEPL variation, with each group having a preference in terms of OR dose: in one group, the more posterior angles were preferable and in one group the lateral towards anterior angles. These groups did not show any preference in terms of target dose. This suggests that the variation in WEPL may be a good metric for predicting which sub-populations patients belong to.
The results were left-right symmetric for most organs. However, for the rectum, we found a tendency of higher robustness of low mean dose around 165° for the right side as compared to the anterior angles, whereas the opposite was seen for the bladder (). When observing the dose maps in the re-calculated plans, the primary dose degradation was at the distal end of the beam either overshooting or undershooting the target. Overshooting leads to an increased dose behind the target in the beam direction; therefore, the more posterior angles were found to be more robust for the rectum. Chronic rectal bleeding and loss of bowel function are relatively common late side effects [Citation29], for this reason, the posterior angles may be recommended for being most robust, with best sparing for the bowel and rectum. For the bladder, however, the bladder filling may lead to the bladder entering the field laterally to the beam direction in the anterior to lateral beam angles, and two primary patient populations with different angle robustness were observed. Previous studies have shown “hot-spots” in the bladder to be associated with late genitourinary toxicity [Citation30], and should, therefore, be avoided. For this reason, and because the rectum does not have a general robust angle from the left side for all the patients, robust angles specific for sub-populations of patients appear beneficial and should be further explored.
The plans in this study were created using isotropic CTV-to-PTV margin expansion, and with no consideration of ORs in the dose optimization. Different optimization algorithms and priorities in the optimization would influence the results. Our results showed that 3 mm isotropic margin might be too small for some cases, while 5 mm might give sufficient target coverage throughout the entire treatment course. Using margins of 7 mm showed no significant difference from 5 mm, except increasing the OR dose. It should be pointed out that this study did not consider setup-errors (only relative motion between the prostate and the LNs) as the rCTs were aligned to the center of the prostate; however, modern treatment planning systems have solutions developed to take such uncertainties into account using isocenter shifts during the treatment planning optimization [Citation19,Citation31,Citation32].
When the mean-dose analysis was performed using only the first two rCTs, the same pattern as in the full analysis was observed. The magnitude of the dose degradation described using only two CTs was depending on the organ, with rectum and bladder showing larger deviations as compared with the use of all rCTs. This shows that the patient group and angles of least dose degradation may be predictable using fewer scans, opening the potential for adaptive strategies. This, however, requires high quality on-line imaging, to be able to reliably (re-)evaluate the plan, e.g. using cone beam CT (CBCT) images. Recent studies have developed methods that use the CBCT image along with the pCT for fast plan re-evaluation and potentially adaptation [Citation33–36] e.g. using fast online re-optimization [Citation37]. In an ongoing study, we are currently exploring an a priori scatter correction method [Citation33] to allow for fast CBCT-based on-line evaluation of the anatomy of the day.
This study only used the prostatic LNs as target for simplicity and, therefore, the angles found to be more robust does not necessarily apply for the prostate itself [Citation38]. In ongoing work, we are exploring whether the same patterns of robustness are found when plans treating both the primary (prostate) and elective targets (including LNs) are created in a clinical (and commercial) treatment planning system. In future work, we will explore how this method could be clinically implemented in combination with the CBCT scatter correction. Furthermore, this study explored the pelvic lymph nodes as target; however, the method could be applied to any target and the appropriate ORs.
In conclusion, we have in this study found that differences in WEPL maps and mean dose to ORs show population-specific patterns and that there were consistent patterns in which angles were most robust. Similar “robust” angles were also found in the DVH analysis.
Acknowledgments
Michael Krämer, GSI Biophysik, Darmstadt, is acknowledged for his advice and for providing TRiP98, the treatment planning system used in this study. Bjarne Thomsen, Department of Physics and Astronomy, Aarhus University, is thanked for providing cluster computing time. Niels Bassler, Department of Physics and Astronomy, Aarhus University, is thanked for his advice and maintenance on the cluster computer system.
Disclosure statement
The authors report no conflicts of interest. The authors alone are responsible for the content and writing of this article.
References
- Langendijk JA, Lambin P, De Ruysscher D, et al. Selection of patients for radiotherapy with protons aiming at reduction of side effects: the model-based approach. Radiother Oncol. 2013;107:267–273.
- Widesott L, Pierelli A, Fiorino C, et al. Helical tomotherapy vs. intensity-modulated proton therapy for whole pelvis irradiation in high-risk prostate cancer patients: dosimetric, normal tissue complication probability, and generalized equivalent uniform dose analysis. Int J Radiat Oncol Biol Phys. 2011;80:1589–1600.
- Muren LP, Rossi C, Hug E, et al. Establishing and expanding the indications for proton and particle therapy. Acta Oncol. 2013;52:459–462.
- Engelsman M, Schwarz M, Dong L. Physics controversies in proton therapy. Semin Radiat Oncol. 2013;23:88–96.
- Lomax A. Intensity modulation methods for proton radiotherapy. Phys Med Biol. 1999;44:185–205.
- Chen W, Unkelbach J, Trofimov A, et al. Including robustness in multi-criteria optimization for intensity-modulated proton therapy. Phys Med Biol. 2013;57:591–608.
- Park PC, Cheung JP, Zhu XR, et al. Statistical assessment of proton treatment plans under setup and range uncertainties. Int J Radiat Oncol Biol Phys. 2013;86:1007–1013.
- Unkelbach J, Chan TCY, Bortfeld T. Accounting for range uncertainties in the optimization of intensity modulated proton therapy. Phys Med Biol. 2007;52:2755–2773.
- Unkelbach J, Bortfeld T, Martin BC, et al. Reducing the sensitivity of IMPT treatment plans to setup errors and range uncertainties via probabilistic treatment planning. Med Phys. 2009;36:149–163.
- Thörnqvist S, Muren LP, Bentzen L, et al. Degradation of target coverage due to inter-fraction motion during intensity-modulated proton therapy of prostate and elective targets. Acta Oncol. 2013;52:521–527.
- Thörnqvist S, Bentzen L, Petersen JBB, et al. Plan robustness of simultaneous integrated boost radiotherapy of prostate and lymph nodes for different image-guidance and delivery techniques. Acta Oncol. 2011;50:926–934.
- Liu W, Frank SJ, Li X, et al. PTV-based IMPT optimization incorporating planning risk volumes vs robust optimization. Med Phys. 2013;40:21709.
- Casares-Magaz O, Toftegaard J, Muren LP, et al. A method for selection of beam angles robust to intra-fractional motion in proton therapy of lung cancer. Acta Oncol. 2014;53:1058–1063.
- Andersen AG, Casares-Magaz O, Muren LP, et al. A method for evaluation of proton plan robustness towards inter-fractional motion applied to pelvic lymph node irradiation. Acta Oncol. 2015;54:1643–1650.
- Mori S, Lu H-M, Wolfgang J. a, et al. Effects of interfractional anatomical changes on water-equivalent pathlength in charged-particle radiotherapy of lung cancer. JRR. 2009;50:513–519.
- Liao L, Lim GJ, Li Y, et al. Robust optimization for intensity modulated proton therapy plans with multi-isocenter large fields. Int J Part Ther. 2016;IJPT-16-00012.1.
- Li Y, Niemela P, Liao L, et al. Selective robust optimization: a new intensity-modulated proton therapy optimization strategy. Med Phys. 2015;42:4840–4847.
- Liu W, Zhang X, Li Y, et al. Robust optimization of intensity modulated proton therapy. Med Phys. 2012;39:1079–1091.
- van der Voort S, van de Water S, Perkó Z, et al. Robustness recipes for minimax robust optimization in intensity modulated proton therapy for oropharyngeal cancer patients. Int J Radiat Oncol Biol Phys. 2016;95:163–170.
- Chang JY, Li H, Zhu XR, et al. Clinical implementation of intensity modulated proton therapy for thoracic malignancies. Int J Radiat Oncol Biol Phys. 2014;90:809–818.
- Mori S, Wolfgang J, Lu H-M, et al. Quantitative assessment of range fluctuations in charged particle lung irradiation. Int J Radiat Oncol Biol Phys. 2008;70:253–261.
- Matney JE, Park PC, Li H, et al. Perturbation of water-equivalent thickness as a surrogate for respiratory motion in proton therapy. J Appl Clin Med Phys. 2016;17:5795.
- Muren LP, Wasbø E, Helle SI, et al. Intensity-modulated radiotherapy of pelvic lymph nodes in locally advanced prostate cancer: planning procedures and early experiences. Int J Radiat Oncol Biol Phys. 2008;71:1034–1041.
- Krämer M, Jäkel O, Haberer T, et al. Treatment planning for scanned ion beams. Radiother Oncol. 2004;73(Suppl 2):S80–S85.
- Toftegaard J, Petersen JBB, Bassler N. PyTRiP – a toolbox and GUI for the proton/ion therapy planning system TRiP. J Phys: Conf Ser. 2014;489:12045.
- Chaikh A, Giraud J-Y, Perrin E, et al. The choice of statistical methods for comparisons of dosimetric data in radiotherapy. Radiat Oncol. 2014;9:205.
- Bernatowicz K, Lomax AJ, Knopf A. Comparative study of layered and volumetric rescanning for different scanning speeds of proton beam in liver patients. Phys Med Biol. 2013;58:7905–7920.
- Bernatowicz K, Zhang Y, Weber D, et al. 4D optimized treatment planning for actively scanned proton therapy delivered to moving target volume. Med Phys. 2015;42:3615.
- Michalski JM, Gay H, Jackson A, et al. Radiation dose-volume effects in radiation-induced rectal injury. Int J Radiat Oncol Biol Phys. 2010;76:S123–S129.
- Cheung MR, Tucker SL, Dong L, et al. Investigation of bladder dose and volume factors influencing late urinary toxicity after external beam radiotherapy for prostate cancer. Int J Radiat Oncol Biol Phys. 2007;67:1059–1065.
- Fredriksson A, Forsgren A, Hårdemark B. Minimax optimization for handling range and setup uncertainties in proton therapy. Med Phys. 2011;38:1672–1684.
- Standard New Feature/Enhancement Description EclipseTM Treatment Planning System for Proton Therapy v13.7 Key Features n.d.
- Park Y-K, Sharp GC, Phillips J, et al. Proton dose calculation on scatter-corrected CBCT image: feasibility study for adaptive proton therapy. Med Phys. 2015;42:4449–4459.
- Veiga C, Janssens G, Teng C-L, et al. First clinical investigation of CBCT and deformable registration for adaptive proton therapy of lung cancer. Int J Radiat Oncol Biol Phys. 2016;95:549–559.
- Thing RS, Bernchou U, Mainegra-Hing E, et al. Hounsfield unit recovery in clinical cone beam CT images of the thorax acquired for image guided radiation therapy. Phys Med Biol. 2016;61:5781–5802.
- Kurz C, Dedes G, Resch A, et al. Comparing cone-beam CT intensity correction methods for dose recalculation in adaptive intensity-modulated photon and proton therapy for head and neck cancer. Acta Oncol. 2015;54:1651–1657.
- Unkelbach J, Botas P, Giantsoudi D, et al. Reoptimization of intensity modulated proton therapy plans based on linear energy transfer. Int J Radiat Oncol Biol Phys. 2016;96:1097–1106.
- Cao W, Lim GJ, Li Y, et al. Improved beam angle arrangement in intensity modulated proton therapy treatment planning for localized prostate cancer. Cancers (Basel). 2015;7:574–584.