
Abstract
Background: PET-guided dose painting (DP) aims to target radioresistant tumour regions in order to improve radiotherapy (RT) outcome. Besides the well-known [18F]fluorodeoxyglucose (FDG), the hypoxia positron emission tomography (PET) tracer [18F]fluoroazomycin arabinoside (FAZA) could provide further useful information to guide the radiation dose prescription. In this study, we compare the spatial distributions of FDG and FAZA PET uptakes in lung tumours.
Material and methods: Fourteen patients with unresectable lung cancer underwent FDG and FAZA 4D-PET/CT on consecutive days at three time-points: prior to RT (pre), and during the second (w2), and the third (w3) weeks of RT. All PET/CT were reconstructed in their time-averaged midposition (MidP). The metabolic tumour volume (MTV: FDG standardised uptake value (SUV) > 50% SUVmax), and the hypoxic volume (HV: FAZA SUV > 1.4) were delineated within the gross tumour volume (GTVCT). FDG and FAZA intratumoral PET uptake distributions were subsequently pairwise compared, using both volume-, and voxel-based analyses.
Results: Volume-based analysis showed large overlap between MTV and HV: median overlapping fraction was 0.90, 0.94 and 0.94, at the pre, w2 and w3 time-points, respectively. Voxel-wise analysis between FDG and FAZA intratumoral PET uptake distributions showed high correlation: median Spearman’s rank correlation coefficient was 0.76, 0.77 and 0.76, at the pre, w2 and w3 time-points, respectively. Interestingly, tumours with high FAZA uptake tended to show more similarity between FDG and FAZA intratumoral uptake distributions than those with low FAZA uptake.
Conclusions: In unresectable lung carcinomas, FDG and FAZA PET uptake distributions displayed unexpectedly strong similarity, despite the distinct pathways targeted by these tracers. Hypoxia PET with FAZA brought very little added value over FDG from the perspective of DP in this population.
Introduction
In recent years, dose painting (DP) has been regarded as a promising concept in radiation therapy (RT). The fundamental idea is simple: identifying radioresistant regions within the tumour based on functional imaging, e.g., positron emission tomography (PET), then delivering a heterogeneous dose prescription which specifically targets these areas [Citation1]. In the most sophisticated form of the strategy, known as dose painting by numbers (DPBN), the dose is distributed from voxel to voxel as a function of signal intensity, e.g., PET standardised uptake values (SUV) [Citation2]. As a result, DP is expected to improve the loco-regional tumour control rate while keeping treatment toxicities within acceptable limits.
This approach is particularly appealing for patients with locally advanced (stage III) lung cancer. In these patients, conventional RT schemes, even combined with chemotherapy, achieve disappointing loco-regional tumour control rates of about 30% at 5 years [Citation3,Citation4]. Dose escalation strategies should theoretically improve these results. However, in a recent phase III study, homogenous dose escalation (74 Gy) failed to demonstrate a clinical benefit compared to the standard treatment (60 Gy). While the exact reasons for this failure remain unknown, non-optimal dose prescription to the target and organs at risk might partially explain the increased rate of local failure and late toxicities encountered in the high dose arm [Citation5]. By restricting the dose escalation to radioresistant tumour regions, DP should thus reconcile treatment efficacy goals and safety imperatives.
Although any PET tracer identifying a metabolic pathway associated with radioresistance could be selected for DP purposes, [18F]fluorodeoxyglucose (FDG) and [18F]fluoroazomycin arabinoside (FAZA) stand out from others. The former is a surrogate of tumour burden and has already shown its ability to depict more accurately the tumour extension [Citation6] and to identify tumour regions susceptible to relapse after chemoradiotherapy based on pre-treatment imaging in lung cancer patients [Citation7,Citation8]. Clinical studies have already demonstrated the feasibility of FDG-PET-guided DP in head and neck [Citation9] and lung cancer patients [Citation10]. The latter is a surrogate of tumour hypoxia. Indeed, FAZA is a nitroimidazole compound which is reduced and trapped within the cells under hypoxic conditions [Citation11]. Hypoxia is a long-known cause of radioresistance [Citation12] and modelling studies have suggested that increasing dose to hypoxic tumour regions should improve tumour control probability significantly [Citation13,Citation14].
From a theoretical standpoint, if FDG and hypoxia PET imaging display different uptake patterns, they could provide complementary information with regard to DP. So far, studies comparing FDG and hypoxia PET uptake distributions in lung cancer yielded conflicting results [Citation15–18], and it remains unclear whether these observations might partly result from methodological issues rather than from real differences in tracer uptakes. In order to achieve a reliable comparison between FDG and hypoxia PET images, the acquisition protocol should satisfy several conditions: (1) imaging sessions should be close in time to avoid spatiotemporal changes in tumour biology; (2) patient positioning should be reproducible to facilitate image comparison; and (3) respiratory-induced motion should be adequately managed to avoid image blurring and misalignment at the tumour level.
In this context, we performed multiple-point FDG and FAZA PET imaging with respiratory motion compensation in patients with lung cancer undergoing RT. Based on this image database, we previously described the spatio-temporal evolution of FDG and FAZA PET uptake distributions during the treatment [Citation19]. In the present article, we focused on the comparison between FDG and FAZA PET uptake patterns.
Material and methods
Patient selection
From November 2013 to January 2016, 14 patients (five women and nine men) with unresectable lung cancer, which were referred to our department for definitive chemoradiotherapy, were prospectively included in the study (). Patients had a median age of 69.5 years (range: 57–79 years). Tumours were classified as squamous cell carcinoma (n = 6), adenocarcinoma (n = 6) and small-cell lung cancer (n = 2). All but two patients had stage III disease at their diagnostic workup (patient #4: stage IV; patient #14: stage II). Patient #14 was upstaged to stage IV disease based on the pre-treatment FDG PET/CT acquired as part of the study and was subsequently disqualified from RT. Patients were treated with concurrent (n = 11) or sequential (n = 2) platinum-based chemoradiotherapy, with RT fractionation of 25 × 2.5 Gy (n = 2), 30 × 2 Gy (n = 10) or 25 × 1.8 Gy (n = 1).
Table 1. Patient characteristics.
PET/CT imaging
Patients underwent FDG and FAZA 4D-PET/CT on consecutive days at three time-points: prior to RT as part of the planning process (pre), and during the second (w2) and third (w3) weeks of treatment, for a total of three PET/CT pairs per patient.
All acquisitions were performed on a Gemini TF PET/CT (Philips Medical Systems, Cleveland, OH). Patients were immobilised with a thermoplastic mask in RT position, and were audio-coached in order to ensure regular breathing during the 4D acquisitions [Citation20]. The respiratory signal was recorded with a pneumatic pressure belt (Medspira Breath Hold, Medspira, Minneapolis, MN).
First, a 4D-CT scan covering the entire thoracic region (slice thickness: 2 mm) was acquired, and binned into 10 equally distributed temporal CT frames. Then, a 4D-PET scan (single bed position centred on the tumour, with a length of 180 mm) was performed. For FDG imaging, patients fasting for at least six hours before examination received a median activity of 309 MBq (interquartile range (IQR) [302–314]) FDG and were scanned a median time of 87 minutes (IQR [77–98]) post-injection for 10 minutes. For FAZA imaging, patients received a median activity of 386 MBq (IQR [374–391]) FAZA (synthesised as previously described [Citation21]) and were scanned a median time of 127 minutes (IQR [116–137]) post-injection for 30 minutes. The PET data were binned into five equally distributed temporal frames. Images were corrected for decay, random, scatter, attenuation and reconstructed using the iterative algorithm 3D LOR-OSEM (three iterations and 33 subsets, 2 mm isotropic voxels). Each PET respiratory frame was corrected for attenuation using the corresponding CT frame. During the FDG 4D-PET/CT imaging sessions, an additional free-breathing contrast-enhanced CT (CE-CT) was acquired for the purpose of tumour delineation. For an average patient, the effective dose for the complete procedure (4D-PET/CT and CE-CT) was approximately 21.5 mSv, from which 5.5, 9 and 7 mSv are attributable to the PET, the 4D-CT and the CE-CT acquisitions, respectively.
Each 4D-PET/CT was reconstructed in its time-averaged midposition (MidP) using homemade software (REGGUI) [Citation22]. First, the MidP CT was generated from deformable registration of the 10 CT respiratory frames as previously described [Citation23]. The resulting image represents the anatomy in its time-weighted mean position over the respiratory cycle. It combines the advantages of being less noisy than single respiratory frames and allowing for better representation of the actual tumour shape [Citation24]. As a result, MidP CT images are visually sharp, in contrast with average CT images, which are blurred by respiratory motion. Then, the MidP PET image was generated from the five PET respiratory frames using the motion data derived from the 4D-CT [Citation25]. As for MidP CT, MidP PET images are compensated for respiratory motion and therefore allow for better estimation of tumour volumes and standardized uptake values (SUV) [Citation25].
Image analysis
For each MidP PET/CT pair, the gross tumour volume (GTVCT) consisting of the primary tumour was first manually delineated by an experienced radiation oncologist on the FDG MidP PET/CT using a standard lung window (level: –600, window: 1600). Next, CT-based rigid registration centred on the tumour was performed between the FDG and the FAZA MidP PET/CT using MIM Maestro Version 6 (MIM Software, Cleveland, OH). Finally, the GTVCT was rigidly propagated to the FAZA MidP PET/CT.
Following this, FDG and FAZA PET images were compared within GTVCT for global uptakes parameters, as well as for intratumoral uptake distributions using both volume- and voxel-based analyses.
Global uptake parameters. FDG and FAZA SUVmax, SUVpeak and SUVmean were measured and compared within GTVCT.
Volume-based analysis. The metabolic tumour volume (MTV) consisting of voxels within GTVCT with a SUV higher than 50% of the SUVmax was delineated on the FDG MidP PET images. This threshold is currently used in the PET-boost trial [Citation10]. The hypoxic volume (HV) which consists of voxels within GTVCT with a SUV higher than 1.4 was delineated on the FAZA MidP PET images. To our knowledge, there is no validated method for the segmentation of hypoxic tumour subvolumes based on FAZA PET imaging. The fixed 1.4 threshold was recently recommended for hypoxia-directed dose escalations protocols using the hypoxia PET tracer 18F-MISO, based on its simplicity and reproducibility [Citation26].
For each image pair, the overlapping fraction (OF) between the MTV and the HV, which is defined as the ratio of their intersection to the smallest volume, was computed [Citation27], i.e., OF=V1∩V2/min(V1,V2), where V1 and V2 are the two analysed volumes, ∩ is the intersection and, min(V1,V2) is the smallest volume.
Voxel-based analysis. For each FDG and FAZA image pair, voxel SUV values within GTVCT were extracted using PMOD version 3.5 (PMOD Technologies, Zurich, Switzerland) and compared on a voxel-wise basis.
Statistical analysis
Global uptake parameters (SUVmax, SUVpeak and SUVmean) for FDG and FAZA were compared using linear regression and Pearson’s correlation coefficient. FDG and FAZA voxel-wise comparison was performed using Spearman’s rank correlation coefficient (rS). SPSS Statistical Software Version 23 (IBM, Armonk, NY) was used for all statistical analyses and graphic illustrations. All tests were two-tailed and a p value lower than .05 was considered as significant.
Results
A total of 75 PET/CT were performed (39 FDG and 36 FAZA PET/CT) and 36 pairs of PET/CT could be compared. Median time interval between FDG and FAZA PET/CT was one day (range: 1–8 days). Patients underwent w2 and w3 imaging sessions after a median dose of 16 Gy (IQR [14.1–21.4]) and 28 Gy (IQR [25.5–33.9]) (equivalent dose in 2 Gy fractions, assuming an alpha/beta ratio of 10 Gy), respectively. Respiration-associated tumour motion was relatively small, with a median amplitude of 2.9 mm (IQR [1.7–6.0]) over all imaging sessions. GTVCT volumes are listed in .
Table 2. Evolution of tumour volumes during RT.
Global uptake parameters. Median FDG SUVmax was 14.0 (IQR [9.0–16.4]), 8.8 (IQR [5.9–13.3]) and 9.4 (IQR [4.8–15.3]), and median FAZA SUVmax was 1.9 (IQR [1.5–2.2]), 1.8 (IQR [1.5–2.4]) and 1.7 (IQR [1.4–2.3]) at pre, w2 and w3 time-points, respectively.
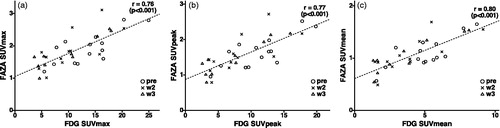
FDG and FAZA global uptake parameters showed high correlation: all image pairs put together, Pearson’s correlation coefficient (r) between FDG and FAZA SUVmax, SUVpeak and SUVmean were 0.76, 0.77 and 0.80, respectively (p value <.001) ().
Figure 1. Relationship between FDG and FAZA SUVmax (a), SUVpeak (b) and SUVmean (c). Each mark represents an image pair, the timing of the imaging session is represented by a circle (pre-treatment), a cross (second week of treatment) or a triangle (third week of treatment).
Volume-based analysis. MTV and HV volumes are listed in . In most cases, MTV was larger than HV. In three patients (#10, #11 and #13), HV was systematically larger than MTV, and in patient #6, HV was larger than MTV at the pre-treatment time-point exclusively.
MTV and HV showed large overlap: median OF between MTV and HV were 0.90 (IQR [0.76–0.98]), 0.94 (IQR [0.80–0.99]) and 0.94 (IQR [0.66–0.97]) at pre, w2 and w3 time-points, respectively ().
Table 3. Comparison between FDG and FAZA PET uptake distributions.
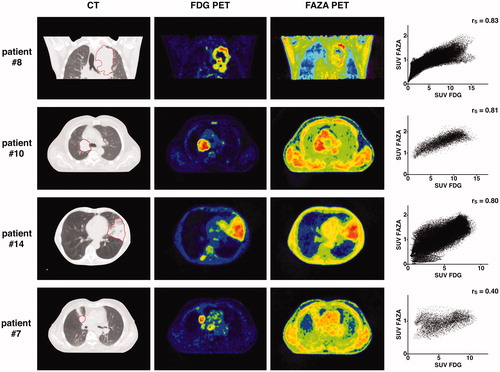
Voxel-based analysis. Intratumoral FDG and FAZA PET uptake distributions showed high correlation: voxel-wise comparison yielded median rS of 0.76 (IQR [0.62–0.83]), 0.77 (IQR [0.70–0.82]) and 0.76 (IQR [0.66–0.80]) at pre, w2 and w3 time-points, respectively ( and ).
Figure 2. For four different patients, the panels display from left to right: (1) the pre-treatment CT scan (the GTVCT is delineated with a red line); (2) the pre-treatment FDG PET scan; (3) the pre-treatment FAZA PET scan and; (4) the voxel-by-voxel scatter plot showing the relation between FDG and FAZA PET uptake values within GTVCT. FAZA PET images constantly display lower tumour-to-background ratio than FDG. The three upper panels correspond to tumours with relatively high FAZA uptake, in which FDG and FAZA intratumoral uptake distributions show good correlation. The lower panel displays a tumour which FAZA uptake does not exceed the background, and shows low similarity with FDG.
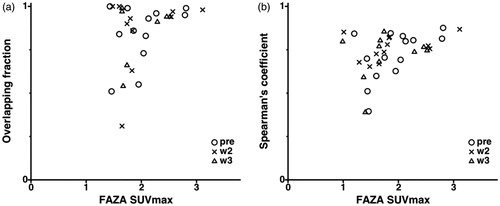
Interestingly enough, the similarity between FDG and FAZA intratumoral uptake distributions increased along with the global tumour FAZA uptake, both based on volume and voxel parameters ().
Figure 3. Relationship between FAZA SUVmax and: the overlapping fraction between MTV and HV (a); the Spearman’s rank correlation coefficient corresponding to the voxel-wise comparison between FDG and FAZA uptakes within the tumour (b). Each mark represents an image pair, the timing of the imaging session is represented by a circle (pre-treatment), a cross (second week of treatment), or a triangle (third week of treatment).
Discussion
In this study, we compared FDG and FAZA PET uptakes in lung tumours during RT. Global indicators such as SUVmax, SUVpeak and SUVmean showed high correlation. Similarly, FDG and FAZA intratumoral PET uptake patterns displayed strong similarities, in both volume and voxel analyses. Interestingly, similarity was even stronger as global FAZA uptake increased, a case where FAZA was precisely expected to show more specific uptake patterns as a result of higher hypoxia levels.
Several studies have compared FDG and hypoxia PET uptakes in lung tumours. Regarding global uptake parameters, the available studies were diverse in both the considered hypoxia PET tracer (60Cu-ATSM [Citation28], 62Cu-ATSM [Citation29], 18F-FMISO [Citation30–33], 18F-FAZA [Citation16,Citation29], 18F-HX4 [Citation17,Citation18]) and uptake parameters (tumour-to-background ratio, SUV, or both), and they yielded conflicting results. Some found no correlation between FDG and hypoxia PET global uptake parameters [Citation18,Citation28,Citation30,Citation31]. Others found a moderate correlation, which was either non-significant [Citation16,Citation29,Citation33], or significant [Citation17,Citation29,Citation32]. Next, some studies compared FDG and hypoxia PET intratumoral uptake distributions. These studies differed also widely in terms of methodology. Zegers et al. [Citation17] performed a volume overlap analysis between metabolically active tumour subvolumes (FDG SUV >50% SUVmax) and hypoxic tumour subvolumes (18F-HX4 tumour-to-blood ratio >1.4). On average, 76% of the hypoxic subvolumes were included within the metabolic subvolumes. Using the same methodology, van Elmpt et al. [Citation18] obtained an average overlap of 71%. In comparison, in the present study an average of 71%, 74% and 70% of the HV was included in the MTV, at the pre, w2 and w3 time-points, respectively. Lohith et al. [Citation15] compared FDG and 62Cu-ATSM intratumoral PET uptake patterns using multiple small regions-of-interest (ROI) located within the tumour. For each of these ROIs, they computed FDG and 62Cu-ATSM SUVmean, then performed a correlation analysis. In squamous cell carcinomas, a negative correlation was observed (median r=–0.39), while in adenocarcinomas, the correlation was positive (median r = 0.58). In the present study, we did not perform a subgroup analysis based on the tumour histology because of the small sample sizes. Finally, Bollineni et al. [Citation16] performed a voxel-wise comparison of FDG and FAZA PET uptake distributions, showing weak correlation (median rS of 0.35). By contrast with the present study, the analysis was restricted to the high FDG uptake volume (FDG SUV >34% SUVmax), which might partly explain the lower correlation. The higher the cutoff threshold, the lower the observed contrast in the high uptake volume, the higher the proportional influence of random noise, and eventually the lower the correlation with another modality.
Methodological factors have probably contributed to the heterogeneity of the results reported in the literature, as well as to the higher correlations observed in our study. The choice of the hypoxia PET tracer strongly affects the uptake pattern. As an example, Cu-ATSM has been used for years as a hypoxia tracer, but was recently shown to correlate poorly with immunohistochemical hypoxia markers compared to nitroimidazoles molecules (e.g., 18F-FAZA, 18F-FMISO and 18F-HX4) [Citation34]. The timing of PET acquisition is also critical. Nitroimidazole tracers display slow wash-out and poor target-to-background ratio. Late and long PET acquisitions should therefore be preferred [Citation35], but this recommendation has not always been applied. Furthermore, reliable image comparison requires that several conditions are met. First, the patient position should be reproducible between acquisitions, which was ensured in this study by the use of immobilisation devices. Next, the time interval between FDG and hypoxia PET should be kept as short as possible to avoid anatomical or biological changes at the tumour level. In this study, FDG and FAZA PET images were acquired on consecutive days for most patients. Finally, respiration-induced tumour motion can cause image blur and incorrect estimates of tumour volume and PET uptake [Citation36]. Respiratory amplitude or frequency can also vary during and between imaging sessions [Citation37], resulting in additional image artefacts and/or mismatches between PET and CT tumour positions. To avoid these issues, patients were systematically audio-coached during the 4D acquisitions to regularize breathing and tumour motion parameters [Citation20], while time-averaged MidP images were used as reference for comparison purposes.
The similarity between FDG and FAZA PET uptake patterns might be explained by factors related to both tumour cell biology and the imaging technique itself. From a biological standpoint, the correlation between PET uptakes could reflect the cellular co-localisation of FDG and FAZA linked to anaerobic glycolysis (Pasteur effect), even if FDG is usually not considered as a specific surrogate of hypoxia [Citation38]. The uptake correlation could also be driven by subregional features such as cell density or blood supply. As a result of the low spatial resolution of PET imaging, these factors, which occur on a larger space scale, are likely to overweight the cellular distribution of hypoxia, varying over distances as short as 100 μm [Citation39]. This would also explain why the similarity between FAZA and FDG uptake distributions tends to increase in tumours with higher global FAZA uptakes. Since FAZA displays lower tumour-to-background ratio than FDG PET, similarity between both uptake patterns would only appear in tumours with sufficient FAZA uptake.
Increasing the radiation dose to the tumour should result in better local tumour control, regardless of the dose distribution. The hypothesis behind DP is that functional imaging is able to identify radioresistant tumour regions, and thereby that a heterogeneous dose distribution that specifically targets these regions will be more effective than a homogeneous distribution with the same integral dose. Recently, a preclinical study failed to confirm this hypothesis in rat rhabdomyosarcomas [Citation40]. In this study, a homogeneous dose distribution was either superior or as effective as a heterogeneous dose distribution with the same mean dose targeting high FDG uptake tumour areas. Several clinical studies evaluating FDG-directed (PET-boost trial, RTOG 1106, RTEP 7), or hypoxia-directed (RTEP 5) dose-boosting in lung cancer patients are currently ongoing, and their results are eagerly expected. However, most of them are comparing a dose escalated arm with a lower homogeneous integral dose in the control arm. Even if more favourable outcome is achieved in the dose escalated group, the question will remain whether the clinical gain would result from the dose escalation, the dose redistribution, or both. Only the PET-boost trial is clearly testing the DP hypothesis by including a study arm in which the PET-guided dose distribution is compared to the isotoxic homogeneous dose distribution. Based on our results, it will also be difficult to determine whether the potential benefit of these treatments is attributable to the targeting of the intended biological pathway (i.e., tumour burden for FDG, hypoxia for nitroimidazole tracers), or to the accidental targeting of the other. Indeed, comparable FDG and FAZA uptake distributions are expected to lead to comparable dose prescriptions. The obtained dose distributions could be even more similar, since they will be limited by the finite dose resolution of the RT machine, and further smoothed when geometrical uncertainties are accounted for during the treatment planning and delivery (e.g., due to tumour motion, tumour baseline shift or setup errors).
Some potential limitations of the study should be mentioned. First, the size of the population sample was limited by the complexity of the imaging protocol and by the monocentric nature of the study. However, despite the relatively low number of patients, the results were largely convergent. Next, we decided to use the MidP strategy to mitigate the impact of respiratory motion on the PET uptake distribution. In our patient cohort, this approach had probably limited added value since respiration-associated tumour motion was relatively small. This may be related to the fact that tumours were mostly located in the upper lung lobes (12 out of 14 patients), where respiratory motion is generally small. Finally, we pooled all FDG and FAZA PET/CT pairs together for FDG and FAZA SUVmax, SUVpeak and SUVmean correlation analysis. However, these data are not independent since up to three pairs of images belong to the same patient. We tested the robustness of our results by performing the calculations on the 14 pre-treatment PET/CT pairs alone and the results were unchanged: r between FDG and FAZA for SUVmax, SUVpeak and SUVmean was 0.76, 0.77 and 0.77, respectively (p value <.002). A similar remark can be made for the voxel-wise correlation analysis of FDG and FAZA PET uptakes. Indeed, uptake values of neighbouring voxels are not fully independent because of post-reconstruction smoothing, which should lead to higher correlation results, by smoothing either noise or actual local uptake variations within each image.
In summary, FDG and FAZA PET uptake distributions displayed strong similarities in unresectable lung carcinomas, despite the distinct pathways targeted by these tracers. Hypoxia PET with FAZA brought very little added value over FDG from the perspective of DP in this population.
Ethical approval
All procedures performed in studies involving human participants were in accordance with the ethical standards of the institutional committee on human experimentation and with the Helsinki declaration of 1975, as revised in 1983.
Informed consent
Informed consent was obtained from all individual participants included in the study.
Disclosure statement
None to declare.
Additional information
Funding
References
- Ling CC, Humm J, Larson S, et al. Towards multidimensional radiotherapy (MD-CRT): biological imaging and biological conformality. Int J Radiat Oncol Biol Phys. 2000;47:551–560.
- Bentzen SM. Theragnostic imaging for radiation oncology: dose-painting by numbers. Lancet Oncol. 2005;6:112–117.
- Auperin A, Le Pechoux C, Rolland E, et al. Meta-analysis of concomitant versus sequential radiochemotherapy in locally advanced non-small-cell lung cancer. J Clin Oncol. 2010;28:2181–2190.
- Machtay M, Paulus R, Moughan J, et al. Defining local-regional control and its importance in locally advanced non-small cell lung carcinoma. J Thorac Oncol. 2012;7:716–722.
- Bradley JD, Paulus R, Komaki R, et al. Standard-dose versus high-dose conformal radiotherapy with concurrent and consolidation carboplatin plus paclitaxel with or without cetuximab for patients with stage IIIA or IIIB non-small-cell lung cancer (RTOG 0617): a randomised, two-by-two factorial phase 3 study. Lancet Oncol. 2015;16:187–199.
- Wanet M, Lee JA, Weynand B, et al. Gradient-based delineation of the primary GTV on FDG-PET in non-small cell lung cancer: a comparison with threshold-based approaches, CT and surgical specimens. Radiother Oncol. 2011;98:117–125.
- Aerts HJ, van Baardwijk AA, Petit SF, et al. Identification of residual metabolic-active areas within individual NSCLC tumours using a pre-radiotherapy [18]Fluorodeoxyglucose-PET-CT scan. Radiother Oncol. 2009;91:386–392.
- Calais J, Thureau S, Dubray B, et al. Areas of high 18F-FDG uptake on preradiotherapy PET/CT identify preferential sites of local relapse after chemoradiotherapy for non-small cell lung cancer. J Nucl Med. 2015;56:196–203.
- Berwouts D, Olteanu LA, Duprez F, et al. Three-phase adaptive dose-painting-by-numbers for head-and-neck cancer: initial results of the phase I clinical trial. Radiother Oncol. 2013;107:310–316.
- van Elmpt W, De Ruysscher D, van der Salm A, et al. The PET-boost randomised phase II dose-escalation trial in non-small cell lung cancer. Radiother Oncol. 2012;104:67–71.
- Piert M, Machulla HJ, Picchio M, et al. Hypoxia-specific tumor imaging with 18F-fluoroazomycin arabinoside. J Nucl Med. 2005;46:106–113.
- Gray LH, Conger AD, Ebert M, et al. The concentration of oxygen dissolved in tissues at the time of irradiation as a factor in radiotherapy. BJR. 1953;26:638–648.
- Popple RA, Ove R, Shen S. Tumor control probability for selective boosting of hypoxic subvolumes, including the effect of reoxygenation. Int J Radiat Oncol Biol Phys. 2002;54:921–927.
- Thorwarth D, Eschmann SM, Paulsen F, et al. Hypoxia dose painting by numbers: a planning study. Int J Radiat Oncol Biol Phys. 2007;68:291–300.
- Lohith TG, Kudo T, Demura Y, et al. Pathophysiologic correlation between 62Cu-ATSM and 18F-FDG in lung cancer. J Nucl Med. 2009;50:1948–1953.
- Bollineni VR, Kerner GS, Pruim J, et al. PET imaging of tumor hypoxia using 18F-fluoroazomycin arabinoside in stage III–IV non-small cell lung cancer patients. J Nucl Med. 2013;54:1175–1180.
- Zegers CM, van Elmpt W, Reymen B, et al. In vivo quantification of hypoxic and metabolic status of NSCLC tumors using [18F]HX4 and [18F]FDG-PET/CT imaging. Clin Cancer Res. 2014;20:6389–6397.
- van Elmpt W, Zegers CM, Reymen B, et al. Multiparametric imaging of patient and tumour heterogeneity in non-small-cell lung cancer: quantification of tumour hypoxia, metabolism and perfusion. Eur J Nucl Med Mol Imaging. 2016;43:240–248.
- Di Perri D, Lee JA, Bol A, et al. Evolution of [18F]fluorodeoxyglucose and [18F]fluoroazomycin arabinoside PET uptake distributions in lung tumours during radiation therapy. Acta Oncol. 2017;56:516–524.
- Goossens S, Senny F, Lee JA, et al. Assessment of tumor motion reproducibility with audio-visual coaching through successive 4D CT sessions. J Appl Clin Med Phys. 2014;15:4332.
- Servagi-Vernat S, Differding S, Hanin FX, et al. A prospective clinical study of 18F-FAZA PET-CT hypoxia imaging in head and neck squamous cell carcinoma before and during radiation therapy. Eur J Nucl Med Mol Imaging. 2014;41:1544–1552.
- Janssens G, Jacques L, Orban de Xivry J, et al. Diffeomorphic registration of images with variable contrast enhancement. Int J Biomed Imaging. 2011;2011:891585.
- Wanet M, Sterpin E, Janssens G, et al. Validation of the mid-position strategy for lung tumors in helical TomoTherapy. Radiother Oncol. 2014;110:529–537.
- Wolthaus JW, Sonke JJ, van Herk M, et al. Reconstruction of a time-averaged midposition CT scan for radiotherapy planning of lung cancer patients using deformable registration. Med Phys. 2008;35:3998–4011.
- Kruis MF, van de Kamer JB, Houweling AC, et al. PET motion compensation for radiation therapy using a CT-based mid-position motion model: methodology and clinical evaluation. Int J Radiat Oncol Biol Phys. 2013;87:394–400.
- Thureau S, Chaumet-Riffaud P, Modzelewski R, et al. Interobserver agreement of qualitative analysis and tumor delineation of 18F-fluoromisonidazole and 3′-deoxy-3′-18F-fluorothymidine PET images in lung cancer. J Nucl Med. 2013;54:1543–1550.
- Aerts HJ, Bosmans G, van Baardwijk AA, et al. Stability of 18F-deoxyglucose uptake locations within tumor during radiotherapy for NSCLC: a prospective study. Int J Radiat Oncol Biol Phys. 2008;71:1402–1407.
- Dehdashti F, Mintun MA, Lewis JS, et al. In vivo assessment of tumor hypoxia in lung cancer with 60Cu-ATSM. Eur J Nucl Med Mol Imaging. 2003;30:844–850.
- Kinoshita T, Fujii H, Hayashi Y, et al. Prognostic significance of hypoxic PET using [18]F-FAZA and (62)Cu-ATSM in non-small-cell lung cancer. Lung Cancer. 2016;91:56–66.
- Gagel B, Reinartz P, Demirel C, et al. [18F] fluoromisonidazole and [18F] fluorodeoxyglucose positron emission tomography in response evaluation after chemo-/radiotherapy of non-small-cell lung cancer: a feasibility study. BMC Cancer. 2006;6:51.
- Cherk MH, Foo SS, Poon AM, et al. Lack of correlation of hypoxic cell fraction and angiogenesis with glucose metabolic rate in non-small cell lung cancer assessed by 18F-Fluoromisonidazole and 18F-FDG PET. J Nucl Med. 2006;47:1921–1926.
- Vera P, Bohn P, Edet-Sanson A, et al. Simultaneous positron emission tomography (PET) assessment of metabolism with (1)(8)F-fluoro-2-deoxy-d-glucose (FDG), proliferation with (1)(8)F-fluoro-thymidine (FLT), and hypoxia with (1)(8)fluoro-misonidazole (F-miso) before and during radiotherapy in patients with non-small-cell lung cancer (NSCLC): a pilot study. Radiother Oncol. 2011;98:109.
- Sachpekidis C, Thieke C, Askoxylakis V, et al. Combined use of [18]F-FDG and [18]F-FMISO in unresectable non-small cell lung cancer patients planned for radiotherapy: a dynamic PET/CT study. Am J Nucl Med Mol Imaging. 2015;5:127–142.
- Carlin S, Zhang H, Reese M, et al. A comparison of the imaging characteristics and microregional distribution of 4 hypoxia PET tracers. J Nucl Med. 2014;55:515–521.
- Zegers CM, van Elmpt W, Wierts R, et al. Hypoxia imaging with [(1)(8)F]HX4 PET in NSCLC patients: defining optimal imaging parameters. Radiother Oncol. 2013;109:58–64.
- Liu C, Pierce LA II, Alessio AM, et al. The impact of respiratory motion on tumor quantification and delineation in static PET/CT imaging. Phys Med Biol. 2009;54:7345–7362.
- Neicu T, Berbeco R, Wolfgang J, et al. Synchronized moving aperture radiation therapy (SMART): improvement of breathing pattern reproducibility using respiratory coaching. Phys Med Biol. 2006;51:617–636.
- Christian N, Deheneffe S, Bol A, et al. Is [18]F-FDG a surrogate tracer to measure tumor hypoxia? Comparison with the hypoxic tracer (14)C-EF3 in animal tumor models. Radiother Oncol. 2010;97:183–188.
- Ljungkvist AS, Bussink J, Rijken PF, et al. Vascular architecture, hypoxia, and proliferation in first-generation xenografts of human head-and-neck squamous cell carcinomas. Int J Radiat Oncol Biol Phys. 2002;54:215–228.
- Trani D, Yaromina A, Dubois L, et al. Preclinical assessment of efficacy of radiation dose painting based on intratumoral FDG-PET uptake. Clin Cancer Res. 2015;21:5511–5518.