
Abstract
Purpose: An association between radiomic features extracted from CT and local tumor control in the head and neck squamous cell carcinoma (HNSCC) has been shown. This study investigated the value of pretreatment functional imaging (18F-FDG PET) radiomics for modeling of local tumor control.
Material and Methods: Data from HNSCC patients (n = 121) treated with definitive radiochemotherapy were used for model training. In total, 569 radiomic features were extracted from both contrast-enhanced CT and 18F-FDG PET images in the primary tumor region. CT, PET and combined PET/CT radiomic models to assess local tumor control were trained separately. Five feature selection and three classification methods were implemented. The performance of the models was quantified using concordance index (CI) in 5-fold cross validation in the training cohort. The best models, per image modality, were compared and verified in the independent validation cohort (n = 51). The difference in CI was investigated using bootstrapping. Additionally, the observed and radiomics-based estimated probabilities of local tumor control were compared between two risk groups.
Results: The feature selection using principal component analysis and the classification based on the multivariabale Cox regression with backward selection of the variables resulted in the best models for all image modalities (CICT = 0.72, CIPET = 0.74, CIPET/CT = 0.77). Tumors more homogenous in CT density (decreased GLSZMsize_zone_entropy) and with a focused region of high FDG uptake (higher GLSZMSZLGE) indicated better prognosis. No significant difference in the performance of the models in the validation cohort was observed (CICT = 0.73, CIPET = 0.71, CIPET/CT = 0.73). However, the CT radiomics-based model overestimated the probability of tumor control in the poor prognostic group (predicted = 68%, observed = 56%).
Conclusions: Both CT and PET radiomics showed equally good discriminative power for local tumor control modeling in HNSCC. However, CT-based predictions overestimated the local control rate in the poor prognostic validation cohort, and thus, we recommend to base the local control modeling on the 18F-FDG PET.
Introduction
Head and neck cancer squamous cell carcinomas (HNSCC) show a heterogeneous response to radiochemotherapy with locoregional control and five-year overall survival ranging from below 50% to 80% [Citation1–4]. Few biomarkers related to tumor response to a therapy are already available for this tumor entity, for example: human papillomavirus infection [Citation1–2], overexpression of epidermal growth factor receptor [Citation5], tumor hypoxia or overexpression of cyclin D1 [Citation6]. Apart from the interpatient variations, an intratumor heterogeneity in treatment response is observed. The tissue-based biomarkers from tumor biopsies may not account for intratumor heterogeneity, except for selected markers and marker profiles [Citation7], and thus, other approaches should be investigated.
Radiation oncology is an imaging driven discipline incorporating precision medicine since many years. Each treatment plan is personalized based on pretreatment imaging. So far images collected in radiation oncology are a widely unused source of data, which could have a much higher impact on radiation treatment. However, an expert-based, observer specific analysis would limit the applicability of a decision support system. Radiomics is a method for quantitative analysis of medical images [Citation7,Citation8]. It provides tools for comprehensive image analysis on different scales: shape, intensity, texture and transform-based analysis. Its potential as a prognostic or predictive biomarker has been studied for different image modalities and tumor entities [Citation9–11].
On the level of anatomical imaging, pretreatment CT radiomics was found to be prognostic for local tumor control [Citation12] and overall survival [Citation11,Citation13–15] in head and neck cancer, significantly stratifying patients into low- and high-risk groups. Those studies showed that tumors, which are heterogeneous in terms of CT density are associated with a worse prognosis. The analysis of heterogeneity in functional imaging could potentially further improve the imaging-based prognostic models. In head and neck cancer, texture of dynamic contrast-enhanced MRI (DCE-MRI) showed differences throughout the course of radiochemotherapy [Citation16]. However, these differences were not correlated with local treatment failure. Another DCE-MRI study suggested that the histogram analysis provides parameters prognostic for progression-free survival and overall survival in stage IV HNSCC [Citation17]. Conflicting results have been published regarding the role of pretreatment 18F-FDG PET as a prognostic factor in head and neck cancer. Some retrospective data showed an association between disease-free survival and increased maximum as well as mean standardized uptake value (SUV), whereas other groups did not observe such a correlation [Citation18]. Recently, Vallieres et al. [Citation19] tried to predict locoregional control using combined PET and CT radiomics. This study was not successful. Considering the increasing evidence of the association between CT radiomics and local tumor control [Citation12], the mixed experiences using functional and anatomical imaging could be explained by other non-tumor related factors influencing nodal recurrence or too large number of studied radiomic features in relation to number of included patients.
In this work, we evaluate whether the metabolic information captured by 18F-FDG PET improves the prediction of local tumor control compared to the anatomical information from CT. Additionally, we investigate if the combination of both CT and PET can further improve the modeling.
Material and methods
Studied population and imaging protocol
Two cohorts of head and neck squamous cell carcinoma (HNSCC) patients were analyzed, a retrospective cohort of 121 patients (training cohort) with stage-III or stage-IV HNSCC and 51 patients (validation cohort) with the same tumor stages from a prospective phase-II study (NCT01435252). Inclusion criteria were as follows: treatment with definitive radiochemotherapy, contrast-enhanced planning CT and diagnostic 18F-FDG PET images available, no induction chemotherapy, no surgery (biopsy allowed), no previous or other simultaneous malignancies. Patients in the training cohort were treated with 70 Gy and concomitant weekly cisplatin (40 mg/m2, up to 7 cycles) or cetuximab (loading dose 400 mg/m2 followed by 250 mg/m2 weekly), whereas the validation cohort received triple therapy consisting of radiotherapy (70 Gy) and weekly concurrent cisplatin/cetuximab (same doses as in training cohort) with or without consolidation cetuximab (500 mg/m2 biweekly × 6). In both cohorts, the elective lymph nodes were irradiated with 54 Gy. The radiation dose was delivered using intensity modulated and simultaneous integrated boost technique in all patients. Follow-up included examinations by otorhinolaryngology specialists every 2–3 months and repetitive 18F-FDG PET/CTs. Local recurrence was proven by a biopsy in the region of primary tumor. Further details on the patient population are presented in .
Table 1. Detailed patients characteristic.
All patients underwent a diagnostic 18F-FDG PET scan and a contrast-enhanced planning CT. On average, the scans were performed within 25 days. In the case of PET imaging, an activity of 178–513 MBq was administered intravenously 1 h prior to the scan and after the measurement of blood sugar level. In the retrospective cohort, 2D or 3D iterative image reconstruction was used, whereas the images of the validation cohort were reconstructed with 3D algorithm. Before the CT imaging, iodine contrast was injected intravenously. Its dose varied among the patients in the training cohort but was standardized in the validation cohort. Also the scanner type and the scanning parameters: tube current and kV, varied between the patients in the training cohort. Specific details as well as the information about image resolution are shown in .
Table 2. The scanning parameters for training and validation cohorts and two image modalities.
Image preprocessing and radiomics
The primary tumor was separately segmented in the CT and PET images. The CT segmentation was performed manually. In all cases, two radiation oncologists, both having more than 10 years of experience, were involved in the process. Contours were later postprocessed for the presence of metal artifacts to exclude non-tumor related effects. If a certain tumor slice was affected by any artifacts, the entire tumor contour was erased from that slice. Tumors with more than 50% of volume not suitable for the analysis were not included in the study. Additionally, the voxels outside of soft tissue Hounsfield unit (HU) range (−20 HU to 180 HU) were discarded. The tumor in the PET image was autosegmented using a gradient-based method implemented in MIMVISTA (MIM Software Inc., Cleveland, OH). The contours and images were linearly interpolated to cubic voxels. The voxel size corresponded to the largest dimension in the original dataset: 3.3 mm in CT (slice thickness) and 5.5 mm in PET (in-plane resolution).
A fully DICOM compatible, in-house developed radiomics software implementation written in the Python programing language was used. It provides 3D implementation of feature extraction methods for four types of features:
shape (n = 18)
intensity (n = 19)
texture: the Gray Level Co-occurrence Matrix (n = 26), the Neighborhood Gray Tone Difference Matrix (n = 4) and the Gray Level Size Zone Matrix (n = 14)
wavelet transform using Coiflet function (8 sub-bands, n = 488).
For each patient, 569 CT radiomic features and 569 PET radiomic features were extracted from the tumor volumes. For the texture and wavelet analysis, images were discretized to a fixed bin size of 5 HU and 0.25 SUV in the CT and PET, respectively. This choice of bin sizes resulted in similar numbers of bins in both modalities – on average 35 and 36 bins were analyzed in CT and PET, respectively. The details of the implementation are presented in the supplement.
Prognosis of local tumor control using radiomics
Three separate models to predict local tumor control were trained: CT based, PET based and the model comprising both CT and PET radiomic features. The model training consisted of two steps: feature selection and classification. Several feature selection and classification methods were used to reduce the model training method bias on the comparison between modalities and to train the best possible model. In the feature selection step, we considered:
the principal component analysis (PCA) combined with univariable Cox regression,
the Pearson correlation between the features and the principal components,
the average clustering,
the mutual information method,
the minimum redundancy maximum relevance method.
The classification was performed using:
the multivariable Cox regression with backward selection of the variables,
the least absolute shrinkage and selection operator (LASSO),
the random forest.
All the methods are described in the supplement. Per image modality, the model characterized by the largest concordance index (CI) in the 5-fold cross validation in the training cohort and the smallest number of included features was selected for further validation and comparison.
The risk group stratification was performed based on the trained models. The thresholds were chosen to obtain the same level of sensitivity and specificity in the receiver operating characteristic curve for local tumor control at 18 months.
Models validation and comparison
The radiomics-based local tumor control prognostic models, based on different imaging modalities, were verified and compared in the independent validation cohort. First, the differences in CI were investigated using Wilcoxon test (p-value < 0.05) and the bootstrap method with 100 randomly selected samples to calculate the CI distribution. Next, the risk group stratification was studied with the G-rho test. Finally, the linear dependence of the predicted and observed tumor control probabilities at 18 months for two risk groups was determined, to compare the stratifications from the different models. In this regard, a good model is defined by a linear dependence with slope equals 1.
Results
Radiomics-based models of local tumor control
Using different combinations of five feature selection and three classification methods, 15 local tumor control prognostic models were trained per image modality. They were compared based on the 5-fold cross-validated concordance index in the training cohort and the number of included features (Supplement Table 1S). The combination of feature selection using the PCA and univariable modeling and classification using the Cox regression with backward selection resulted in the least complicated model with the best discriminative power. This hold true for both PET and CT modeling.
The PCA resulted in the preselection of 12 CT features, five PET features and 11 features from the combined CT and PET feature set. Final CT- and PET-based tumor local control models consisted of two radiomic features (CT: GLSZMsize_zone_entropy, HLH intensityenergy; PET: spherical disproportion, GLSZMSZLGE; see discussion paragraphs two and three for the interpretation of the features). The combined model comprised two features, a combination of CT and PET features, which were also selected in the single modality modeling (CT HLH intensityenergy and PET GLSZMSZLGE). All models showed a similar discriminative power in the training cohort using 5-fold cross-validation: CICT = 0.72, CIPET = 0.74, CIPET/CT = 0.77.
Validation of the local tumor control models and their comparison
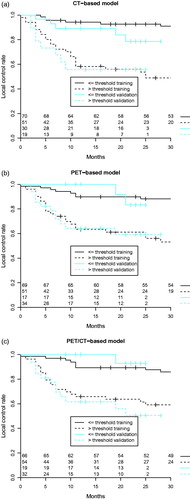
The comparison of the local tumor control models was based on the data from the validation cohort. Studied radiomics-based models did not differ significantly in terms of discriminative power: CICT = 0.73, CIPET = 0.71, CIPET/CT = 0.73. All models significantly stratified patients into low- and high-risk groups of tumor recurrence (). For the validation cohort, the use of combined PET and CT radiomics did not bring an added value to local tumor control modeling in HNSCC compared to single-modality radiomics.
Figure 1. Radiomics-based local tumor control prognostic models: (a) CT-based radiomics, (b) PET-based radiomics, (c) CT- and PET-based radiomics. Tumor control curves split significantly (G-rho test p-value < 0.05) in both training and validation cohorts based on the optimal sensitivity-specificity thresholds at 18 months.
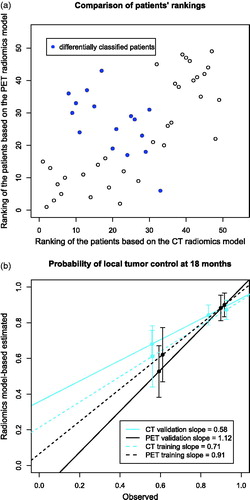
There was a significant correlation (r = 0.62, p-value < 0.001) between the rankings of the patients in PET and CT radiomics models. However, the stratification of patients into low- and high-risk groups of tumor recurrence was different in 30% of the cases. Although this concerned mostly the patients close to the stratification thresholds, a group of seven patients, who were ranked low based on the CT model and high based on the PET model, was identified (). The observed and model-based estimated probabilities of local tumor control at 18 months were compared for both risk groups (). The PET-based model gave a better estimation with a linear regression slope of 1.12 in comparison to 0.58 in the CT-based model. The latter model overestimated the probability of tumor control in the poor prognosis group. Those results are consistent with the differential classification of the aforementioned seven patients.
Figure 2. The comparison of risk group stratification in the validation cohort by CT- and PET-based radiomics models (a) the repeatability of patients’ ranking based on CT and PET radiomics models and differences in risk group stratification, (b) the relation between observed and radiomics model-based estimated probabilities of local tumor control at 18 months for risk groups defined using the radiomics models.
Discussion
Identification of new biomarkers in head and neck cancer is crucial to improve heterogeneous treatment outcome after definitive radiochemotherapy. A potential source of novel biomarkers could be radiomics, which can capture spatial tumor heterogeneity in terms of morphology or tumor biology, depending on the analyzed image type. This study showed that both heterogeneity in tumor CT density and in tumor metabolic activity, measured by 18F-FDG PET, are prognostic for local tumor control in HNSCC. CT radiomics and PET radiomics-based models showed a similar discriminative power (CI around 0.7) in the training as well as in the independent validation datasets. They also significantly stratified patients into low- and high-risk groups of tumor recurrence. However, the probability of tumor control in poor prognostic cohort was overestimated using the CT-based model, which was not observed in the PET-based radiomics model. Overall, the multimodality radiomics combining PET and CT did not improve the local tumor control modeling.
On the level of morphological imaging, head and neck tumors characterized by increased heterogeneity in CT density (increased GLSZMsize_zone_entropy) were associated with worse prognosis (Supplement Figure 2S). This result is consistent with previously published studies investigating local control [Citation12] and overall survival [Citation13,Citation15] as endpoints. To understand the underlying biological processes of these findings, it would be of great interest to investigate if radiomic features corresponding to heterogeneity correlate with histopathological stainings of cell proliferation, microvessel density or hypoxia.
Regarding tumor metabolic activity, round tumors based on the PET signal autosegmentation (smaller spherical disproportion) with a focused region of high FDG uptake surrounded by a rim of low FDG uptake (higher GLSZMSZLGE) were associated with a better prognosis (Supplement Figure 2S). This confined FDG uptake could correlate with a less infiltrative phenotype. On the other hand, a rim of low FDG uptake could correspond to inflammation, which has been previously correlated to favorable prognosis in HNSCC [Citation20]. These radiomic features did not correlate with tumor volume, range of the SUV or maximum SUV. Additionally, in the studied cohorts of patients the standard PET measures, mean and maximum SUV, were not prognostic for tumor control. Moreover, other studies have shown that those standard PET measures correlate with tumor stage [Citation18,Citation21], whereas the predictions based on our PET radiomics model were independent of tumor stage (Supplement Figure 2S). This demonstrates, on a clinically relevant dataset, that radiomics is an added value in comparison to standard PET measures in terms of local tumor control prediction.
This study shows a link between CT radiomics, PET radiomics as well as combined PET and CT radiomics and local tumor control in head and neck cancer. It is contradictory to the study of Vallieres et al. [Citation19] in which no correlation between locoregional control and PET/CT radiomics was found. To translate our results to locoregional control modeling, the inclusion of additional parameters, for example lymph node-specific radiomics, should be considered. In our study, the combination of PET and CT radiomics as well as single modality radiomics resulted in equally good discriminative power of the local tumor control.
The detailed comparison of the single modality models revealed that despite the significant stratification into risk groups by both modalities, the CT radiomics model substantially overestimates the probability of tumor control in the high-risk group. The subgroup of patients, for whom the risk-group classification depended on image modality, was identified. Most of those cases (70%) was affected by the CT artifacts in the tumor region. Although, the slices with artifacts were removed from the radiomics analysis this procedure seems to have influenced the results. Those slices could have contained a crucial information about tumor heterogeneity. Another source of error could be a variable contrast dose between training and validation cohorts. In such a setting, PET radiomics, despite its low resolution, appears to be better suited for the prognostic modeling in head and neck region.
Data in the training cohort were acquired using different scanners as well as different scanning and reconstruction settings, which might have influenced the modeling. Validation of the models in the independent dataset with standardized imaging protocol suggests the models’ robustness, but it should be studied in more detail.
Further research in this area should be performed to address certain limitations of this study. A bigger dataset could be used for training a combined model to check for possible overfitting in the presence of the large number of input features. Additionally, this single institution study should be validated against multicenter data as well as interobserver variability of gross tumor volume definition [Citation22]. Moreover, it is known that not the entire tumor exhibits increased metabolic activity. Thus, parts of the tumor may have been missed by the autosegmentation. The PET-radiomics based on the treatment planning GTV could further improve the predictions. It would also eliminate a potential bias introduced by tumor progression between CT and PET scans [Citation23]. Previous works [Citation12–13] have shown that the inclusion of clinical parameters (tumor stage or volume) may result in more accurate predictions. However, so far other important clinical factors, such as smoking status or performance status, were not studied in combination with radiomics.
In conclusion, both CT and PET radiomics show potential to be a prognostic biomarker in head and neck cancer, with equally good discriminative power. However, the presence of CT artifacts may alter the CT-based predictions and therefore, radiomics-based outcome modeling in HNSCC appears to be more robust using 18F-FDG PET. Additionally, no benefit from combining CT and FDG-PET radiomics into one prognostic model was observed. Further validation of these results in a multicenter setting and against different CT artifacts correction protocols is needed.
Disclosure of interest
No potential conflict of interest was reported by the authors.
IONC_A_1346382_Supplementary_Information.zip
Download Zip (397.3 KB)Acknowledgments
The project was supported by the Clinical Research Priority Program Tumor Oxygenation of the University of Zurich, by a grant of the Matching Fund of the University of Zurich. The clinical study used as validation dataset was supported by a research grant from Merck (Schweiz) AG.
Additional information
Funding
References
- Ang KK, Harris J, Wheeler R, et al. Human papillomavirus and survival of patients with oropharyngeal cancer. N Engl J Med. 2010;363:24–35.
- Lassen P, Primdahl H, Johansen J, et al. Impact of HPV-associated p16-expression on radiotherapy outcome in advanced oropharynx and non-oropharynx cancer. Radiother Oncol. 2014;113:310–316.
- Svahn MF, Munk C, Nielsen TS, et al. Trends in all-cause five-year mortality after head and neck cancers diagnosed over a period of 33 years. Focus on estimated degree of association with human papillomavirus. Acta Oncol. 2016;55:1084–1090.
- Bentzen J, Toustrup K, Eriksen JG, et al. Locally advanced head and neck cancer treated with accelerated radiotherapy, the hypoxic modifier nimorazole and weekly cisplatin. Results from the DAHANCA 18 phase II study. Acta Oncol. 2015;54:1001–1007.
- Riesterer O, Milas L, Ang KK. Use of molecular biomarkers for predicting the response to radiotherapy with or without chemotherapy. J Clin Oncol. 2007;25:4075–4083.
- Kang H, Kiess A, Chung CH. Emerging biomarkers in head and neck cancer in the era of genomics. Nat Rev Clin Oncol. 2015;12:11–26.
- Toustrup K, Sorensen BS, Metwally MA, et al. Validation of a 15-gene hypoxia classifier in head and neck cancer for prospective use in clinical trials. Acta Oncol. 2016;55:1091–1098.
- Lambin P, Rios-Velazquez E, Leijenaar R, et al. Radiomics: extracting more information from medical images using advanced feature analysis. Eur J Cancer. 2012;48:441–446.
- Hatt M, Tixier F, Pierce L, et al. Characterization of PET/CT images using texture analysis: the past, the present any future? Eur J Nucl Med Mol Imaging. 2017;44:151–165.
- Yip SSF, Aerts HJWL. Applications and limitations of radiomics. Phys Med Biol. 2016;61:150–166.
- Wong AJ, Kanwar A, Mohamed AS, et al. Radiomics in head and neck cancer: from exploration to application. Transl Cancer Res. 2016;5:371–382.
- Bogowicz M, Riesterer O, Ikenberg K, et al. CT radiomics predicts HPV status and local tumor control after definitive radiochemotherapy in head and neck squamous cell carcinoma. Int J Rad Onc Biol Phys. Forthcoming 2017.
- Aerts HJWL, Velazquez ER, Leijenaar RTH, etet al. Decoding tumour phenotype by noninvasive imaging using a quantitative radiomics approach. Nat Commun. 2014;5:4006.
- Parmar C, Leijenaar RTH, Grossmann P, et al. Radiomic feature clusters and prognostic signatures specific for lung and head & neck cancer. Sci Rep. 2015;5:11004.
- Leijenaar RTH, Carvalho S, Hoebers FJ, et al. External validation of a prognostic CT-based radiomic signature in oropharyngeal squamous cell carcinoma. Acta Oncol. 2015;54:1423–1429.
- Jansen JF, Lu Y, Gupta G, et al. Texture analysis on parametric maps derived from dynamic contrast-enhanced magnetic resonance imaging in head and neck cancer. WJR. 2016;8:90–97.
- Shukla-Dave A, Lee NY, Jansen JF, et al. Dynamic contrast-enhanced magnetic resonance imaging as a predictor of outcome in head-and-neck squamous cell carcinoma patients with nodal metastases. Int J Radiat Oncol Biol Phys. 2012;82:1837–1844.
- Paidpally V, Chirindel A, Lam S, et al. FDG-PET/CT imaging biomarkers in head and neck squamous cell carcinoma. Imaging Med. 2012;4:633–647.
- Vallières M, Kay-Rivest E, Perrin LJ, et al. Radiomics strategies for risk assessment of tumour failure in head-and-neck cancer. arXiv:1703.08516.
- De Schutter H, Landuyt W, Verbeken E, et al. The prognostic value of the hypoxia markers CA IX and GLUT 1 and the cytokines VEGF and IL 6 in head and neck squamous cell carcinoma treated by radiotherapy +/- chemotherapy. BMC Cancer. 2005;5:42.
- Nesteruk M, Lang S, Veit-Haibach P, et al. Tumor stage, tumor site and HPV dependent correlation of perfusion CT parameters and [18F]-FDG uptake in head and neck squamous cell carcinoma. Radiother Oncol. 2015;117:125–131.
- Leijenaar RT, Carvalho S, Velazquez ER, et al. Stability of FDG-PET Radiomics features: an integrated analysis of test-retest and inter-observer variability. Acta Oncol. 2013;52:1391–1397.
- Jensen AR, Nellemann HM, Overgaard J. Tumor progression in waiting time for radiotherapy in head and neck cancer. Radiother Oncol. 2007;84:5–10.