
Abstract
Introduction: A significant part of patients with head and neck squamous cell carcinoma (HNSCC) develop recurrent disease after curative radiotherapy. We aimed to analyze loco-regional recurrence pattern by identifying possible points of recurrence origin by three different methods in relation to treatment volumes.
Material and methods: A total of 455 patients completed IMRT-based treatment for HNSCC from 2006 to 2012. A total of 159 patients had remaining cancer after IMRT, developed loco-regional recurrence or distant disease during follow-up. Among those, 69 patients with loco-regional recurrences had affirmative CT or PET/CT scan. Possible points of origin (POs) of the recurrences were identified on scans by two independent observers, estimated as center of mass and as maximum surface distance. The recurrence position was analyzed in relation to high-dose treatment volume (CTV1) and 95% of prescription dose.
Results: In total, 104 loco-regional recurrences (54 in T-site and 50 in N-site) were identified in 69 patients. Median time to recurrence for the 69 patients was 10 months. No clinically relevant difference was found between the four POs, with standard deviation between POs in x, y and z axes of 3, 3 and 6 mm. For recurrences inside CTV1, 0–5 mm and 5–10 mm outside CTV1 the standard deviation of dose differences between the POs were 1, 1.4 and 1 Gy, respectively. 56% and 25% of T-site and N-site recurrences were inside CTV1, respectively. Coverage by 95% prescription dose to high-dose treatment volume was achieved in 78% of T-site and 39% of N-site recurrences.
Conclusions: For recurrences identified by possible points of recurrence origin, no significant difference between observer-based or mathematically estimated methods was found. More than half of T-site recurrences were inside high-dose treatment volume, whereas N-site recurrences were mainly outside.
Introduction
During radiation treatment planning for head and neck squamous cell carcinoma (HNSCC), accurate identification of the treatment targets are required, thus identification of the area containing the highest tumor cell density (GTV). To account for the extension of microscopic disease and treatment uncertainties, additional margins are added (CTV and PTV, respectively). Radiotherapy provided by intensity-modulated radiotherapy (IMRT) is attractive because of the limited doses to noninvolved tissues and the high doses delivered to the targets [Citation1]. However, marginal misses are a potential risk of IMRT since the high-dose conformity has limited tolerance for unaccounted uncertainties. Some studies analyzing outcomes after curative treatment of HNSCC state that loco-regional recurrences tend to appear in high-dose treatment volumes; however, examples of marginal failures or failures outside high-dose areas has also been observed [Citation2–5]. The comparison of these studies is difficult because of heterogeneous patient groups and different ways of classifying the loco-regional recurrences.
The most common method used to analyze loco-regional recurrences is based on volume overlap with the primary target and/or intersection of the recurrence volume with the 95% isodose surface [Citation3,Citation6–8]. This method does not account for time between initial treatment planning and diagnosis of a recurrence and tend to place the recurrence in the periphery of the target volume, due to the growth of the recurring tumor [Citation9]. A less time-dependent approach for characterizing a loco-regional failure is to define a possible point of recurrence origin. Assuming that tumor growths isotropically around the point of initial failure, the center of mass (COM) of the recurrence volume can be used to identify the initial recurrence point [Citation10–11]. Nevertheless, recurrences often appear in irregular shapes, which make the COM method less obvious as representative for the initial recurrence point. Identification of the possible point of origin (PO) by an experienced observer is another method, which also incorporates clinical experience. A third option is calculation of the point inside the recurrence with the largest distance to the edge of the recurrence (maximum surface distance, MSD) [Citation12]. The technical purpose of this study was to compare all three point methods in order to evaluate the variability between these methods to estimate the initial point of recurrence. The clinical purpose of the study was to analyze the origin of CT or PET/CT confirmed local recurrences (LR) and regional recurrences (RR) estimated by the COM, PO and MSD methods, in relation to the delineated high-dose treatment volume (CTV1) and the 95% isodose volume.
Material and methods
Patient selection
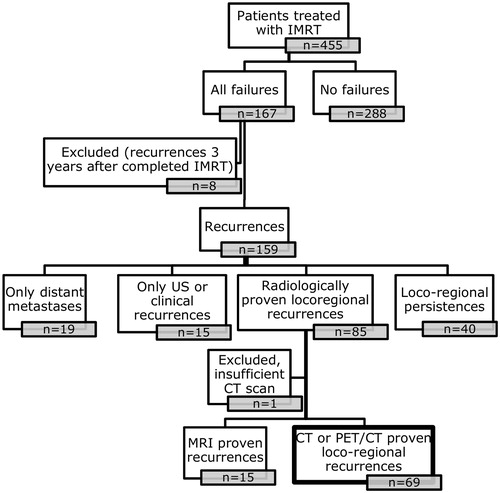
Between 2006 and 2012, 455 patients with larynx, oropharynx, hypopharynx and oral cavity squamous cell carcinoma completed curative intended IMRT at Odense University Hospital. In total, 167 patients were identified with loco-regional failure or distant metastases after curative intended IMRT. For the present point-of-recurrence study, a loco-regional recurrence was defined as a CT or PET-CT verified T- or N-site recurrence occurring after the patient was declared in clinical remission two month after end of treatment, but no later than three years after IMRT. With this definition, 69 patients with sufficient image-verified loco-regional recurrences were identified (one patient was not included due to incomplete visualization of recurrence), thus excluding 40 patients with persistent disease after treatment; 19 patients with distant metastases only and 30 patients with recurrences verified by other methods than CT or PET-CT ().
Figure 1. Flowchart for included HNSCC patients treated with definitive IMRT in 2006–2012.
This study was approved by the Data Protection Agency and the National Health Data Protection Agency.
Treatment planning and delivery
All patients were simulated in supine position using Orfit AIO five point Efficast mask fixed to the base or Aquaplast mask covering the head and shoulders, fixed to a Vacfix cushion [Citation13]. The planning CT (pCT) was performed according to a standard protocol: patients were scanned from the supraorbital margin to 4 cm below the clavicles, obtaining images with slice thickness of 3 mm using a source potential of 120 kV. Intravenous contrast (95 ml Optiray 300 mg/ml) was given if patients were medically fit for it.
Primary tumor (GTV-T) and metastatic lymph nodes (GTV-N) were identified by radiologist on pCT, guided by the images and the clinical examinations. The CTV1 included GTV-T and GTV-N with a margin of typically 0 mm. Depending on the disease location and the confidence in estimating the real extent of gross disease, CTV1 could be expanded and adjusted up to 10 mm or include an entire anatomical region (e.g. larynx) in accordance with the DAHANCA 2004 guidelines [Citation14]. Low-dose CTV was created according to international guidelines and adapted from Gregoire et al. [Citation15]. A planning target volume, PTV, was created by adding a 5 mm margin. The prescribed dose to CTV1 was 66-68 Gy delivered in 33–34 fractions, typically six fractions per week. The hypoxic radiosensitizer nimorazole and weekly concomitant cisplatin 40 mg/m2 was prescribed according to DAHANCA guidelines (www.dahanca.oncology.dk/Brows_Web_Guidelines).
All treatment plans were made in the treatment planning system Pinnacle (Philips Healthcare Fitchburg, WI). Patients were treated with step-and-shoot IMRT or VMAT (volumetric-modulated arc therapy) using simultaneously integrated boost. Before 2010, patients’ treatment plans consisted of 5 or 7 coplanar beam directions with a maximum of 50 segments. After 2010, a one arc VMAT technique, with a control point spacing of two degrees, were predominant. Both IMRT and VMAT were delivered by an Elekta Synergy Accelerator using 6 MV.
Tumor assessment and follow-up
Patients were followed from the date of entry at the cancer center and for up to five years. All patients had at least three years of follow-up and failures were recorded prospectively. Cut date for the present analysis was 13 January 2016. Outcome of treatment was evaluated two months after completion of the radiotherapy course. Neck ultrasound was routinely performed during the first two years in the follow-up period for patients with primary node-positive disease. During follow-up, patients underwent a complete clinical examination, including nasopharyngolaryngoscopy every three months in the first two years and every sixth month in the next three years. Medical imaging (CT, PET/CT, MRI or combinations of them) was performed if indicated.
Definition of loco-regional recurrence
Local T-site recurrence, LR, was defined as tumor tissue of the same histology and typically within the same region or within 2 cm from primary tumor (https://www.dahanca.oncology.dk/Brows_Web_Guidelines). Regional N-site recurrence, RR, was defined as any nodal recurrence in any neck level down to sternoclavicular junction. For the present study, the recurrences more than three years after treatment were not analyzed trying to avoid discriminating between recurrence and a second primary tumor [Citation16]. With this definition, 69 patients with sufficient image-verified loco-regional recurrences were identified.
Analysis of loco-regional radiologic recurrences
For all patients with LR and RR, the recurrent volume (Vrec) was identified on CT or PET/CT obtained after clinical suspicion of recurrence (rCT). The identification of the recurrences was guided by radiology reports, and if any discrepancies were recognized between report and images, a head and neck radiologist assisted in the definition of Vrec. Biopsies were performed in the majority of cases (63 out of 69). After retrieving the rCT, the images were transferred to the treatment planning system where a radiation oncologist delineated the recurrence volume (Vrec). In the present study, the origin of the recurrence was analyzed as a focal point. Three different methods were used to identify the possible recurrence origin (PO): (1) a point of origin defined on rCT by two independent radiation oncologists; (2) a center of mass of the Vrec (COM), the average voxel position evaluated over all voxels within the recurrence volume; (3) an estimated maximum surface distance (MSD) expressed as the point within Vrec with the largest distance to the recurrence surface.
Deformable image registration (DIR), using Elastix [Citation17], was used to coregister pCT and rCT. The Elastix software was previously validated for use in the head and neck region for this specific purpose, showing DIR uncertainty of three millimeters in this region [Citation18]. After visual validation of the DIR, recurrence structure and the four points of recurrence were transferred onto the pCT. The differences between four POs positions were analyzed in the three Cartesian coordinates to evaluate the distance between the POs. To relate POs locations to target volume boarders, the shortest distances between POs and CTV1 boundaries were determined. Similarly, the four points were analyzed in relation to the treatment volume, being the volume irradiated to 95% of the prescribed dose for the CTV1. Negative distances indicated point of recurrence inside the CTV1/treated volume while positive values classified the recurrence as outside the CTV1/treated volume. Derived from the DIR uncertainty [Citation18], a spherical margin with a 3 mm radius was created around POs to include the influence of the coregistration inaccuracy. Minimum doses within this 6 mm sphere were determined to compare to the doses given to the POs. Doses to the POs and minimum doses in the sphere were compared in four groups: inside CTV1, 0–5 mm outside CTV1, 5–10 mm outside CTV1 and >10 mm outside CTV1.
Statistical considerations
Descriptive statistics were used to describe patient, tumor and treatment characteristics. Standard deviation (SD) was used to illustrate the spread of POs in relation to each other and the spread of doses given to different PO. The correlation between different point placement and Vrec was measured by Pearson correlation coefficient.
Results
The median time to recurrence for 69 patients with only CT-verified loco-regional recurrences was 10 months (range 3–37 months). Patient, tumor and treatment characteristics are reported in .
Table 1. Patient, tumor and treatment characteristics (percentages are shown in brackets).
Among the 69 patients with loco-regional recurrences, 34 had only recurrence in T-site, 20 only in N-site and 15 in both T- and N-sites. There were 23 patients with more than one site of recurrence, resulting in 104 loco-regional recurrences in total (54 in T-site and 50 in N-site).
The median margin between GTV-CTV1, measured on the 69 pCTs, was 0 mm (range 0–16 mm) and in fact 0 mm was used in 80% of the patients.
The technical aspects
The POs were projected from the rCT onto the pCT utilizing the DIR vector field. The mean difference in POs placement in x, y, z coordinate system was close to zero millimeters and of no clinical significance. SD between point positions within a patient was approximately 3, 3 and 6 mm in x, y and z axis, respectively.
Median recurrence volume (Vrec) was 3.3 cm3, ranging from 0.1 to 84 cm3. The maximum volumes reached 46.4 cm3, except for one recurrence with extremely deviating volume of 84 cm3. Distance differences between the four POs positions were positively correlated with the Vrec (Pearson correlation coefficients: 0.3–0.8).
The clinical aspects
A histogram of the average POs distribution (for LR and RR) of the four methods in relation to different distances to CTV1 is shown in . The whiskers of each column in the histogram represent the range related to the four different estimates of point of recurrence origin. Equivalent histogram for all loco-regional recurrences is shown in Supplementary (Figure 4). The median distance for POs representing LR was −1.5 mm, indicating the origin of recurrence inside CTV1; the median distance for POs representing RR was 19.5 mm, indicating the origin of recurrence outside CTV1.
Figure 2. An average number of points of origin using all four methods distributed in different distances in relation to CTV1 margins. The whiskers indicate the range of the four PO methods. A: Local recurrences (LR); B: Regional recurrences (RR). Less than 0 mm defines POs inside CTV1, more than 0 mm- outside CTV1.
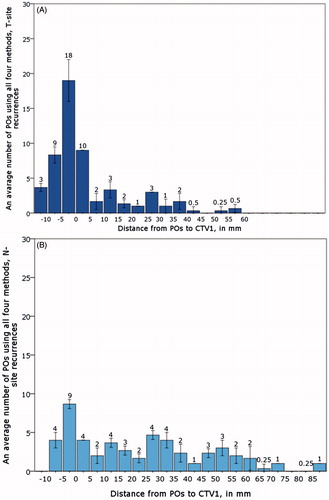
On average, 40% of loco-regional recurrences were identified inside CTV1 using all four measurements. The recurrences among the first 5 mm, 5–10 mm and ≥10 mm outside CTV1 accounted for 14%, 3% and 42% of recurrences, respectively. Fifty-nine percent of POs were covered by 95% of prescription dose to CTV1. On average, 56% of LRs were inside CTV1 and 78% was covered by 95% of prescription dose. However, only 25% of RRs were inside CTV1 and 39% of all N-site recurrences were cover by 95% of prescription dose. When splitting the recurrences in relation to their distances to CTV1, we observed that 99.6% of loco-regional recurrences were covered by 95% of prescription dose, except those located 10 mm or further from CTV1, where only 8% of recurrences were cover by 95% prescription dose. The same pattern was seen when analyzing T and N-site separately (). The locations of loco-regional recurrences in relation to CTV1 and the coverage of POs by 95% of prescription dose for LR and RR are depicted using Observer1 and COM as examples in , respectively, and using MSD and Observer 2 as examples in Supplementary (Figure 5(A,B).
Figure 3. A: Loco-regional recurrences identified by A: Observer1 (1: failures in T site; 2: failures in N site); B: Centre of mass (1: failures in T site; 2: failures in N site).
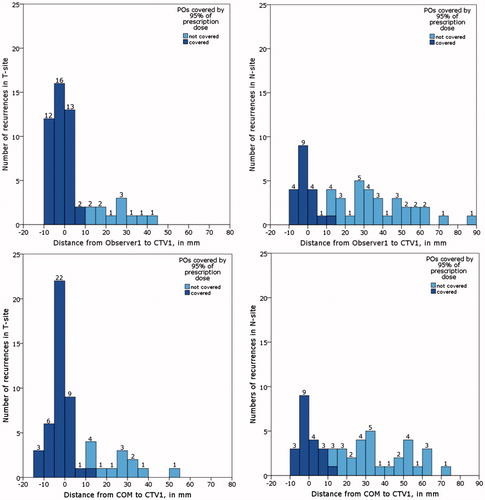
Table 2. Number of recurrences relative to distance of the CTV1 surface for each of recurrence point estimates.
The median doses given to POs as defined by Observer1, Observer2, COM and MSD were 65.8, 66.2, 66.0 and 66.1 Gy, respectively. In the recurrences located inside CTV1, 0–5 mm and 5–10 mm outside CTV1, the average SD of dose differences between all pairs of POs were approximately 1, 1.4 and 1 Gy, respectively, approximately 2% of the prescription dose. Corresponding dose differences for the PO and the minimum dose within the sphere of 6 mm in diameter were found for recurrences inside CTV1 (1.1 Gy) and those 5–10 mm outside CTV1 (1.2 Gy); however, in the dose fall-off region (0–5 mm from CTV1), there was substantial difference in point dose and minimum sphere dose (6.1 Gy difference). Analyzing the minimum doses of the 6 mm spheres around the POs in relation to 95% dose coverage, 54% of the recurrences were covered.
Discussion
This study is one of the largest studies assessing loco-regional recurrence locations after curative intended IMRT for HNSCC and analyzing them by identifying the possible point of recurrence origin. We analyzed CT-based loco-regional recurrences using three different methods and did not find clinically relevant differences in using observer identified or mathematically estimated possible points of recurrence origin.
After analyzing SD as a measure of the uncertainty of three-dimensional POs placement for all three methods, no significant difference was found between all four measurements in pairs, except that differences between POs placement were positively correlated with increasing recurrences volume. Average SD of the POs placement was approximately the size of few voxels (3, 3 and 6 mm). In the z direction, the SD was a factor two larger than in the image plan which presumably is related to CT slice thickness of 3 mm relative to the in-plane pixel size of 1 mm.
Generally, there are two main uncertainties in the method of recurrence identification in our study. Firstly, the differences in determining the point of origin: the subjective nature of PO identification by observers and mathematical estimations of recurrence origin. Secondly, the method of image registration and the uncertainty of DIR, that in our case is 3 mm [Citation18]. The period between planning and recurrence scans could vary from months to few years, and in many cases, the time gap was exceeding one year, with accompanying anatomical changes in the head and neck region through that time. Thus, the uncertainty of three millimeters and the difference between POs placement of few voxels are acceptable in the given situation.
The measurement of differences between the doses given to the four POs is another way to describe robustness of these methods. Still using the treatment planning dose as reference for the dose to the tumor, it is important to remember that the planned dose is not exactly the same as the delivered dose. There are uncertainties in the delivery process and also anatomical changes over the course of the 5.5-week-long treatment, which can influence the dose-delivery precision. We found that the differences between doses to the four POs inside CTV1 were equivalent to maximum 2% of the prescription dose. This difference is not clinically relevant as it does not exceed the 5% uncertainty in prescription dose that is generally acceptable for treatment planning.
The uncertainty of 3 mm due to DIR in the head and neck region [Citation18] was handled by adding a 6 mm sphere around the POs. Concerning recurrences inside CTV1, the analyses of the dose given to the PO and the minimum dose in the 6 mm sphere showed little difference in how many recurrences seemed to have received the prescribed dose in these two cases. This supports the robustness of the PO dose estimation, mostly inside CTV1. Just outside the CTV1, the mean differences between the POs dose and minimum doses in the sphere was 6.1 Gy; therefore, the dose estimate in this region is less robust, which would be expected due to inhomogeneous dose at the edge of the target volume.
Generally, in relation to the analysis of POs distances to CTV1 or dose coverage, there is no difference between all four PO’s observed. In the clinical practice, the locations of recurrences based on each PO would be almost the same; therefore, the choice of the point method will not influence a different clinical decision, despite of the differences in determining the point of recurrence origin (the subjective nature of PO identification by observers and only calculation-based mathematical estimations of recurrence origin).
Regarding the location of loco-regional failures, 40% of CT-verified loco-regional recurrences were found inside CTV1. If the persistent tumors would be added, which by nature are inside the CTV1, the failure rate inside CTV1 would increase to 69% of the number of local recurrences. However, the point of recurrence origin methods used in the present study are not applicable for persistent disease.
The number of CT-verified T- and N-site loco-regional recurrences inside high-dose treatment volume was lower than observed in other studies [Citation4,Citation10,Citation19]. The GTV-CTV1 margin in the present study was 0 mm in 80% of cases, whereas other centers use up to 10 mm margins around GTV or even the entire region harboring the tumor [Citation10–12]. If we had included the first 10 mm outside the CTV1 margin, 58% of all loco-regional recurrences would be included in CTV1 + 10 mm instead of 40%. Our data show that the recurrences are mostly covered by the prescribed dose in the proximity to the CTV1, suggesting resistance mechanisms, like hypoxic tumor cells and not failure to miss the target by IMRT.
Analyzing local and regional recurrences separately, we found that most of the CT-verified LR originated in the high-dose volume, whereas RR generally occurred outside the high-dose treatment volume. This difference in recurrence pattern between T and N site might be explained by different biological paths of tumor cell spread. LR appears mostly due to treatment-resistant cancer cells in the primary disease volume, with a spread infiltrating an area close to or inside the region. Our results showed that more than a half of all LR were inside the CTV1 and the majority was covered by 95% of prescribed dose to CTV1, suggesting tumor resistance as the main reason for treatment failure. In contrast, the majority of RR was outside CTV1 and could be explained by indirect cancer cells spread via lymphatic system into a much larger area. Bosch et al. analyzed regional failures in patients receiving IMRT without systemic treatment for larynx and pharynx cancer and found that 27 of 42 regional recurrences appeared in CTV1, 14 of 42 in the elective treatment volume and one outside the target volume [Citation20]. In our loco-regional recurrences cohort, a significant number of patients did not receive systemic treatment (78%), which theoretically could be related to a relative high number of regional failures outside CTV1. Secondly, different biologically equivalent doses (BED) given to the elective regions are also different in the studies analyzing the loco-regional recurrences pattern. The total doses and fractionation given to elective volume in DAHANCA results in BED 57.6 Gy (50 Gy in 33 fractions), whereas the regimes used in other studies usually have BED exceeding 60 Gy [Citation3,Citation7–8,Citation21] that could potentially influence the rate of N-site recurrences. Thirdly, there is a clear benefit of routinely follow-up the first years after treatment completion [Citation22]. In our institution, neck ultrasound examination was routinely performed during the first two years in the follow-up period for patients with primary node-positive disease that resulted in lead-time bias compared to clinical examination only. Histopathological identification of just a few tumor cells was registered as a recurrence. However, they might not be clonogenic and result in a true recurrence if they had only been observed by palpation. Finally, the present study included only CT-based recurrences, but 21% of loco-regional recurrences were identified either clinically or MRI based and that could potentially change the number of loco-regional recurrences inside the CTV1. We would expect that the pattern of recurrences identified by MRI to be the same as CT-based loco-regional recurrence pattern, whereas the recurrences lacking diagnostics by image modalities potentially introduce selection bias.
Concerning loco-regional failures in the head and neck region, margin expansion and dose escalation are debatable. The suggestion of minimal-to-zero margin for CTV1 has been made in some studies, where the majority of failures appear mostly in GTV or high-dose CTV [Citation10,Citation19]. The fraction of treatment failures in terms of persistent tumors could potentially be reduced by dose escalation. To date, dose escalations studies have shown fewer local recurrences, but failures may still appear inside the primary treatment volume [Citation23]. A possible way of detecting radiation resistant subvolumes of the tumor could potentially reduce this even further [Citation24,25].
In conclusion, after analyzing recurrences by identifying possible points of recurrence origin, we found no clinically relevant difference between observer-based or mathematically estimated methods. Most T-site recurrences are inside the high-dose treatment volume, whereas N-site recurrences are spread outside CTV1.
IONC_A_1346384_Supplementary_Information.zip
Download Zip (564.2 KB)Disclosure statement
No potential conflict of interest was reported by the authors.
Related Research Data
References
- Popovtzer A, Eisbruch A. Advances in radiation therapy of head and neck cancer. Expert Rev Anticancer Ther. 2008;8:633–644.
- Chen AM, Yu Y, Daly ME, et al. Long-term experience with reduced planning target volume margins and intensity-modulated radiotherapy with daily image-guidance for head and neck cancer. Head Neck. 2014;36:1766–1772.
- Shakam A, Scrimger R, Liu D, et al. Dose-volume analysis of locoregional recurrences in head and neck IMRT, as determined by deformable registration: a prospective multi-institutional trial. Radiother Oncol. 2011;99:101–107.
- Schoenfeld GO, Amdur RJ, Morris CG, et al. Patterns of failure and toxicity after intensity-modulated radiotherapy for head and neck cancer. Int J Radiat Oncol Biol Phys. 2008;71:377–385.
- Chen AM, Chin R, Beron P, et al. Inadequate target volume delineation and local-regional recurrence after intensity-modulated radiotherapy for human papillomavirus-positive oropharynx cancer. Radiother Oncol. 2017;123:412–418.
- Dawson LA, Anzai Y, Marsh L, et al. Patterns of local-regional recurrence following parotid-sparing conformal and segmental intensity-modulated radiotherapy for head and neck cancer. Int J Radiat Oncol. 2000;46:1117–1126.
- De Felice F, Thomas C, Barrington S, et al. Analysis of loco-regional failures in head and neck cancer after radical radiation therapy. Oral Oncol. 2015;51:1051–1055.
- Caudell JJ, Meredith RF, Spencer SA, et al. Margin on gross tumor volume and risk of local recurrence in head-and-neck cancer. Int J Radiat Oncol Biol Phys. 2010;76:164–168.
- Due AK, Korreman S, Bentzen SM, et al. Methodologies for localizing loco-regional hypopharyngeal carcinoma recurrences in relation to FDG-PET positive and clinical radiation therapy target volumes. Acta Oncol. 2010;49:984–990.
- Raktoe SA, Dehnad H, Raaijmakers CP, et al. Origin of tumor recurrence after intensity modulated radiation therapy for oropharyngeal squamous cell carcinoma. Int J Radiat Oncol Biol Phys. 2013;85:136–141.
- Ferreira BC, Marques RV, Khouri L, et al. Assessment and topographic characterization of locoregional recurrences in head and neck tumours [journal article]. Radiat Oncol. 2015;10:41.
- Due AK, Vogelius IR, Aznar MC, et al. Recurrences after intensity modulated radiotherapy for head and neck squamous cell carcinoma more likely to originate from regions with high baseline [18F]-FDG uptake. Radiother Oncol. 2014;111:360–365.
- Hansen CR, Christiansen RL, Nielsen TB, et al. Comparison of three immobilisation systems for radiation therapy in head and neck cancer. Acta Oncol. 2014;53:423–427.
- Hansen CR, Johansen J, Kristensen CA, et al. Quality assurance of radiation therapy for head and neck cancer patients treated in DAHANCA 10 randomized trial. Acta Oncol. 2015;54:1669–1673.
- Grégoire V, Coche E, Cosnard G, et al. Selection and delineation of lymph node target volumes in head and neck conformal radiotherapy. Proposal for standardizing terminology and procedure based on the surgical experience. Radiother Oncol. 2000;56:135–150.
- Lyhne NM, Johansen J, Kristensen CA, et al. Pattern of failure in 5001 patients treated for glottic squamous cell carcinoma with curative intent – a population based study from the DAHANCA group. Radiother Oncol. 2016;118:257–266.
- Klein S, Staring M, Murphy K, et al. elastix: a toolbox for intensity-based medical image registration. IEEE Trans Med Imaging. 2010;29:196–205.
- Zukauskaite R, Brink C, Hansen CR, et al. Open source deformable image registration system for treatment planning and recurrence CT scans: validation in the head and neck regio. Strahlenther Onkol. 2016;192:545–551.
- Dandekar V, Morgan T, Turian J, et al. Patterns-of-failure after helical tomotherapy-based chemoradiotherapy for head and neck cancer: implications for CTV margin, elective nodal dose and bilateral parotid sparing. Oral Oncol. 2014;50:520–526.
- van den Bosch S, Dijkema T, Verhoef LC, et al. Patterns of recurrence in electively irradiated lymph node regions after definitive accelerated intensity modulated radiation therapy for head and neck squamous cell carcinoma. Int J Radiat Oncol Biol Phys. 2016;94:766–774.
- Chajon E, Lafond C, Louvel G, et al. Salivary gland-sparing other than parotid-sparing in definitive head-and-neck intensity-modulated radiotherapy does not seem to jeopardize local control. Radiat Oncol. 2013;8:132.
- Pagh A, Grau C, Overgaard J. Failure pattern and salvage treatment after radical treatment of head and neck cancer. Acta Oncol. 2016;55:625–632.
- Leclerc M, Maingon P, Hamoir M, et al. A dose escalation study with intensity modulated radiation therapy (IMRT) in T2N0, T2N1, T3N0 squamous cell carcinomas (SCC) of the oropharynx, larynx and hypopharynx using a simultaneous integrated boost (SIB) approach. Radiother Oncol. 2013;106:333–340.
- Mortensen LS, Johansen J, Kallehauge J, et al. FAZA PET/CT hypoxia imaging in patients with squamous cell carcinoma of the head and neck treated with radiotherapy: results from the DAHANCA 24 trial. Radiother Oncol. 2012;105:14–20.
- Zschaeck S, Haase R, Abolmaali N, et al. Spatial distribution of FMISO in head and neck squamous cell carcinomas during radio-chemotherapy and its correlation to pattern of failure. Acta Oncol. 2015;54:1355–1363.