
Abstract
Background: Standardization protocols and guidelines for positron emission tomography (PET) in multicenter trials are available, despite a large variability in image acquisition and reconstruction parameters exist. In this study, we investigated the compliance of PET scans to the guidelines of the European Association of Nuclear Medicine (EANM). From these results, we provide recommendations for future multicenter studies using PET.
Material and methods: Patients included in a multicenter randomized phase II study had repeated PET scans for early response assessment. Relevant acquisition and reconstruction parameters were extracted from the digital imaging and communications in medicine (DICOM) header of the images. The PET image parameters were compared to the guidelines of the EANM for tumor imaging version 1.0 recommended parameters.
Results: From the 223 included patients, 167 baseline scans and 118 response scans were available from 15 hospitals. Scans of 19% of the patients had an uptake time that fulfilled the Uniform Protocols for Imaging in Clinical Trials response assessment criteria. The average quality score over all hospitals was 69%. Scans with a non-compliant uptake time had a larger standard deviation of the mean standardized uptake value (SUVmean) of the liver than scans with compliant uptake times.
Conclusions: Although a standardization protocol was agreed on, there was a large variability in imaging parameters. For future, multicenter studies including PET imaging a prospective central quality review during patient inclusion is needed to improve compliance with image standardization protocols as defined by EANM.
Background
Many studies have shown that 18F-fluorodeoxy glucose positron emission tomography (18F-FDG-PET) can be used for early response assessment [Citation1–5]. Treatment response is measured by the relative change in standardized uptake value (SUV) during treatment. Many factors affect SUV, such as patient preparation procedures, acquisition parameters and reconstruction parameters. Therefore, if response assessment using 18F-FDG-PET data is performed in multicenter studies, it is of utmost importance that acquisition and reconstruction are standardized. Also in preclinical research the development of PET as a predictive tool is desirable. However, reaching a high degree of reproducibility and sensitivity in small animal studies using FDG-PET is also challenging. Therefore, it is important to minimize methodological issues in preclinical as well as clinical studies as much as possible by standardize acquisition and reconstruction [Citation6].
In 2010, the European Association of Nuclear Medicine (EANM) published the tumor PET imaging guidelines version 1.0, which give a minimum standard for acquisition and reconstruction of FDG-PET scans [Citation7]. This protocol standardizes patient preparation, FDG dosage, reconstruction settings, data analysis and include a multicenter quality control phantom measurement procedure [Citation7–10].
In 2011, the multicenter randomized phase II NVALT12 (NCT01171170) study in stage IV non-small cell lung cancer started. Part of this study was an imaging sub-study, where repeated 18F-FDG-PET imaging for early response assessment was performed [Citation11]. In the NVALT12 protocol, it was assumed that the EANM 1.0 imaging guidelines had been implemented in the hospitals and that 18F-FDG-PET scans were performed according to these guidelines. EANM 1.0 reconstruction of the 18F-FDG-PET images was recommended, although reconstruction might be performed according to institutional standards and therefore variability in image parameters could be expected.
In this study, we investigated the quality of the 18F-FDG-PET scans in the NVALT12 study and the impact of deviations on the mean SUV of the liver. By identifying the sources of variability, we derived recommendations for future reduction of these uncertainties for early response assessment.
Material and methods
Between January 2011 and January 2013, a total of 223 patients were included in the NVALT12 study [Citation12]. The baseline 18F-FDG-PET scan was standard of care, and only for patients who had an 18F-FDG-PET at baseline as part of the standard work-up for lung cancer a second 18F-FDG-PET scan was performed. Scans were anonymized locally and per CD sent to the central hospital were the analysis was done. One hundred and sixty-seven baseline 18F-FDG-PET scans and 118 response 18F-FDG-PET scans were retrieved. Scans that could not be converted to SUV (i.e., SUV conversion information missing) were also excluded (baseline n = 9; response n = 9), which meant that only for 158 baseline scans and 109 response scans the SUVmean of the liver could be analyzed. The 18F-FDG-PET scans were obtained in a multicentric setting from 15 different hospitals using PET scanners from three different vendors: vendor A (Philips Healthcare, Best, the Netherlands), vendor B (GE Healthcare, Chicago, IL, USA) and vendor C (Siemens Healthineers, Erlangen, Germany).
For the quality analysis, we performed a Digital Imaging and Communications in Medicine (DICOM) header extraction to extract the radiopharmaceutical start time, series time, attenuation correction method, randoms correction method, scatter correction method, reconstruction method, convolution kernel width and matrix size.
To check the quality of the 18F-FDG-PET scans, the image acquisition and reconstruction parameters extracted from the DICOM header were compared to the acquisition and reconstruction parameters as recommended by the EANM 1.0. In the paragraphs below the EANM parameters that were used for the quality check are described.
Uptake time
The EANM 1.0 guidelines recommend that emission scanning should start 55–65 min after FDG administration. To test if the scans of a patient could be used for response assessment the Uniform Protocol for Imaging in Clinical Trials (UPICT) criteria were used. The UPICT protocol specifies that when a scan is repeated on the same patient, it is important that the uptake time is consistent with an acceptable variance of ±15 min, provided that both scans do not start before 55 min after FDG administration [Citation10]. The uptake time in our study was the difference in time between the radiopharmaceutical start time and the start of the PET acquisition (i.e., DICOM series time).
Corrections
In order to obtain the quantitative information from a 18F-FDG-PET scan, an attenuation correction and corrections for random and scatter coincidences are required [Citation13]. Different methods to correct for randoms and scatter exist, depending on the specific implementation at the scanner and the vendor. For this analysis, it was only checked if the correction was applied.
Image reconstruction
Based on a phantom study in 2008, most PET/CT scanners provide images with a spatial resolution close to 7 mm full width at half maximum (FWHM) when using the default by the manufacturer-recommended image reconstruction settings [Citation9]. Other settings, such as smoothing filters and image matrix size can be changed with preservation of a final image resolution of approximately 7 mm FWHM and harmonized interpretation and analysis of multicenter data is possible.
The scans in this study were performed on eight different PET scanners from three different vendors: 41% (69/167) of the scans were performed on a scanner of vendor A, 2% (4/167) on a scanner of vendor B and 56% (94/167) on a scanner of vendor C. For scans performed on a scanner of vendor B or C, the indicative reconstruction settings are a matrix size of 128 × 128 or 256 × 256, a post-reconstruction smoothing using a 5–6 mm FWHM Gaussian filter and a 2D/3D ordered subset expectation maximization (OSEM) reconstruction with the number of iterations times the number of subsets above 30. For scans performed on a scanner of vendor A, the indicative reconstruction settings are a matrix size of 144 × 144 and a line-of-response row-action-maximum likelihood-algorithm (LOR-RAMLA)/3D RAMLA/3D ordered-subset iterative time-of-flight (BLOB-OS-TF) reconstruction method. For reconstructions with point spread function (PSF) corrections, the post-reconstruction smoothing need to be increased to 7–8 mm.
Quality score
To check possible differences in PET quality between the different hospitals we scored every scan individually and calculated the average score of the scans per hospital. For every correct parameter, the scan received a point and the number of points per scan were divided by the number of known parameters for that scan, so missing data were excluded from the quality score.
Influence on SUV
To investigate the influence of image parameters on SUV, a spherical volume of interest with a diameter of 3 cm was delineated in the right lobe of the liver [Citation14]. A mean SUV of the liver between 1.3 and 2.5 was defined as a correct quality scan [Citation8].
Results
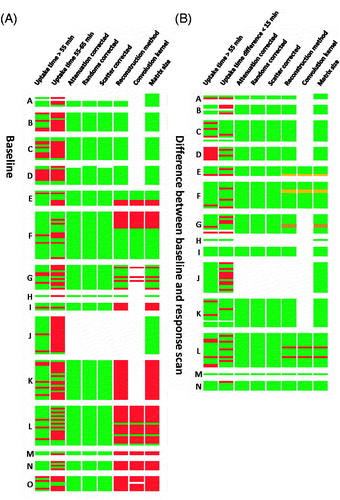
There were only a few scans with differences in reconstruction parameters between the baseline scan and the response scan; some patients had the baseline scan on a scanner of vendor C and the response scan on a scanner of vendor A (n = 2) and some other patients had the baseline scan without PSF and the response scan with PSF (n = 2) (see also ).
Figure 1. (A) Heatmap of the image parameters of the baseline scan ranked in descending order according to the quality score of the hospital. (B) Heatmap of the difference in image parameters between the baseline scan and the response scan ranked in descending order according to the quality score of the hospital. Green: EANM guideline compliant, white: missing information, orange: improved for response scan, red: EANM guideline non-compliant/worsened for response scan, striped: response scan on different scanner than baseline scan.
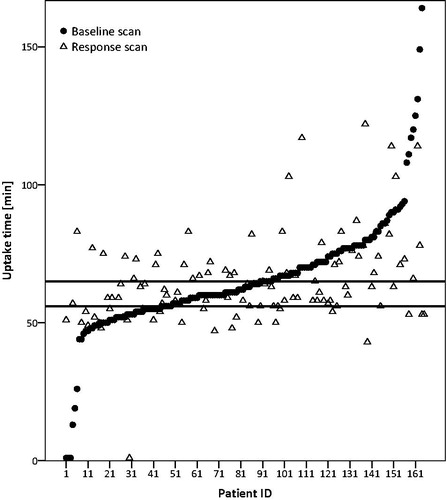
About one-third of the scans (35%; 97/280) of all scans had an uptake time between 55 and 65 min. Twelve percent (14/118) of the scans had an uptake time between 55 and 65 min for the baseline scan and for the response scan (). Due to the range in uptake time we calculated the median instead of the mean. The median uptake time was 64 min for the baseline scan as well as for the response scan (see also Table S1). In 11 patients both scans had an uptake time less than 55 min. In only 19% (53/285) of the patients, both scans had an uptake time of more than 55 min and a difference of less than 15 min between the two scans and could therefore be used for response assessment according to UPICT.
Figure 2. Time interval between injection and start time of scan per patient ranked in ascending order for the baseline scan. The horizontal lines show the NEDPAS specified maximum (65) and minimal (55) uptake times. One outlier (106; 251) is removed for visualization purposes.
The corrections for attenuation, random and scatter coincidences could be retrieved for 86% (144/167) of the baseline scans and for 78% (92/118) of the response scans (S1). For the other scans the information was missing. Scans that had missing information were from the same hospital (see also ).
About 50% of the baseline scans and 50% of the response scans performed on a scanner of vendor A were reconstructed according to the EANM 1.0 guidelines. For 24% of the baseline scans and 25% of the response scans performed on a scanner of vendor A the reconstruction method was missing. For the scans performed on a scanner of vendor B or C a large variability in reconstruction method existed. Thirty-three percent of the baseline scans and 37% of the response scans performed on a scanner of vendor B or C were reconstructed according to the EANM 1.0 guidelines. No reconstruction parameters were missing for the scans performed on a scanner of vendor B or C.
The average quality score over all hospitals was 0.69 (0.46; 0.88), which means that on average more than two-third of the image parameters were EANM 1.0 guideline compliant. Hospitals with a scanner of vendor A scored on average slightly higher than hospitals with a scanner of vendor B or C (vendor A: 0.80 (range: 0.56–0.88); vendor B/C: 0.64 (0.46–0.88)).
Although there was a large variability in image parameters, most scans had a SUVmean of the liver which was EANM 1.0 guideline compliant (64%; 171/267), only 5% (8/158) of the baseline scans and 2% (2/109) of the response scans had a SUVmean below 1.3. Twenty percent (53/267) of the scans had a SUVmean of the liver as well as an uptake time that was EANM 1.0 guideline compliant (Figure S2). There was no difference in mean SUVmean of the liver for baseline or response scans with an EANM 1.0 or UPICT compliant uptake time. When looking at the scans with a non-guideline compliant uptake time, the mean SUVmean of the liver is comparable 2.33 for the baseline scan and 2.23 for the response scan although the standard deviation is slightly increased 0.62 for the baseline scan and 0.49 for the response scan.
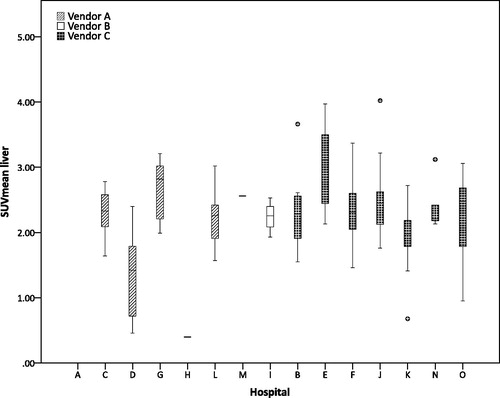
In , the hospitals were ranked in descending order according to their quality score and there seems no trend between the quality score of the hospital and the variability in SUVmean of the liver. No difference in SUVmean of the liver was found for the different vendors.
Figure 3. Boxplot of SUVmean of the liver of the baseline scan ranked in descending order according to the quality score and per vendor, the scans of hospital A were, due to a missing SUV conversion tag, not converted to SUV and are therefore empty in the graph.
Discussion
Despite the availability of imaging guidelines for 18F-FDG-PET [Citation7–10,Citation15], our analysis shows that a large variability in image acquisition and reconstruction parameters existed in the 18F-FDG-PET scans of the multicenter NVALT12 trial. In this study, we investigated the number of 18F-FDG-PET scans of the NVALT12 study that were EANM 1.0 guideline compliant and the impact of deviations on SUV. Next to that, we speculate about possible reasons for deviations from this guideline.
The EANM 1.0 guideline recommend that PET imaging takes place 60 ± 5 min after administration of FDG [Citation9]. This uptake time window is essentially empiric and determined taken financial considerations into account, and probably not optimal [Citation15]. It is well known that lesion SUV for FDG continues to rise for at least 45 min after FDG injection, reaching a plateau between 60 and 90 min [Citation16,Citation17]. In our study, only 34% of all scans had an uptake time as recommended by the EANM 1.0. With that we show that in clinical practice it is hard to have an uptake time within the recommended window of 10 min. In the EANM guidelines version 2.0, this is changed to an acceptable uptake time window of 55–75 min, 59% of the scans in this study had an uptake time within this window. Another possible reason for deviations is that the radiopharmaceutical start time extracted from the DICOM header was not the time of FDG administration as we assumed. Because it is currently not possible to separately store information on injection time and calibration time in the DICOM header, some ambiguity which time is in the DICOM header under the name radiopharmaceutical start time exists [Citation18].
Reconstruction algorithms and voxel size are different for the various available PET systems and vendor dependent. Therefore, it is a challenge to ensure that images of PET scanners from different vendors are quantitatively comparable [Citation15]. Multiple studies have shown that liver metabolism can be used as reference organ due to its stable uptake over time and therefore suitable for assessment of scan parameters [Citation18]. We therefore used the SUVmean of liver as quality control measure. However, our results did not show a relation between the quality score and SUVmean of the liver. Kuhnert et al. [Citation19] showed that for parameters other than reconstruction method and settings (injected activity and uptake time for example), the SUVmean of the liver could be used for quality assessment in compliance with the EANM guideline, meaning that the large variability in SUVmean of the liver is most probably caused by the differences in uptake time and net injected activity. We showed that like Hristova et al. [Citation18] the variability in SUVmean of the liver is slightly smaller for the scans with a guideline compliant uptake time than for the scans with non-compliant uptake times (SUVmean 2.29 ± 0.46 vs. 2.33 ± 0.62).
The hospital analysis showed that the average score over all hospitals is 0.69 and that scans from the same hospital mostly have the same non-compliant image parameters. Scans with missing parameters are typically from the same hospitals which is most probably caused by the anonymization procedure.
Our study shows that in a multicenter trial still a large variability in image parameters exist. Especially when using the PET information for treatment decisions, like in dose painting the high uptake region [Citation20], it is important that acquisition and reconstruction are standardized, otherwise different sub-volumes will be boosted. When more complex analysis methods (e.g., Radiomics) are used to predict therapy response using PET in the future, it is important that image acquisition and reconstruction are standardized [Citation21]. A study of Carvalho et al. [Citation22] investigated next to common PET descriptors like SUVmax and SUVpeak if more complex descriptors like intensity volume histograms of the PET signal are prognostic in NSCLC. They only found a trend that patients with tumors with a more homogeneous distribution of SUV had a better prognosis [Citation22]. Although they only had data from one hospital, the image protocol changed during inclusion criteria and therefore variability in SUV could be present what could have caused the non-significance of SUVmax for prognosis.
A few recommendations for future multicenter studies with repeated PET imaging are drawn. For drafting the study protocol, it is recommended to collaborate with radiologists and nuclear medicine experts to assure access to the current imaging guidelines to keep the variability in image acquisition and reconstruction parameters as low as possible. Next, it is recommended to use an anonymization process that keeps all DICOM fields necessary for SUV quantification and investigation of the acquisition and reconstruction parameters. For calculating the uptake time, take the acquisition time near the midplane slice of the tumor. A final recommendation in a multicenter trial setting using 18F-FDG-PET involves a prospective rapid quality review, which is a good procedure to improve compliance with imaging guidelines and tackle difficulties in image sharing and processing as early as possible [Citation18]. More details of these recommendations can be found in Table S3.
In conclusion, although guidelines for tumor imaging exist, there is still a large variability in acquisition and reconstruction parameters of 18F-FDG-PET imaging in multicenter studies. In the future, these variations should be minimized by performing a rapid quality review that tackle difficulties in image sharing and processing as early as possible.
IONC_A_1346824_Supplementary_Information.zip
Download Zip (441.2 KB)Disclosure statement
Author AD is advisory board member of Roche, Eli Lilly, Astra Zeneca, MSD and Pfizer. Author PL acknowledge financial support from ERC advanced grant (ERC-ADG-2015, n° 694812 – Hypoximmuno), the QuIC-ConCePT project, which is partly funded by EFPI A companies and the Innovative Medicine Initiative Joint Undertaking (IMI JU) under Grant Agreement No. 115151. Author PL also acknowledge financial support from the EU Seventh Framework Program (ARTFORCE – no. 257144), Kankeronderzoekfonds Limburg from the Health Foundation Limburg and the Dutch Cancer Society and the Dutch technology Foundation STW (grant n° 10696 DuCAT, no. P14-19 Radiomics STRaTegy). The authors EJ, WE, OH, HG, ES and RB report no conflicts of interest.
Additional information
Funding
Related Research Data
References
- van Elmpt W, Ollers M, Dingemans AM, et al. Response assessment using 18F-FDG PET early in the course of radiotherapy correlates with survival in advanced-stage non-small cell lung cancer. J Nucl Med. 2012;53:1514–1520.
- de Geus-Oei LF, van der Heijden HF, Visser EP, et al. Chemotherapy response evaluation with 18F-FDG PET in patients with non-small cell lung cancer. J Nucl Med. 2007;48:1592–1598.
- Dingemans AM, de Langen AJ, van den Boogaart V, et al. First-line erlotinib and bevacizumab in patients with locally advanced and/or metastatic non-small-cell lung cancer: a phase II study including molecular imaging. Ann Oncol. 2011;22:559–566.
- Ramanathan RK, Goldstein D, Korn RL, et al. Positron emission tomography response evaluation from a randomized phase III trial of weekly nab-paclitaxel plus gemcitabine versus gemcitabine alone for patients with metastatic adenocarcinoma of the pancreas. Ann Oncol. 2016;27:648–653.
- Hendlisz A, Golfinopoulos V, Garcia C, et al. Serial FDG-PET/CT for early outcome prediction in patients with metastatic colorectal cancer undergoing chemotherapy. Ann Oncol. 2012;23:1687–1693.
- Busk M, Munk OL, Jakobsen S, et al. FDG-PET reproducibility in tumor-bearing mice: comparing a traditional SUV approach with a tumor-to-brain tissue ratio approach. Acta Oncol. 2017;17:1–10.
- Boellaard R, O'doherty MJ, Weber WA, et al. FDG PET and PET/CT: EANM procedure guidelines for tumour PET imaging: version 1.0. Eur J Nucl Med Mol Imaging. 2010;37:181–200.
- Boellaard R, Delgado-Bolton R, Oyen WJ, et al. FDG PET/CT: EANM procedure guidelines for tumour imaging: version 2.0. Eur J Nucl Med Mol Imaging. 2015;42:328–354.
- Boellaard R, Oyen WJ, Hoekstra CJ, et al. The Netherlands protocol for standardisation and quantification of FDG whole body PET studies in multi-centre trials. Eur J Nucl Med Mol Imaging. 2008;35:2320–2333.
- Graham MM, Wahl RL, Hoffman JM, et al. Summary of the UPICT protocol for 18F-FDG PET/CT imaging in oncology clinical trials. J Nucl Med. 2015;56:955–961.
- de Jong EE, van Elmpt W, Leijenaar RT, et al. [18F]FDG PET/CT-based response assessment of stage IV non-small cell lung cancer treated with paclitaxel–carboplatin–bevacizumab with or without nitroglycerin patches. Eur J Nucl Med Mol Imaging. 2017;44:8–16.
- Dingemans AM, Groen HJ, Herder GJ, et al. A randomized phase II study comparing paclitaxel–carboplatin–bevacizumab with or without nitroglycerin patches in patients with stage IV nonsquamous nonsmall-cell lung cancer: NVALT12 (NCT01171170)dagger. Ann Oncol. 2015;26:2286–2293.
- Herraiz JL, Sitek A. Sensitivity estimation in time-of-flight list-mode positron emission tomography. Med Phys. 2015;42:6690–6702.
- Wahl RL, Jacene H, Kasamon Y, et al. From RECIST to PERCIST: evolving considerations for PET response criteria in solid tumors. J Nucl Med. 2009;50(Suppl 1):122S–150S.
- Graham MM, Badawi RD, Wahl RL. Variations in PET/CT methodology for oncologic imaging at US academic medical centers: an imaging response assessment team survey. J Nucl Med. 2011;52:311–317.
- Beaulieu S, Kinahan P, Tseng J, et al. SUV varies with time after injection in (18)F-FDG PET of breast cancer: characterization and method to adjust for time differences. J Nucl Med. 2003;44:1044–1050.
- Binns DS, Pirzkall A, Yu W, et al. Compliance with PET acquisition protocols for therapeutic monitoring of erlotinib therapy in an international trial for patients with non-small cell lung cancer. Eur J Nucl Med Mol Imaging. 2011;38:642–650.
- Hristova I, Boellaard R, Vogel W, et al. Retrospective quality control review of FDG scans in the imaging sub-study of PALETTE EORTC 62072/VEG110727: a randomized, double-blind, placebo-controlled phase III trial. Eur J Nucl Med Mol Imaging. 2015;42:848–857.
- Kuhnert G, Boellaard R, Sterzer S, et al. Impact of PET/CT image reconstruction methods and liver uptake normalization strategies on quantitative image analysis. Eur J Nucl Med Mol Imaging. 2016;43:249–258.
- Di Perri D, Lee JA, Bol A, et al. Evolution of [18F]fluorodeoxyglucose and [18F]fluoroazomycin arabinoside PET uptake distributions in lung tumours during radiation therapy. Acta Oncol. 2017;56:516–524.
- Larue RT, Defraene G, De Ruysscher D, et al. Quantitative radiomics studies for tissue characterization: a review of technology and methodological procedures. Br J Radiol. 2017;90:20160665.
- Carvalho S, Leijenaar RT, Velazquez ER, et al. Prognostic value of metabolic metrics extracted from baseline positron emission tomography images in non-small cell lung cancer. Acta Oncol. 2013;52:1398–1404.