
Abstract
Background: Most solid tumors contain inadequately oxygenated (i.e., hypoxic) regions, which tend to be more aggressive and treatment resistant. Hypoxia PET allows visualization of hypoxia and may enable treatment adaptation. However, hypoxia PET imaging is expensive, time-consuming and not widely available. We aimed to predict hypoxia levels in non-small cell lung cancer (NSCLC) using more easily available imaging modalities: FDG-PET/CT and dynamic contrast-enhanced CT (DCE-CT).
Material and methods: For 34 NSCLC patients, included in two clinical trials, hypoxia HX4-PET/CT, planning FDG-PET/CT and DCE-CT scans were acquired before radiotherapy. Scans were non-rigidly registered to the planning CT. Tumor blood flow (BF) and blood volume (BV) were calculated by kinetic analysis of DCE-CT images. Within the gross tumor volume, independent clusters, i.e., supervoxels, were created based on FDG-PET/CT. For each supervoxel, tumor-to-background ratios (TBR) were calculated (median SUV/aorta SUVmean) for HX4-PET/CT and supervoxel features (median, SD, entropy) for the other modalities. Two random forest models (cross-validated: 10 folds, five repeats) were trained to predict the hypoxia TBR; one based on CT, FDG, BF and BV, and one with only CT and FDG features. Patients were split in a training (trial NCT01024829) and independent test set (trial NCT01210378). For each patient, predicted, and observed hypoxic volumes (HV) (TBR > 1.2) were compared.
Results: Fifteen patients (3291 supervoxels) were used for training and 19 patients (1502 supervoxels) for testing. The model with all features (RMSE training: 0.19 ± 0.01, test: 0.27) outperformed the model with only CT and FDG-PET features (RMSE training: 0.20 ± 0.01, test: 0.29). All tumors of the test set were correctly classified as normoxic or hypoxic (HV > 1 cm3) by the best performing model.
Conclusions: We created a data-driven methodology to predict hypoxia levels and hypoxia spatial patterns using CT, FDG-PET and DCE-CT features in NSCLC. The model correctly classifies all tumors, and could therefore, aid tumor hypoxia classification and patient stratification.
Introduction
Hypoxia is one of the important factors influencing treatment outcome in cancer patients. Most solid tumors contain hypoxic, poorly oxygenated, regions, which are prone to be more radioresistant, chemoresistant and aggressive. This is due to multiple features such as an altered metabolism, increased resistance to cell death, increased angiogenesis and invasiveness, and tendency to metastasize [Citation1–3].
Although hypoxic tumors are less sensitive to conventional treatments, they might benefit from specially designed targeted treatments such as hypoxia activated prodrugs or the inhibition of molecular targets in hypoxic cells [Citation1–4]. Other approaches include increasing the radiotherapy dose in the hypoxic areas to overcome radioresistance [Citation5,Citation6], or adding radiosensitizers to radiotherapy treatment [Citation7]. To select patients that will benefit the most from these targeted strategies, in clinical routine, as well as in clinical trials, there is a need for noninvasive techniques that can reliably detect hypoxia. In most clinical trials, patients are not stratified by hypoxia status and therefore these trials most likely do not demonstrate the full potential of hypoxia targeting strategies.
The most studied noninvasive techniques to visualize hypoxia make use of PET tracers based on 2-nitroimidazoles labeled with fluorine-18, e.g., 18F-MISO, 18F-FAZA and 18F-HX4 [Citation8]. In the absence of oxygen, the reduction of nitroimidazoles cannot be reversed and the reactive product gets trapped in the hypoxic cell. Other studied imaging techniques make use of more indirect ways of assessing hypoxia. Perfusion and diffusion based approaches, e.g., have been suggested as surrogates for hypoxia, since the delivery of oxygen to tumors is regulated by blood supply. CT-based perfusion techniques, dynamic contrast-enhanced CT (DCE-CT), as well as MRI-based modalities, DCE-MRI or diffusion weighted MRI (DW-MRI), have been proposed. However, hypoxia is not only influenced by perfusion; perfusion markers cannot visualize the ability of blood to carry and release oxygen or the oxygen consumption rate of cells. 18F-FDG PET has been suggested as another indirect marker of hypoxia [Citation9]. Hypoxic cells have to resort to the less efficient glycolysis for their energy production resulting in an upregulated metabolism that can be visualized with the commonly used FDG PET tracer. Unfortunately, cancer cells tend to predominately rely on glycolysis even under well-oxygenated conditions, hindering the distinction between hypoxic and non-hypoxic tumor cells [Citation10].
PET tracers based on 2-nitroimidazoles are the most studied and most direct way of in vivo visualizing of hypoxia. However, so far, these PET images have only been used in research or clinical trial setting, as they are not widely available, expensive and time-consuming. In this study, we investigated the possibility of replacing a 2-nitroimidazole PET tracer by alternative indirect hypoxia markers that are more accessible. We aimed to predict hypoxia levels in patients with non-small cell lung cancer (NSCLC) tumors, assessed with HX4 PET, by using FDG PET/CT and dynamic contrast-enhanced CT imaging.
Material and methods
Patient selection
Stage IB-IV NSCLC patients were included in two prospective clinical trials (PET Boost trial: NCT01024829 [Citation11]; Nitroglycerin trial: NCT01210378). The pretreatment imaging protocol was identical for both clinical studies, including a planning FDG PET/CT, hypoxia HX4 PET/CT and DCE-CT. The HX4 PET/CT and DCE-CT scans were preferably scheduled on the same day; FDG and HX4 PET/CT scans were always planned on different days. The three scans were planned within the same week before radiotherapy for all except one patient; the time between scans ranged from 1 to 11 days. All patients gave written informed consent and both studies were approved by the Medical Ethics Review Committee. For our analysis, we selected all patients with images of all treatment modalities available.
Image acquisition and pre-processing
All scans were performed in treatment position on a flat table top with the same arm and knee supports used during radiotherapy treatment.
Planning FDG PET/CT
A 4D respiratory gated FDG PET/CT was acquired one hour after injection of approximately 197 ± 43 MBq FDG tracer, according to the NEDPAS protocol [Citation12], on a Siemens Biograph 40 PET/CT scanner (Siemens Healthcare, Erlangen, Germany). The mid-ventilation phase of the 4D CT scan was used for attenuation correction. Furthermore, PET scans were corrected for scatter and random coincidences. The PET images were reconstructed in voxels of 4 × 4 mm in-plane with a slice thickness of 3 mm using an OSEM or PSF algorithm. The voxels of the CT were 1 × 1 by 3 mm. The gross tumor volume (GTV) was delineated on the fused PET/CT by an experienced radiation oncologist. Finally, standardized uptake values (SUV) were calculated by correcting the measured uptake for body weight, injected dose and decay.
Hypoxia HX4 PET/CT
A 2-nitroimidazole based PET tracer, [18F]HX4 (3-[18F]fluoro-2-(4-((2-nitro-1H-imidazol-1-yl)methyl)-1H-1,2,3-triazol-1-yl)propan-1-ol), from here on referred to as HX4 [Citation13–15], was used to acquire hypoxia PET images. The patients were scanned four hours post-injection of approximately 417 ± 77 MBq of HX4 on a Gemini TF64 PET/CT scanner (Philips, Amsterdam, The Netherlands). Scans were corrected for attenuation using a low-dose CT scan, and corrected for scatter and random coincidences. The voxels of the reconstructed PET images (BLOB-OS-TF with three iterations and 33 subsets) had an in-plane size of 4 × 4 mm and slice thickness of 4 mm. The PET uptake in the aortic arch was measured to calculate the tumor-to-background ratio (TBR), which was defined as the SUV in the tumor divided by the SUVmean in the aortic arch.
Dynamic contrast-enhanced CT
For the DCE-CT images, patients were injected with 60 or 65 ml of an iodine-based contrast material (Iopromide 300, Bayer Healthcare, Berlin, Germany), followed by a saline chaser of 30 ml or 40 ml. Both at a flow rate of 7 ml/s. The patients were scanned on a second or third generation dual source scanner (SOMATOM Definition Flash or SOMATOM Force, Siemens Healthcare, Erlangen, Germany). Every 1.5 s 80 kV CT scans of primary tumor were acquired for 33 consecutive frames. Patients were asked to hold their breath in expiration breath-hold as long as possible and otherwise continue shallow breathing. Scans were reconstructed with a B20f filter with a slice thickness of 5 mm. All 33 frames were aligned to the first slice using a deformable fluid-based registration algorithm (syngo MMWP, version VE40A; Siemens, Erlangen, Germany).
Next, kinetic analysis was performed on the DCE-CT scans, using a deconvolution approach (adiabatic approximation to the tissue homogeneity model; ATH) [Citation16,Citation17]. The images were smoothed with a median 5 filter and resampled to a 256 × 256 grid. A region of interest was delineated in the aortic arch to determine the arterial input function. Finally, parametric maps were calculated for tumor blood flow (BF; ml/100 g/min) and blood volume (BV; ml/100 g).
Image registration and supervoxels
The images of all modalities were mapped onto the planning CT scan using a rigid alignment followed by a non-rigid registration using the open source software Elastix [Citation18,Citation19]. Voxels were resampled to the in-plane dimensions of the CT to create isotropic voxels. Next, homogeneous patches, preserving local image boundaries, were created by grouping voxels based on their CT Hounsfield units and FDG SUV, see . These clusters of voxels, i.e., supervoxels, were introduced to reduce noise, reduce the amount of data and to minimize the effect of registration uncertainties. Supervoxels were generated using an adapted k-means clustering algorithm called Simple Linear Iterative Clustering (SLIC [Citation20]). This freely available algorithm was tuned to create supervoxels with a size of 400 voxels (typically 0.4 cm3) and compactness of 20. For further analysis, we included all supervoxels with at least 90% of their voxels in the GTV. Supervoxels with high residuals in the DCE-CT kinetic analysis (>100 × 33 (number of DCE-CT frames)) were excluded from further analysis.
Figure 1. An example patient from the test set with the different imaging modalities, the supervoxel pre-processing and hypoxia images. On the top row, the images that are used as model input: CT, FDG PET, DCE-CT blood flow and blood volume, overlaid on the planning CT. Clustering is performed on the CT and FDG PET data to create supervoxels (solid line). For each supervoxel, the mean, standard deviation and entropy are calculated for each input imaging modality (dashed line). These features are combined in a random forest model to predict hypoxia TBR for every supervoxel. The missing values at the top of the GTV (the contoured structure) in the prediction image are supervoxels with high DCE-CT residuals (e.g., motion) and therefore excluded from analysis.
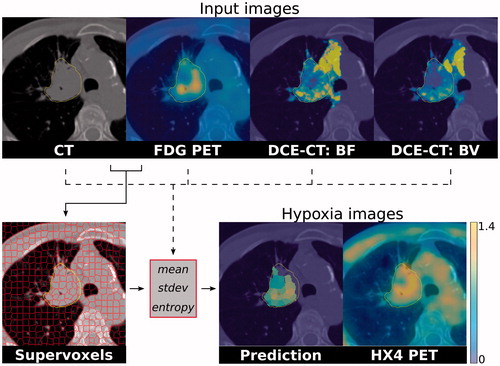
For every supervoxel, the median, standard deviation and entropy of all voxels in the supervoxels were calculated for the CT (HU), FDG PET (SUV), BF (ml/100 g/min) and BV (ml/100 g). In addition, the median HX4 TBR was determined in every supervoxel.
Building a random forest
Random forest models were trained in R (version 3.3.2, Vienna, Austria) to predict hypoxia TBR inside a supervoxel based on CT, FDG PET, BF and BV features. For this purpose, patients were split in a training set (trial NCT01024829) and independent test set (trial NCT01210378). All supervoxels of the tumors in the training set were grouped, likewise for the supervoxels in the test set. The numbers of trees in the random forest were fixed to 500. Cross validation of 10 folds and five repeats was applied to tune one model parameter, i.e., number of variables randomly sampled at each split, and to evaluate the performance of the final model. Two models were trained: one containing all features of the CT, FDG PET, BF and BV, and one with only the CT and FDG PET features. Finally, a multivariable linear regression model was trained to serve as benchmark for the random forest models.
Predicting tumor hypoxic volume
The predicted hypoxia TBR values for all supervoxels for each patient in the test set were used to determine the hypoxic volume (HV). First, the outputs of the random forest models were calibrated by refitting the prediction of the training set with a linear regression and applying the fit to the prediction of the supervoxels in the test set. Next, all supervoxels with a predicted TBR >1.2 were defined as hypoxic and summed for the patients in the test set. We chose a threshold of 1.2 in the absence of a standardized threshold. Predicted HVs were compared to the observed HVs based on the HX4 PET/CT scans. Tumors with a HV larger than 1 cm3 were classified as hypoxic. The 1 cm3 threshold was introduced to have a robust metric that takes into account the imaging noise and limited resolution of the imaging modalities.
Evaluating supervoxels
One extra random forest was trained to quantify the influence of the supervoxel over-segmentation on model performance and to evaluate the need for this pre-processing step. For this, no supervoxels were calculated and the FDG PET and DCE-CT parameter maps were rescaled to the planning CT scan resolution. Voxels with high DCE-CT residuals were again excluded; all other voxels were used to train and validate the model.
Results
In total, we included 34 NSCLC patients (age 65 ± 8 years) who all received an FDG and an HX4 PET/CT as well as a DCE-CT scan. The median GTV was 49 cm3 (interquartile range (IQR) 25–91 cm3). More patient and tumor characteristics are provided in . The GTVs were subdivided in a median 92 (IQR 41–174) supervoxels per patient. The training set contained 15 patients, with a total of 3291 supervoxels, while the test cohort consisted of 19 patients with a total of 1502 supervoxels, see . The supervoxels contained on average 405 ± 76 voxels (0.4 ± 0.1 cm3). An example patient, with the different imaging modalities and the supervoxel segmentation is shown in .
Table 1. Patient and tumor characteristics for all patients together, for the training and test patients.
The supervoxel approach retains spatial information, while improving the signal-to-noise ratio. From the predicted TBR values for each supervoxel, hypoxia parameter maps can be reconstructed for a tumor. In , such a hypoxia map is shown for the best performing random forest model using all imaging features. The predicted hypoxia map shows a visually similar pattern compared to the hypoxia PET/CT scan.
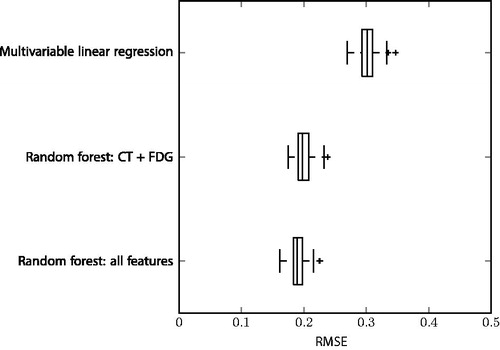
The random forest model with all features (n = 12) gave the best performance with a root-mean-square error (RMSE) in hypoxia TBR prediction of 0.19 ± 0.01 for the training set, and 0.27 for the test set. The random forest with only CT and FDG features (n = 6) had a slightly worse performance with a RMSE of 0.20 ± 0.01 for training and 0.29 for the test set. The restricted random forest model still outperformed the multivariable linear regression with all features (training RMSE: 0.30 ± 0.02; test RMSE: 0.43). In , the RMSE of the models are compared. The random forest directly trained on voxel values, i.e., without using supervoxel pre-processing, had a higher RMSE compared to both supervoxel random forest models with 0.26 ± 0.00 on the training data and 0.30 on validation.
Figure 2. Boxplots comparing the root mean square error (RMSE) of the three different models. The models are ranked from worst to best performance on the training set based on cross-validation (10 folds, five repeats).
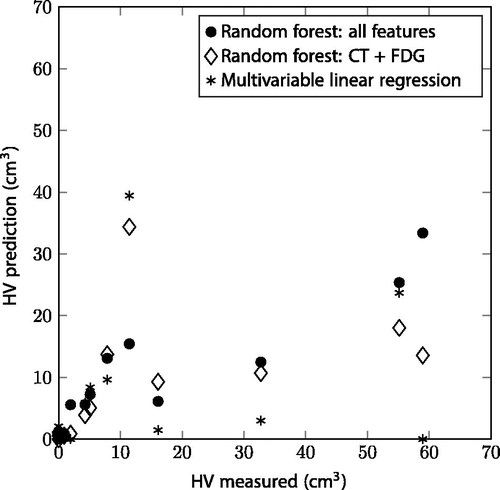
The hypoxic areas based on the HX4 PET measurements had a median volume of 1.4 cm3 (IQR 0–10.6 cm3) for the 18 patients in the test set. For one of the patients, all supervoxels had a high DCE-CT residual and were excluded from the analysis. The measured HVs and predicted volumes had an absolute median difference of 1.1 cm3 (IQR 0.1–4.9 cm3) for the random forest with all features, 0.8 cm3 (IQR 0.0–6.6 cm3) for the restricted random forest model and 1.7 cm3 (IQR 0.3–11.8 cm3) for the multivariable linear regression model. All models underestimated the HVs for tumors with large HVs, see .
Figure 3. Hypoxic volumes (HV) for the patients in the test set: measured HV versus predicted HV for the two random forest models and multivariable linear regression.
All tumors in the test set were correctly classified as hypoxic (HV >1 cm3) or not-hypoxic for the random forest with features of all image modalities. Both the random forest with CT and FDG features, and the multivariable linear regression model misclassified three out of 18 patients, of which two patients were misclassified by both ().
Discussion
To our knowledge, the present study is the first data-driven approach to predict baseline hypoxia levels and to create a virtual hypoxia PET image for NSCLC patients. Other published approaches to simulate tumor oxygenation have been fully based on mathematical models [Citation21,Citation22], or a combination of a mathematical model and anatomical input, using, e.g., histology [Citation22] or MRI [Citation23]. None of the published methods are solely based on patient-specific noninvasive imaging.
The best performance was achieved by training a random forest classifier combining an indirect hypoxia marker linked to perfusion (DCE-CT), a marker related to tumor metabolism (FDG PET) and CT image features. The random forest outperformed a multivariable linear regression using the same features. We managed to validate our random forest in an independent test set of patients of a second clinical trial.
The introduction of supervoxels, instead of creating voxel-based models, tremendously decreased the memory and calculation costs. More importantly, the supervoxel model, with all features, outperformed the voxel-based approach, with a training RMSE difference of 0.19 versus 0.26 and test difference of 0.27 versus 0.30, respectively. The supervoxel approach provides the additional benefit of being able to calculate multiple features per supervoxel, such as the median, standard deviation and entropy we investigated. We decided to limit our research to these three commonly used features and did not study other metrics due to the limited number of patients. Other features could potentially further optimize the models.
The random forest model with features of all image modalities outperformed the model with only CT and FDG PET features. However, if DCE-CT imaging is not available, the restricted model could still provide valuable information because the observed performance difference was minimal. FDG PET appears to be the strongest indicator of hypoxia in NSCLC tumors and the most important predictor in our models. Hypoxia levels increase with increasing FDG PET SUV non-linearly and plateau around a SUV of nine; see Supplementary Figure 1 for the individual contributions of all features to the best performing random forest model. Interestingly, voxel-wise comparison studies between FDG and hypoxia PET have provided contradicting results regarding their correlation [Citation9,Citation24]. All other features show a less pronounced effect on the predicted hypoxia levels and their contributions have larger variations (see Supplementary Figure 1). The first four most important parameters are based on either FDG PET or CT, and do not include any DCE-CT features. This, in combination with the limited increase in model performance between the random forest based on FDG PET/CT or all features, questions the potential of perfusion imaging as a hypoxia marker in NSCLC. The relationship between DCE-CT and hypoxia PET has not been studied intensively. On a tumor level, negative correlations between perfusion parameters and hypoxia have been shown [Citation25] and also between immunohistochemical hypoxia markers and DCE-CT parameters moderate negative correlations have been found [Citation26]. One hypothesis that could explain the limited influence of DCE-CT on our hypoxia prediction is the difference in signal generation between hypoxia PET and DCE-CT imaging. Hypoxia PET tracers are trapped at the cellular level and only require a relatively small amount of positron emitters to generate a signal, while DCE-CT analysis compares differences in contrast uptake over time and averages the signal within every voxel.
The prediction of the HVs is correct for NSCLC tumors with small hypoxic regions, however, the larger HVs were all underestimated. One possible explanation would be that the training set does not represent the test set well enough. We decided to separate the data of the two clinical trials in a training and independent test set. The inclusion criteria of the trials are, however, different, and therefore, also the characteristics of the tumors. In our training data set (NCT01024829, a dose-escalation trial based on FDG-PET/CT imaging), only patients were included with a minimal tumor diameter of 4 cm, a pretreatment FDG SUVmax of 5.0 and no distant metastases. While in the test cohort (NCT01210378, standard (chemo-)radiotherapy with the addition of a vaso-dilating drug), inclusion criteria were less rigid and almost all stage IB-IV NSCLC with curative intent were eligible, typically including also smaller size lesions, see also . It is possible that not all characteristics of the tumors in the test set are provided in the training data. We decided to keep the two clinical trials separate and to train the models on the data set with the most supervoxels. Mixing both datasets would most likely yield a better result, however, the test and training set will no longer be independent and it is more difficult to determine the generalizability of the model. Although it is rather unique to have multimodality pretreatment imaging of this many patients, more as well as more diverse patients are needed to further optimize the model. Furthermore, the generalizability of the model should be tested in external data sets, possibly by including also other 2-nitroimidazole PET tracers working with the same mechanism such as FAZA or FMISO.
The extended random forest model correctly classified all tumors as hypoxic or normoxic. Such a model could be applied to select NSCLC patients for hypoxia targeting therapies (e.g., hypoxia targeted prodrugs), if hypoxia PET imaging is not available. Preferably, the model would be based solely on FDG PET and CT as these images are already available in clinical routine and the DCE-CT scan adds an extra radiation and time burden to the patient. The random forest model without the DCE-CT features, however, misclassified three out of 18 patients. The performance of this restricted model is not sufficient enough for patient stratification and should be further improved before implementing in clinical practice. Our described modeling approach provides not only information on the total HV of the tumor, but also gives spatial information which could be used to further personalize treatment. The described models, however, underestimate, the larger HVs. This should be improved in further research, possibly by using more (diverse) patients to train the models on.
In conclusion, we created a methodology to predict hypoxia levels and hypoxia spatial patterns in NSCLC using multi-parametric imaging. This data-driven strategy can aid tumor hypoxia classification and patient stratification.
IONC_A_1349332_Supplementary_Information.zip
Download Zip (59.6 KB)Acknowledgments
We thank Robert Jeraj and the IGT group at the University of Madison, Wisconsin for providing the DCE-CT modeling.
Disclosure statement
The authors report no conflicts of interest.
Additional information
Funding
Related Research Data
References
- Wilson WR, Hay MP. Targeting hypoxia in cancer therapy. Nat Rev Cancer. 2011;11:393–410.
- Wouters BG, van den Beucken T, Magagnin MG, et al. Targeting hypoxia tolerance in cancer. Drug Resist Updat. 2004;7:25–40.
- Wouters BG, Koritzinsky M, Chiu RK, et al. Modulation of cell death in the tumor microenvironment. Semin Radiat Oncol. 2003;13:31–41.
- Peeters SG, Zegers CM, Biemans R, et al. TH-302 in combination with radiotherapy enhances the therapeutic outcome and is associated with pretreatment [18F]HX4 hypoxia PET imaging. Clin Cancer Res. 2015;21:2984–2992.
- Di Perri D, Lee JA, Bol A, et al. Evolution of [18F]fluorodeoxyglucose and [18F]fluoroazomycin arabinoside PET uptake distributions in lung tumours during radiation therapy. Acta Oncol. 2017;56:516–524.
- Even AJ, van der Stoep J, Zegers CM, et al. PET-based dose painting in non-small cell lung cancer: comparing uniform dose escalation with boosting hypoxic and metabolically active sub-volumes. Radiother Oncol. 2015;116:281–286.
- Begg AC, Stewart FA, Vens C. Strategies to improve radiotherapy with targeted drugs. Nat Rev Cancer. 2011;11:239–253.
- Peeters SG, Zegers CM, Lieuwes NG, et al. A comparative study of the hypoxia PET tracers [(1)(8)F]HX4, [(1)(8)F]FAZA, and [(1)(8)F]FMISO in a preclinical tumor model. Int J Radiat Oncol Biol Phys. 2015;91:351–359.
- Zegers CM, van Elmpt W, Reymen B, et al. In vivo quantification of hypoxic and metabolic status of NSCLC tumors using [18F]HX4 and [18F]FDG-PET/CT imaging. Clin Cancer Res. 2014;20:6389–6397.
- Horsman MR, Mortensen LS, Petersen JB, et al. Imaging hypoxia to improve radiotherapy outcome. Nat Rev Clin Oncol. 2012;9:674–687.
- van Elmpt W, De Ruysscher D, van der Salm A, et al. The PET-boost randomised phase II dose-escalation trial in non-small cell lung cancer. Radiother Oncol. 2012;104:67–71.
- Boellaard R, Oyen WJ, Hoekstra CJ, et al. The Netherlands protocol for standardisation and quantification of FDG whole body PET studies in multi-centre trials. Eur J Nucl Med Mol Imaging. 2008;35:2320–2333.
- Dubois LJ, Lieuwes NG, Janssen MH, et al. Preclinical evaluation and validation of [18F]HX4, a promising hypoxia marker for PET imaging. Proc Natl Acad Sci USA. 2011;108:14620–14625.
- van Loon J, Janssen MH, Ollers M, et al. PET imaging of hypoxia using [18F]HX4: a phase I trial. Eur J Nucl Med Mol Imaging. 2010;37:1663–1668.
- Zegers CM, van Elmpt W, Hoebers FJ, et al. Imaging of tumour hypoxia and metabolism in patients with head and neck squamous cell carcinoma. Acta Oncol. 2015;54:1378–1384.
- La Fontaine MD, McDaniel LS, Kubicek LN, et al. Patient characteristics influencing the variability of distributed parameter-based models in DCE-CT kinetic analysis. Vet Comp Oncol. 2017;15:105–117.
- St Lawrence KS, Lee TY. An adiabatic approximation to the tissue homogeneity model for water exchange in the brain: I. Theoretical derivation. J Cereb Blood Flow Metab. 1998;18:1365–1377.
- Staring M, Bakker ME, Stolk J, et al. Towards local progression estimation of pulmonary emphysema using CT. Med Phys. 2014;41:021905.
- Klein S, Staring M, Murphy K, et al. elastix: a toolbox for intensity-based medical image registration. IEEE Trans Med Imaging. 2010;29:196–205.
- Achanta R, Shaji A, Smith K, et al. SLIC superpixels compared to state-of-the-art superpixel methods. IEEE Trans Pattern Anal Mach Intell. 2012;34:2274–2282.
- Kelly CJ, Brady M. A model to simulate tumour oxygenation and dynamic [18F]-Fmiso PET data. Phys Med Biol. 2006;51:5859–5873.
- Grimes DR, Kannan P, Warren DR, et al. Estimating oxygen distribution from vasculature in three-dimensional tumour tissue. J R Soc Interface. 2016;13:20160070.
- Gu S, Chakraborty G, Champley K, et al. Applying a patient-specific bio-mathematical model of glioma growth to develop virtual [18F]-FMISO-PET images. Math Med Biol. 2012;29:31–48.
- Kerner GS, Bollineni VR, Hiltermann TJ, et al. An exploratory study of volumetric analysis for assessing tumor response with (18)F-FAZA PET/CT in patients with advanced non-small-cell lung cancer (NSCLC). EJNMMI Res. 2016;6:33.
- van Elmpt W, Zegers CM, Reymen B, et al. Multiparametric imaging of patient and tumour heterogeneity in non-small-cell lung cancer: quantification of tumour hypoxia, metabolism and perfusion. Eur J Nucl Med Mol Imaging. 2016;43:240–248.
- Mandeville HC, Ng QS, Daley FM, et al. Operable non-small cell lung cancer: correlation of volumetric helical dynamic contrast-enhanced CT parameters with immunohistochemical markers of tumor hypoxia. Radiology. 2012;264:581–589.