
 ?Mathematical formulae have been encoded as MathML and are displayed in this HTML version using MathJax in order to improve their display. Uncheck the box to turn MathJax off. This feature requires Javascript. Click on a formula to zoom.
Abstract
Background: 18F-fluoro-2-deoxyglucose positron emission tomography (18F-FDG-PET) may be used for assessing radiation induced alterations in the lung. However, there is a need to further develop methodologies to improve quantification. Using computed tomography (CT), a local structure method has been shown to be superior to conventional CT-based analysis. Here, we investigate whether the local structure method based on 18F-FDG-PET improves radiotherapy (RT) dose–response quantification for lung cancer patients.
Material and methods: Sixteen patients with lung cancer undergoing fractionated RT were examined by 18F-FDG-PET/CT at three sessions (pre, mid, post) and the lung was delineated in the planning CT images. The RT dose matrix was co-registered with the PET images. For each PET image series, mean (μ) and standard deviation (σ) maps were calculated based on cubes in the lung (3 × 3 × 3 voxels), where the spread in pre-therapy μ and σ was characterized by a covariance ellipse in a sub-volume of 3 × 3 × 3 cubes. Mahalanobis distance was used to measure the distance of individual cube values to the origin of the ellipse and to further form local structure ‘S’ maps. The structural difference maps (ΔS) and mean difference maps (Δμ) were calculated by subtracting pre-therapy maps from maps at mid- and post-therapy. Corresponding maps based on CT images were also generated.
Results: ΔS identified new areas of interest in the lung compared to conventional Δμ maps. ΔS for PET and CT gave a significantly elevated lung signal compared to a control group during and post-RT (p < .05). Dose–response analyses by linear regression showed that ΔS between pre- and post-therapy for 18F-FDG-PET was the only parameter significantly associated with local lung dose (p = .04).
Conclusions: The new method using local structures on 18F-FDG-PET provides a clearer uptake dose–response compared to conventional analysis and CT-based approaches and may be valuable in future studies addressing lung toxicity.
Introduction
Radiotherapy (RT) is important for both curative and palliative care of patients with non-small cell lung cancer (NSCLC). Nevertheless, patients receiving thoracic RT are at risk of radiation induced lung toxicity (RILT) such as pneumonitis and fibrosis [Citation1]. RILT is one of the most important side effects for NSCLC patients and may affect patients’ quality of life and also treatment costs [Citation2]. To have a better understanding of RILT, the relationship between the local dose and changes in image-features using lung imaging could be useful. RT may cause changes in the lung such as edema, cell infiltration into air spaces and thickened alveolar walls [Citation3]. These changes may be quantified by employing morphological imaging such as computed tomography (CT) scans [Citation4,Citation5] that is widely used as a proxy for tissue density. The standard way of measuring changes in the lung is to calculate the mean density of the whole lung or of the irradiated part of the lung. However, using the mean lung density alone may not be sufficient, as hyperinflation may cause an increase in lung density heterogeneity which is due to a combination of focal density increase and decrease [Citation3,Citation6]. In this regard, a method developed by van Luijk et al. [Citation7] for quantification of radiation induced lung damage uses a combination of mean density changes from CT scans and corresponding standard deviations. This method has been shown to be more sensitive in terms of assessing RILT and predicting normal tissue complications both from animal and human studies [Citation8,Citation9].
Functional imaging such as 18F-fluoro-2-deoxyglucose positron emission tomography (18F-FDG-PET) is employed in both staging and assessment of treatment for lung cancer [Citation10]. 18F-FDG-PET is reported to be superior to CT for staging and prognostication of lung cancer [Citation11,Citation12]. Moreover, 18F-FDG-PET can be used to visualize and quantify lung tissue toxicity resulting from RT and chemotherapy [Citation13–16], as inflammatory responses result in greater pulmonary uptake of 18F-FDG [Citation17]. Also, lung inflammation may augment hyperinflation [Citation18], indicating that 18F-FDG-PET may depict early signs of hyperinflation. In the current work, the aim was to evaluate changes in pulmonary 18F-FDG uptake as a consequence of lung irradiation during and after RT compared to before treatment for NSCLC patients. The evaluation was done using two different methods: (1) measuring changes in the mean lung 18F-FDG uptake and (2) measuring changes in the lung using a combination of mean 18F-FDG uptake and corresponding standard deviation. The sensitivity in terms of providing local dose–response relationships of these two methods was assessed and further compared to results from identical analysis of CT images.
Material and methods
Study design
Sixteen patients with stage III-IV NSCLC included in ThoRaT (Thoracal Radiotherapy and Tarceva) randomized phase II trial (NCT02714530), between 30 November 2012 and 5 May 2015, were selected. The median (±SD) patient age was 67 ± 7.5 years (range, 47–81 years) and 13 patients (87%) were male. In the trial, patients are randomly assigned to receiving either RT alone (56%) or RT concurrently with oral erlotinib (44%) once every day (150 mg p.o.), from the day before start of RT and during RT. RT was done using two opposed 6 MV photon beams with a total dose of 30 Gy in 10 fractions, once every weekday, at a linear accelerator. The population based median of the mean lung dose was 9.4 Gy (range, 3.9–15.3 Gy). The study was approved by the Regional Committee for Medical and Health Research Ethics. A written informed consent was received from all patients.
Imaging and contouring
For each patient, a planning CT scan was performed with a light speed ultra-scanner (GE Medical Systems, Chicago, IL, USA) prior to treatment. The planning CT images were exported to the RT planning system (Oncentra® External Beam, Elekta, Sweden) for delineation of gross tumor volume (GTV), lymph nodes, lung, heart, thoracic vertebrae and esophagus. Moreover, patients also underwent at most three 18F-FDG-PET/CT examinations using a Biograph 16-scanner (Siemens, Erlangen, Germany); one prior to RT, one at mid-therapy (after one week) and one six weeks post-RT. All patients fasted for at least 6 h prior to mean administration of 375 MBq 18F-FDG.
All procedures regarding image analyses and quantification were implemented in IDL (Interactive Data Language, v 8.3, Research Systems, Boulder, CO, USA). Standardized uptake value maps were derived from PET images using injected activity, time interval between 18F-FDG injection and image acquisition, and patients’ body weight. RT dose images were obtained from the treatment planning system, giving a voxel-by-voxel mapping of planned doses in units of Gy. CT image series from the planning and PET/CT data were also collected. PET, CT and RT dose images were re-binned to the same isotropic voxel resolution (3 mm). PET/CT images taken at different sessions were rigidly registered to the planning CT by applying an algorithm maximizing the correlation between bony structures in the respective CT series [Citation19]. The RT dose image series were given in the same frame of reference as the planning CT series.
The delineated lung region of interest (ROI) from the planning CT was transferred to the registered PET/CT and RT dose images. To avoid PET signal spillover from tissues other than normal lung, the ROIs for GTV, lymph nodes, heart, thoracic vertebrae and esophagus with margins of 1.2–1.5 cm were removed from the lung ROI in the event of overlap. Furthermore, only voxels exclusively having Hounsfield Units (HUs) between −924 and −224 in the CT images were considered to ensure that only lung parenchyma were included in the analyses.
Image-based quantification of lung changes
To visualize and evaluate pulmonary changes following thoracic RT using 18F-FDG-PET two methods were explored. The pre-therapy PET image was in both cases defined as a control image reflecting a functionally normal situation. Changes in the lung 18F-FDG uptake were then assessed by the following:
Mean value method
The μ map was calculated as the local mean 18F-FDG uptake in small cubes (1 cube =3 × 3 × 3 = 27 voxels) of the lung throughout the PET image. This was done for images acquired at all available sessions. Changes from pre- to mid-therapy or pre- to post-therapy were obtained by calculating mean difference maps (Δμ). The Δμ map thus represents a smoothed voxel-by-voxel difference in the 18F-FDG uptake, and may be analyzed together with voxel-by-voxel dose distributions in the lung. Here, it was chosen to only include cubes that contain 27 voxels with lung parenchyma defined within the HU-window described above.
Local structure method
This outline follows the procedures described by van Luijk et al. [Citation7] for assessing structural changes in the lung based on CT images. Standard deviation (σ) map was calculated as the standard deviation within cubes of 27 voxels throughout the lung PET image. μ maps were calculated as described above. In the pre-therapy PET image, the spread in μ and σ in a sub-volume of 3 × 3×3 cubes represents a normal variation in the un-irradiated lung (Details can be found in Supplementary material). This spread of (μ, σ)-values over the sub-volume can be visualized as local covariance ellipse and quantified by a 2 × 2 variance-covariance matrix COV(μ,σ). For a given pair of observations the distance, S, from l to the center of the local ellipse may be found from the Mahalanobis distance:
(1)
(1)
where lT is the transposed of l and COV(μ,σ)-1 is the inverse of the variance-covariance matrix. The center of the covariance ellipse thus represents the average of the (μ, σ)-distribution and S is the distance from a pair of observations to the center. A large S may indicate a high mean uptake, a high standard deviation in the uptake, or both, relative to the (μ, σ)-distribution. Defining pre-therapy S as the expectation value of the distance, the pre-therapy PET image was assumed to provide control sets. Thus, S map can be calculated for all voxels in the lung. To quantify radiation-induced changes in the lung, maps of structural difference (ΔS) were calculated by subtracting the pre-therapy S map from the S maps of mid- and post-therapy.
The procedure described above for PET images was also carried out for CT images of the same patients using the CT scans from PET/CT sessions. In this case, μ, σ and S maps were generated based on the lung HU distributions.
Dose–response curves
The differences in the μ, σ and S maps from pre- to mid- and post-therapy, using PET and CT data, can be assessed against the RT dose using matching single-cube values in the lung. RT dose was classified into bins of 2 Gy and Δμmean, Δσmean and ΔSmean were then calculated in each dose bin up to the prescription dose for each patient at mid- and post-therapy. On a population level, a further average of Δμmean, Δσmean and ΔSmean from individual patients were calculated for each RT dose bin. RT dose data were presented in terms of % of delivered dose as the RT dose ranged between 0 and 15 Gy for mid-therapy and between 0 and 30 Gy for post-therapy session. In order to investigate the relationship between lung density and 18F-FDG uptake and RT dose at mid- and post-therapy, first-order linear regression was used.
Detection threshold level
A detection threshold was calculated based on three sarcoma patients with two sets of 18F-FDG-PET/CT scans covering un-irradiated lung. The two scans from each patient were spatially aligned and μ, σ and S maps were generated. For each patient local Δμ, Δσ and ΔS values were binned and further averaged based on the voxels falling in the same ΔS range. These values were then averaged inside the whole delineated lung. As a final step, detection threshold levels were calculated by averaging lung values from the three patients. Threshold levels for each modality and image-based metrics were produced.
Statistics
Dose–response parameters, slopes and intercepts, in mid- and post-therapy sessions were compared for statistical significance using 95% confidence intervals (CIs) estimated from the linear regression. Goodness-of-fit was estimated from Pearson’s correlation coefficient squared. t-Test assuming unequal variances was performed when looking for statistically significant differences between Δμ, Δσ and ΔS from PET and CT data and corresponding threshold levels. Statistical significance was taken at p < .05.
Results
Sixteen patients with pre- and mid-therapy 18F-FDG-PET/CT scans were eligible for analyses. All had pre- and mid-therapy scans, while nine had 18F-FDG-PET/CT examinations six weeks post-therapy. Threshold levels (±SD) based on the sarcoma patients, for Δμ, Δσ and ΔS were 0.92 ± 0.41, 0.30 ± 0.08 and 0.65 ± 0.30 using CT data and 0.014 ± 0.004, 0.005 ± 0.000 and 0.008 ± 0.002 using PET data.
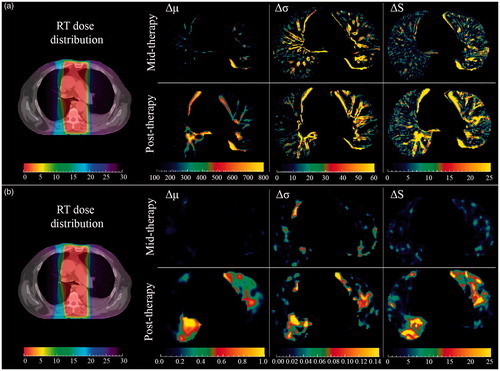
shows the RT dose distribution together with Δμ, Δσ and ΔS maps from (a) CT images and (b) 18F-FDG-PET images at mid- and post-therapy for one patient. First, as the CT image has a higher resolution, finer structures were observed in all CT maps compared to PET maps. Second, maps derived from PET and CT images visualize different aspects as they are mirroring functional and morphological patterns of the lung, respectively. Third, the structural difference maps identified new areas of interest in the lung compared to the mean difference maps, both for CT and PET, reflecting the impact of including standard deviation map and employing the subsequent Mahalanobis distance estimate.
Figure 1. Visualizing axial (a) CT and (b) 18F-FDG-PET images. Left: RT dose distribution registered with planning CT for one patient with dose ranges from 0 to 30 Gy (left most color bars). Right: Δμ, Δσ and ΔS maps were displayed during (top) and six weeks post (bottom) treatment. Units are HU for CT, while PET values are unitless. ΔS maps both in mid- and post-therapy visualized new regions of interest that were not visible in the Δμ maps.
shows lung (a) CT density and (b) 18F-FDG uptake dose–response curves generated for Δμ, Δσ and ΔS maps using PET and CT images at mid- and post-therapy. The inter-patient coefficient of variation at post-therapy Δμ, Δσ and ΔS were 1.73, 2.59 and 0.44 using CT data and 1.02, 2.32 and 0.65 using PET data, respectively. The lower coefficient of variation for ΔS in both modalities indicated that the local structure method yielded less heterogeneous results. For CT, both at mid- and post-therapy, Δμ and Δσ were not significantly different from corresponding threshold levels. For PET, Δσ was not significantly different from its threshold level at both sessions, but Δμ at mid-therapy was significantly different from its threshold level from 20% up to 50% of total dose. At post-therapy PET, Δμ was significantly different from the threshold from 10% of total dose. ΔS data were always significantly different from the respective threshold levels, irrespective of dose and imaging session for PET and CT images. Looking at the association between lung signal and radiation dose (), as data seem to plateau after about 50% of the delivered dose, the linear regression analyses were employed up to this point in the response curves. Dose–response parameters were further used to compare the sensitivity of the methods in detecting any dose-related changes in the lung image-features following RT. Analyses of RT dose–responses can be found in . The only dose–response slope significantly different from zero was for ΔS taken between post- and pre-therapy PET (p = .04).
Figure 2. Population based Δμ, Δσ and ΔS dose–response curves based on (a) density (CT-based HU) and (b) 18F-FDG uptake in the lung at mid- and post-therapy across patients treated with RT. Horizontal gray bars show the mean of changes over entire lung in the control group (mean ± SD).
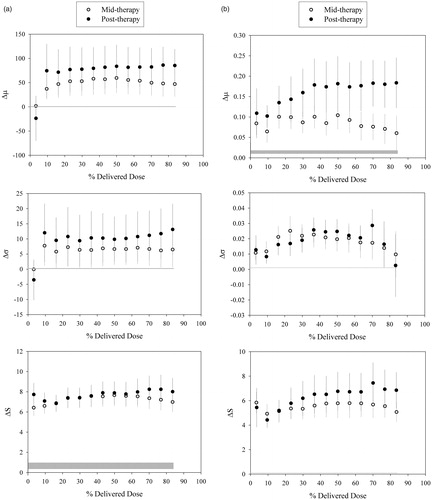
Table 1. Analyses of dose–response relationships.
Discussion
In the current work, we applied a method previously established for CT to assess treatment-related changes in the lung using 18F-FDG-PET. The local structure method applied on CT and PET gave, in most cases, a greater separation in lung signal between the lung cancer patients and the control group compared to conventional analysis based on mean signal change. Furthermore, ΔS based on PET was the only metric showing a significant association with local radiation dose. This implies that local structure maps based on 18F-FDG-PET could be useful for image-based assessment of changes in the normal lung following thoracic RT.
Although RT represents a good treatment option for patients with lung cancer, radiation induced lung damage can affect treatment outcome. Predicting and assessing damage to the lung, however, is vital in order to further adapt the treatment in a way that minimizes such damages. In many studies, both in human and animal models, mean density changes from CT have been used as a surrogate for radiation-induced alterations in the lung [Citation4]. However, a combination of mean density changes from CT scans and corresponding standard deviations has been shown to be a better predictor for normal tissue damage both in rats [Citation8] and humans [Citation9]. This novel method showed that the quantification of local structural changes using CT images can be a representative of lung damages because such changes correlated well with local histologic endpoints. On the other hand, some studies have been done to detect RILT using 18F-FDG uptake from PET images. However, voxel-averaged 18F-FDG uptake in such studies has typically been used [Citation15,Citation16]. Knowing that 18F-FDG uptake could be superior in detecting RILT [Citation12], this method was therefore adapted based on local structures in the 18F-FDG-PET/CT images. In the current work, this method was employed to derive dose–response relationships which were further compared with standard image subtraction using mean difference mapping. We observed varying spatial patterns of response in the lung, both when comparing CT- and PET-derived maps and when inspecting the changes in the local structure ‘S’ map at mid- and post-therapy 18F-FDG-PET/CT. Changes in the local lung response patterns may both be due to increase in mean change and in local variation, quantified as the structural difference, ΔS, in this study. The new patterns seen may thus reflect that focal changes take place following RT in our cohort of patients.
In the current work, a positive relationship was obtained between the local radiation dose and changes in the 18F-FDG-PET local lung structures post-RT. However, the variations of the difference maps among patients were substantial, indicating significant variations in the lung response for individual patients. Also, we included patients randomized to either RT or RT plus concomitant erlotinib, and have previously found a difference in the lung 18F-FDG uptake between these two study arms post-therapy [Citation20]. This difference was still observed in the current analysis (only including patients with post-therapy 18F-FDG-PET scan in addition to pre-therapy scan) both in ΔS and Δμ (data not shown). However, the current work was focused on implementing the local structure methodology, and further subgroup analysis (with limited statistical power) was not pursued here. Linear regression up to 50% of total dose was used to assess the dose–response, as the population data seemed to reach a plateau thereafter. We also tested other approaches such as first or second order polynomials over the entire dose range, but the adjusted goodness-of-fit were in these cases lower than for the linear fit up to 50% of total dose (data not shown). The changes in the lung per local dose were statistically significant for post-therapy ΔS for 18F-FDG-PET only. This may imply that the mid-therapy data (one week into RT) are acquired too early for any significant lung changes to occur. It has been shown that lung 18F-FDG uptake increases under inflammation [Citation21], and it could thus be that recruitment of inflammatory cells in the irradiated parts of the lung is rather slow and data need to be acquired some weeks after the end of RT. However, a general elevation in the lung 18F-FDG uptake was partly observed compared to the control group already one week after RT. Previous studies suggested that the changes in lung density can be quantified typically 3–6 months after RT using CT [Citation22]. Nevertheless, a dose–response is observed by Ghobadi et al. [Citation9] only six weeks post-RT in a curative patient cohort. Still, we could not observe a significant dose–response using CT in our cohort of patients receiving palliative RT. The patients included in the current study had advanced disease and were treated with a rather simple RT technique, where the gross tumor and local nodes were covered by two opposed parallel beams. Therefore, the lung dose distribution is rather unselective, covering most often central parts of the lung and bronchi. Thus, this differs substantially from the lung dose distribution resulting from curative treatment of well-defined, low-stage disease using volumetric modulated arc therapy, stereotactic RT or similar high-conformity RT techniques. The non-specific dose deposition pattern in our cohort may explain why less clear dose–response relationships were found compared to other studies. Furthermore, patients with advanced disease may suffer from comorbidities such as chronic obstructive pulmonary disease, which may also give rise to elevated lung 18F-FDG uptake [Citation23]. This may again explain why less clear dose–response patterns where found, but could also explain the generally elevated lung 18F-FDG uptake in our patients compared to the control group of sarcoma patients with no evident lung disease. Still, the new structure method based on PET seems more sensitive in terms of providing a more comprehensive dose–response six weeks after initiation of treatment compared to standard image subtraction and CT analysis, and may be valuable in future studies addressing RILT.
Previous studies have shown that lung 18F-FDG uptake assessed typically six weeks after end of RT is associated with local radiation dose in the lung [Citation15,Citation16]. However, as pointed out in our previous study [Citation20], this association may be false-positive due to other factors (anatomical/biological) showing high spatial correlation with radiation dose. Thus, difference map where the pre-therapy image series are implicitly taken as a control is most likely a better option. However, test–retest studies with 18F-FDG-PET have shown a repeatability in liver and tumor uptake of typically 10-20% (lung not previously reported to our knowledge) [Citation24]. Thus, from error propagation, difference maps may have an inherent uncertainty of typically 15–30%, which will impact and possibly obscure dose–response relationships assessed by 18F-FDG-PET. Conversely, HUs are much more robust and CT is thus expected to have less uncertainty in the image values used to assess pulmonary response. Still, the fact the lung 18F-FDG uptake showed the strongest association with radiation dose in our study implies that the biology reflected in the 18F-FDG-PET images may be a better marker for lung response, at least at an early stage after therapy where changes in the lung HU is not yet clearly apparent.
In conclusion, dose–response derived from the local structure method in the lung using 18F-FDG PET post-RT appears to be more sensitive compared to measuring differences in the 18F-FDG uptake and CT analysis. We aim to employ our methodologies in future studies using 18F-FDG-PET for patients with low-stage disease treated with stereotactic approaches to further assess the validity of our image-based metrics.
IONC_A_1349336_Supplementary_Information.zip
Download Zip (41.1 KB)Acknowledgments
This work was supported by the Norwegian Cancer Society and the regional health authorities in South East Norway.
Disclosure statement
The authors declare that they have no commercial or financial interests related to this study to disclose.
Related Research Data
References
- McDonald S, Rubin P, Phillips TL, et al. Injury to the lung from cancer therapy: clinical syndromes, measurable endpoints, and potential scoring systems. Int J Radiat Oncol Biol Phys. 1995;31:1187–1203.
- Carver JR, Shapiro CL, Ng A, et al. American Society of Clinical Oncology clinical evidence review on the ongoing care of adult cancer survivors: cardiac and pulmonary late effects. J Clin Oncol. 2007;25:3991–4008.
- El-Khatib E, Lehnert S. Lung density changes observed in vivo in rat lungs after irradiation: variations among and within individual lungs. Int J Radiat Oncol Biol Phys. 1989;16:745–754.
- Wennberg B, Gagliardi G, Sundbom L, et al. Early response of lung in breast cancer irradiation: radiologic density changes measured by CT and symptomatic radiation pneumonitis. Int J Radiat Oncol Biol Phys. 2002;52:1196–1206.
- Sharifi H, van Elmpt W, Oberije C, et al. Quantification of CT-assessed radiation-induced lung damage in lung cancer patients treated with or without chemotherapy and cetuximab. Acta Oncol. 2016;55:156–162.
- Lehnert S, El-Khatib E. The use of CT densitometry in the assessment of radiation-induced damage to the rat lung: a comparison with other endpoints. Int J Radiat Oncol Biol Phys. 1989;16:117–124.
- van Luijk P, Novakova-Jiresova A, Faber H, et al. Relation between radiation-induced whole lung functional loss and regional structural changes in partial irradiated rat lung. Int J Radiat Oncol Biol Phys. 2006;64:1495–1502.
- Ghobadi G, Hogeweg LE, Faber H, et al. Quantifying local radiation-induced lung damage from computed tomography. Int J Radiat Oncol Biol Phys. 2010;76:548–556.
- Ghobadi G, Wiegman EM, Langendijk JA, et al. A new CT-based method to quantify radiation-induced lung damage in patients. Radiother Oncol. 2015;117:4–8.
- Cuaron J, Dunphy M, Rimner A. Role of FDG-PET scans in staging, response assessment, and follow-up care for non-small cell lung cancer. Front Oncol. 2012;2:208.
- Dwamena BA, Sonnad SS, Angobaldo JO, et al. Metastases from non-small cell lung cancer: mediastinal staging in the 1990s-meta-analytic comparison of PET and CT. Radiology. 1999;213:530–536.
- Mac Manus MP, Hicks RJ, Matthews JP, et al. Positron emission tomography is superior to computed tomography scanning for response-assessment after radical radiotherapy or chemoradiotherapy in patients with non-small-cell lung cancer. J Clin Oncol. 2003;21:1285–1292.
- De Ruysscher D, Houben A, Aerts HJWL, et al. Increased 18F-deoxyglucose uptake in the lung during the first weeks of radiotherapy is correlated with subsequent radiation-induced lung toxicity (RILT): a prospective pilot study. Radiother Oncol. 2009;91:415–420.
- Hicks RJ, Mac Manus MP, Matthews JP, et al. Early FDG-PET imaging after radical radiotherapy for non-small-cell lung cancer: inflammatory changes in normal tissues correlate with tumor response and do not confound therapeutic response evaluation. Int J Radiat Oncol Biol Phys. 2004;60:412–418.
- Guerrero T, Johnson V, Hart J, et al. Radiation pneumonitis: local dose versus [18F]-fluorodeoxyglucose uptake response in irradiated lung. Int J Radiat Oncol Biol Phys. 2007;68:1030–1035.
- McCurdy MR, Castillo R, Martinez J, et al. [18F]-FDG uptake dose–response correlates with radiation pneumonitis in lung cancer patients. Radiother Oncol. 2012;104:52–57.
- Chen DL, Rosenbluth DB, Mintun MA, et al. FDG-PET imaging of pulmonary inflammation in healthy volunteers after airway instillation of endotoxin. J Appl Physiol. 2006;100:1602–1609.
- Agusti A, Soriano JB. Dynamic hyperinflation and pulmonary inflammation: a potentially relevant relationship? Eur Respir Rev. 2006;15:68–71.
- Eilertsen K, Skretting A, Tennvassas TL. Methods for fully automated verification of patient set-up in external beam radiotherapy with polygon shaped fields. Phys Med Biol. 1994;39:993–1012.
- Abravan A, Eide HA, Knudtsen I, et al. Assessment of pulmonary 18F-FDG-PET uptake and cytokine profiles in non-small cell lung cancer patients treated with radiotherapy and erlotinib. Clin Transl Radiat Oncol. 2017;4:57–63.
- Basu S, Kumar R, Alavi A. PET and PET-CT imaging in infection and inflammation: its critical role in assessing complications related to therapeutic interventions in patients with cancer. Indian J Cancer. 2010;47:371–379.
- Trovo M, Linda A, El Naqa I, et al. Early and late lung radiographic injury following stereotactic body radiation therapy (SBRT). Lung Cancer. 2010;69:77–85.
- Madsen PH, Hess S, Høilund-Carlsen PF, et al. Positron emission tomography in chronic obstructive pulmonary disease. Hell J Nucl Med. 2013;16:121–124.
- Weber WA, Gatsonis CA, Mozley PD, et al. Repeatability of 18F-FDG PET/CT in advanced non-small cell lung cancer: prospective assessment in 2 multicenter trials. J Nucl Med. 2015;56:1137–1143.