
 ?Mathematical formulae have been encoded as MathML and are displayed in this HTML version using MathJax in order to improve their display. Uncheck the box to turn MathJax off. This feature requires Javascript. Click on a formula to zoom.
Abstract
Background: Cone-beam CT (CBCT) scans are typically acquired daily for positioning verification of non-small cell lung cancer (NSCLC) patients. Quantitative information, derived using radiomics, can potentially contribute to (early) treatment adaptation. The aims of this study were to (1) describe and investigate a methodology for feature selection of a longitudinal radiomics approach (2) investigate which time-point during treatment is potentially useful for early treatment response assessment.
Material and methods: For 90 NSCLC patients CBCT scans of the first two fractions of treatment (considered as ‘test-retest’ scans) were analyzed, as well as weekly CBCT images. One hundred and sixteen radiomic features were extracted from the GTV of all scans and subsequently absolute and relative differences were calculated between weekly CBCT images and the CBCT of the first fraction. Test-retest scans were used to determine the smallest detectable change (C = 1.96 * SD) allowing for feature selection by choosing a minimum number of patients for which a feature should change more than ‘C’ to be considered as relevant. Analysis of which features change at which moment during treatment was used to investigate which time-point is potentially relevant to extract longitudinal radiomics information for early treatment response assessment.
Results: A total of six absolute delta features changed for at least ten patients at week 2 of treatment and increased to 61 at week 3, 79 at week 4 and 85 at week 5. There was 93% overlap between features selected at week 3 and the other weeks.
Conclusions: This study describes a feature selection methodology for longitudinal radiomics that is able to select reproducible delta radiomics features that are informative due to their change during treatment, which can potentially be used for treatment decisions concerning adaptive radiotherapy. Nonetheless, the prognostic value of the selected delta radiomic features should be investigated in future studies.
Introduction
Healthcare is moving towards a trend of personalized medicine replacing the ‘one-size-fits-all’ principle. In personalized medicine, early and accurate stratification of patients based on their prognosis, is essential to tailor treatment [Citation1]. To this extent, radiomics could provide useful quantitative information [Citation2,Citation3]. This is the principle of extracting large amounts of quantitative features from medical images acquired in clinical practice. Combining different types of information, i.e., radiomics, genomics, demographics, models can be developed to predict treatment outcome and improve treatment decisions [Citation4–7].
Previously, the prognostic value of radiomic features extracted from Positron Emission Tomography (PET) and Computed Tomography (CT) images acquired prior to the treatment has been investigated [Citation8–11]. The potential of using cone-beam CT (CBCT) for this purpose was also explored [Citation12,Citation13]. A recent study demonstrated the potential added prognostic value of delta radiomic features extracted from CT images [Citation14], which indicates that monitoring the course of treatment in a longitudinal radiomics approach can potentially be useful for (early) treatment adaptation. For lung cancer patients, CBCT images are generally acquired daily for treatment positioning verification, which makes this ideal for longitudinal treatment response assessment with radiomics.
To assure robust and reproducible radiomics analyses, an essential step in the process is feature selection, in which features considered as non-informative are eliminated. For radiomics on pretreatment images (baseline), test-retest methods are often used to eliminate unstable features [Citation15–20]. However, stable features that do not change over the course of treatment are not informative in case of a longitudinal radiomics approach. Moreover, only relying on test-retest data could eliminate informative features for which the change over several weeks of treatment is much larger than the natural fluctuation in a test-retest setting. Therefore, the first aim of this study was to investigate a methodology for feature selection that takes into account not only single time-point robustness, but also potential longitudinal information of radiomic features derived from CBCT imaging. The second aim of this study was to investigate at which timepoint during treatment radiomic features extracted from CBCT images change to explore the possibility of using longitudinal radiomics information for (early) treatment adaptation.
Material and methods
Data acquisition
Stage II-IV NSCLC patients treated with curatively intended radiotherapy between March 2013 and February 2015 at Maastro Clinic, Maastricht, the Netherlands, were included in this study. Patients that received less than 40 Gy were excluded from the analysis, as well as patients with SBRT (Stereotactic Body Radiation Treatment), post-operative radiotherapy, simultaneous treatment of brain metastases or prior history of lung cancer. Retrospective analysis of weekly CBCT scans (CBCT1a, CBCT2, CBCT3, CBCT4 and CBCT5) was performed. Additionally, CBCT scans of the second treatment fraction (CBCT1b) were analyzed. Patients for which one of these scans were missing were also excluded from the analysis. This resulted in a cohort of 115 NSCLC patients. Patients for which the tumor was not distinguishable on one of the CBCT images due to atelectasis or blurring (n = 10) were excluded. Moreover, patients for which the field of view (FOV) was too small to cover the entire 3D tumor volume in one the CBCT images (n = 15) were also excluded from the analysis. Characteristics of the remaining 90 NSCLC patients are summarized in .
Table 1. Demographic information of the entire population included in this study.
All CBCT images were acquired from a TrueBeam Radiotherapy System (Varian Medical Systems, Palo Alto, CA) according to the lung protocol with a tube voltage of 125 kVp. Images were reconstructed using filtered back projection [Citation21] into images with an in-plane pixel size of 0.91 × 0.91 mm and a slice thickness of either 2 mm or 3 mm. To improve robustness of the analyses, all images were resampled [Citation22] using cubic interpolation into a voxel size of 1 × 1 × 3 mm since this most closely resembles the voxel size of the majority of CBCT scans in the cohort.
Feature extraction
The gross tumor volume (GTV), defined as the primary tumor without lymph nodes, was copied to all CBCT images using a non-rigid registration of the delineation originating from treatment planning CT images using the Morphons algorithm in REGGUI (http://openreggui.org) [Citation23]. All delineations were manually verified and adjusted when the algorithm failed to perform an acceptable registration of the images. Delineations of all 540 CBCT images were verified by an experienced radiation oncologist. Radiomic features were automatically extracted from the GTV of all CBCT scans using in-house developed software, using Matlab 2014a (MathWorks, Natick, MA). Mathematical descriptions of the extracted 116 features are described elsewhere [Citation12]. This included 95 ‘Texture’ features, 2 ‘Shape’ features and 19 ‘First order statistics (Stats)’ features. For each feature, absolute differences compared to baseline were calculated: CBCTn – CBCT1a, as well as relative differences compared to baseline: (CBCTn – CBCT1a)/CBCT1a. This resulted in a total of 232 delta radiomic features.
Feature selection
The main aim of feature selection was to select radiomic features with single time-point robustness as well as longitudinal radiomics information. This implies that features having a change during treatment that is larger than the difference that would be expected by chance are interesting to select. We aimed to determine the 95% confidence interval of the ‘smallest detectable change’. These boundaries could then be used in the longitudinal radiomics feature selection procedure by considering features as relevant when they have a detectable change during treatment for at least a minimum amount of patients.
We determined a threshold for the smallest detectable change (C), as proposed by Bland and Altman [Citation24]:
(1)
(1)
where SD is the standard deviation of differences between feature values calculated on CBCT1a and CBCT1b. For 95% of repeated measurements the difference is then expected to be less than C. For each feature, differences between CBCT1a and CBCT1b were first plotted against their average. We then tested for constant variances by grouping the residuals into two groups based on the average feature value. Levene’s test was used to test for equal variances of these groups. When we failed to reject the null hypothesis of equal variances (i.e., the SD of differences cannot be assumed to be equal for the entire range of feature values), a log-transformation was applied to the data. After back transforming from the log scale, C then represents a relative threshold (i.e., the absolute threshold then varies with feature value).
When all boundaries were calculated, for each of the features we could determine for how many patients there was a detectable change after a certain period of treatment. This could be used as a criterion to perform feature selection, e.g., to select delta radiomic features that exhibit a change for at least 10% of patients. This procedure of feature selection was summarized in a workflow diagram which can be found in Supplementary material.
Analyses
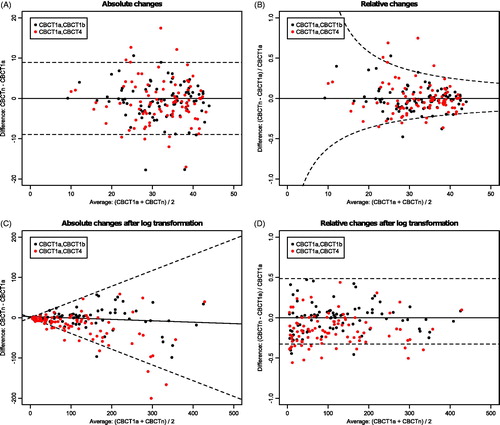
The differences against averages plots, which were used to calculate C for the feature selection procedure, were created for two features to be able to visualize the procedure described in ‘Feature selection’. This was performed for ‘Gray-level co-occurrence matrix – Average (GLCM – Average)’, which is the average GLCM intensity value, and ‘Gray-level distance-zone matrix – Intensity Non-uniformity (GLDZM – IN)’, which describes the distribution of the number of zones over the intensity values. The value of GLDZM – IN is low when the number of zones are distributed equally over all intensity levels. Different representations of the differences versus averages plot were shown for the absolute and relative delta radiomic features (but the results are the same).
To get some insight in the development of feature values over the course of treatment, we displayed the features’ change over the course of treatment with respect to baseline for tumor volume, for a feature that does change for only a small amount of patients and a feature that changes for a large amount of patients.
The selection of features varies during treatment, meaning that we could explore which time-points are potentially relevant to be used to derive longitudinal radiomics information for early treatment adaptation. For instance as long as not a single feature changes, it is not helpful to derive longitudinal radiomics information for early response assessment. Therefore, we investigated the number of delta radiomic features that would have been selected at week 2, week 3, week 4 and week 5 of treatment when choosing a minimum of ‘x’ number of patients. Moreover, we investigated which features were selected at every time-point in order to study the overlap between them.
Correlation with volume
To investigate whether selected delta radiomic features contain complementary information compared to change in tumor volume, we performed a correlation analysis in which we calculated Spearman’s rank correlation coefficient for each feature with respect to volume. A rho value above 0.8 was considered as a significant correlation. The features calculated at all weeks of treatment were correlated to volume at that time-point. Moreover, correlation of the delta radiomic features with the change in volume was assessed for all selected features.
Results
In , examples of the scatterplots for feature selection are shown. In this case, the p-value of Levene’s test was significant for GLDZM – IN, indicating log transformation of the data was needed. For GLCM – Average, for ten patients the change at week 4 of treatment is larger than the smallest detectable change, whereas this is 15 for GLDZM – IN.
Figure 1. Example of scatterplots of differences versus averages for ‘Gray-level co-occurrence matrix – Average (GLCM – Average)’ (A and B) and ‘Gray-level distance-zone matrix – Intensity Non-uniformity (GLDZM – IN)’ (C and D) in which the 95% boundaries of smallest detectable change are indicated with a dashed line. Log transformation of the data was needed for the bottom feature. The left two plots indicate the absolute delta radiomic features and the right two plots the relative delta radiomic features.
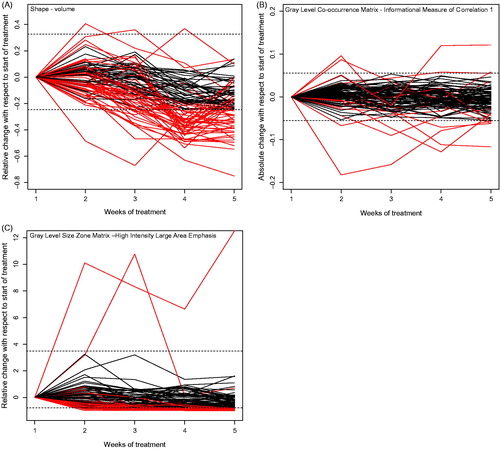
In , we have shown three examples of features changing over time with respect to the start of treatment. The absolute delta radiomic feature ‘Gray Level Co-occurrence Matrix – Informational Measure of Correlation 1 (GLCM infoCorr1)’, which is an information theoretic correlation, only changed for a few patients (seven at week 5 of treatment), shown in . The relative delta radiomic feature ‘Gray Level Size Zone Matrix – High Intensity Large Area Emphasis (GLSZM – HILAE)’, which emphasizes large zone sizes and high gray levels thus having a high value for images with relatively large areas with high intensity, changed for a lot of patients (29 at week 5 of treatment), shown in .
Figure 2. Example for the change of features over time for all patients in the cohort. Dashed lines indicate the calculated thresholds of the smallest detectable change (C) and each line represents a patient. For some patients, the line exceeds C during treatment, meaning that there was a change larger than expected by chance.
shows a fast decrease in the number of features that were selected when increasing the criteria of number of patients. Moreover, the number of selected features increased during treatment. Note that only half of the total number of 232 delta radiomic features are shown, since the graphs are equal for absolute delta radiomic features and relative delta radiomic features.
Figure 3. Number of features that change for an ‘x’ number of patients.
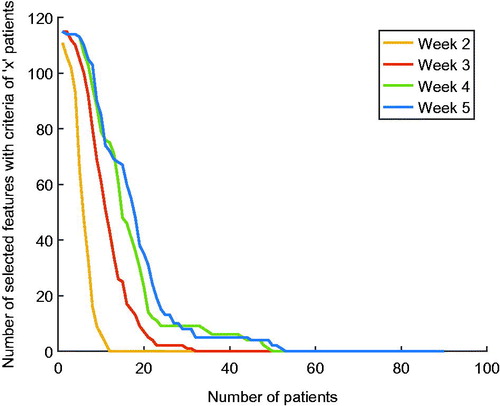
Based on the progress of the number of selected features shown in , a (arbitrary chosen) number of ten patients was set as selection criteria. Using this setting, 85 out of 116 –absolute or relative– delta radiomic features were selected at week 5 of treatment, 79 at week 4, 61 at week 3 and six at week 2.
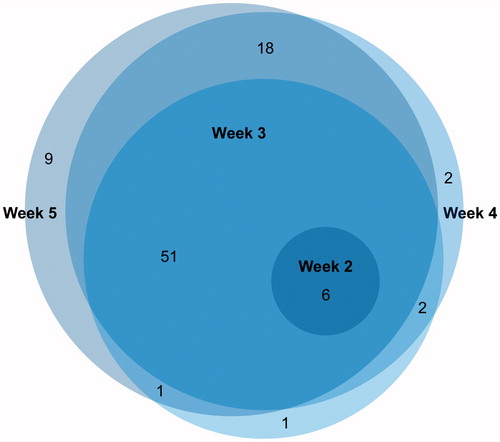
shows the overlap between the selected delta radiomic features over treatment.
Figure 4. Overlap between delta radiomic features that change after 1 week, 2 weeks, 3 weeks and 4 weeks after the start of treatment.
Twenty-five out of 116 features were correlated (rho >0.8) to volume at baseline, 25 out of 116 at week 2, 29 at week 3, 26 at week 4 and 25 out of 116 (96% overlap with week 1) at week 5 of treatment. For the delta radiomic features, two out of 116 were highly correlated to the change of volume at week 2 of treatment, three out of 116 at week 3, eight out of 116 in week 4 and seven out of 116 in week 5. This was 0%, 5%, 10% and 8% of the selected delta radiomic features at week 2, week 3, week 4 and week 5, respectively. The correlation between two delta radiomic features and the volume change is shown in Supplementary material, as well as a scatterplot of Spearman’s correlation coefficients of all delta radiomic features and volume change.
Discussion
The first aim of this paper was to investigate and describe a feature selection methodology for the selection of both reproducible (single time-point robustness: test-retest) and informative (changing during time) features in a longitudinal radiomics approach. Combining baseline and longitudinal radiomics information could potentially contribute to a more informative and prognostic model than solely baseline information. However, it is important to perform a conceptually different feature selection procedure for baseline radiomic features and delta radiomic features. Whereas in baseline feature selection stable and robust features can be selected using a conventional threshold method based on an intra-class correlation coefficient, delta features should be reproducible but not stable over longer time periods of weeks into treatment and change during treatment for at least some patients to be informative. In this study, we proposed a workflow for the selection of delta radiomic features, which can be combined with baseline radiomic features in future model development. In this method, the criteria of the number of patients for which a feature should change is arbitrary, allowing for a flexible feature selection procedure that can be dependent on the research question.
Besides the feature selection based on a change for a minimum amount of patients, the information from the Euler diagrams () that show the overlap in selected delta radiomic features after a certain period of treatment, can potentially be used as further feature selection: features that only change at a single time-point during treatment are most likely not very informative.
The second aim was to investigate which time-point is potentially useful to derive longitudinal radiomics information for early treatment response assessment, since personalized radiotherapy and decision making can be improved when we are able to predict the need for adaptive radiotherapy [Citation25]. In the current analysis, a criterion of ten patients that needed changes was used for feature selection, showing that six delta radiomic features do only change at week 2 of treatment. This indicates that this time-point might be too early to detect enough change in tumor characteristics that can be used to decide for treatment adaptation. However, at week 3 of treatment, a large number of features show a change for at least ten patients, indicating that in the third week of treatment it would already be possible to extract useful radiomics information. The overlap in features show that all features that change at week 2 remain important during the rest of treatment. At week 3, 4 and 5, there is not much difference in which and how many features are selected, indicating that the majority of features already change at week 3 of treatment, which still allows for treatment adaptation if necessary.
A limitation of this study is the fact that much less radiomic features (n = 116) were calculated compared to the available number of features that were extracted in a previous study [Citation12]. The reason for this was that no filtered features (n = 986) were calculated, as the margin around the tumor volume was often too small to be able to calculate any filtered radiomic features without needing to perform padding which required imputing values. Moreover, only the shape features ‘Shape – volume’ and ‘Shape – surface’ were calculated since the other shape features are not defined in case a GTV consists of multiple volumes. Because of the limited size of the dataset, we chose to not extract the filtered and shape features instead of excluding the patients with multiple volumes (n = 26) or a small margin (n = 10) in any of the six analyzed CBCT scans.
This study shows that delta radiomic features independent to volume change during treatment, showing that longitudinal radiomics contains complementary information. When longitudinal radiomics information is derived from CBCT images at week 3 or 4 of treatment and this information has prognostic value, it is possible to improve clinical decisions for early treatment adaptation. Nevertheless, the prognostic value of the features selected in the described method is currently unknown. To date, not many studies investigated the evaluation of metrics extracted from CBCT images for correlation with outcome, whereas this could provide important information for (early) treatment adaptations. However, a recent study investigated tumor regression acquired from CBCT images and related this to locoregional control and overall survival [Citation26]. This study showed that CBCT imaging is feasible for detecting early changes and the authors were able to show that tumor regression was related to a worse prognosis. Moreover, another study used the early density changes of healthy lung tissue seen on CBCT images to predict the risk of developing normal tissue toxicity [Citation27,Citation28]. These studies show that CBCT is a feasible image modality to detect early changes during treatment. Besides common metrics like tumor volume, more information can be extracted from medical images using radiomics, potentially able to more accurately monitor tumor changes over the course of treatment. Previously, radiomics has been shown to be able to predict outcome for NSCLC patients using CT imaging [Citation6,Citation8,Citation19,Citation29]. Moreover, a recent study showed that similar prognostic information can be derived using CBCT imaging [Citation12]. These studies have let to the hypothesis that deriving quantitative features from CBCT images acquired during treatment, using radiomics, could provide additional information to potentially improve personalized treatment adaptation. Therefore, the next step in the development of longitudinal radiomics is investigation of the prognostic value of the selected delta radiomic features extracted using CBCT imaging on clinical endpoints like overall survival or locoregional control. Moreover, the methodology for incorporating trends of feature values over time in prognostic models should be investigated.
To conclude, this study describes a feature selection methodology for longitudinal CBCT radiomics for NSCLC patients that select reproducible delta radiomics features that are informative due to their change during the treatment. When these changes are linked to patient’s outcome in the future, this can potentially contribute to (early) treatment adaptations.
IONC_A_1350285_Supplementary_Information.zip
Download Zip (388.2 KB)Disclosure statement
The authors JT, WE and BR report no conflicts of interest. Author RL is a salaried employee of ptTheragnostic B.V., which develops products for patient stratification for personalized radiotherapy.
Additional information
Funding
Related Research Data
References
- Lambin P, Zindler J, Vanneste B, et al. Modern clinical research: how rapid learning health care and cohort multiple randomised clinical trials complement traditional evidence based medicine. Acta Oncol. 2015;54:1289–1300.
- Lambin P, Rios-Velazquez E, Leijenaar R, et al. Radiomics: extracting more information from medical images using advanced feature analysis. Eur J Cancer. 2012;48:441–446.
- Kumar V, Gu Y, Basu S, et al. Radiomics: the process and the challenges. Magn Reson Imaging. 2012;30:1234–1248.
- Lambin P, van Stiphout RG, Starmans MH, et al. Predicting outcomes in radiation oncology-multifactorial decision support systems. Nat Rev Clin Oncol. 2013;10:27–40.
- Lambin P, Roelofs E, Reymen B, et al. 'Rapid Learning health care in oncology' – an approach towards decision support systems enabling customised radiotherapy'. Radiother Oncol. 2013;109:159–164.
- Tang C, Liao Z, Hess K, et al. Prognosis and predictors of site of first metastasis after definitive radiation therapy for non-small cell lung cancer. Acta Oncol. 2016;55:1022–1028.
- Aerts HJ. The potential of radiomic-based phenotyping in precision medicine: a Review. JAMA Oncol. 2016;2:1636–1642.
- Aerts HJ, Velazquez ER, Leijenaar RT, et al. Decoding tumour phenotype by noninvasive imaging using a quantitative radiomics approach. Nat Comms. 2014;5:4006.
- Leijenaar RT, Carvalho S, Hoebers FJ, et al. External validation of a prognostic CT-based radiomic signature in oropharyngeal squamous cell carcinoma. Acta Oncol. 2015;54:1423–1429.
- Carvalho S, Leijenaar RT, Velazquez ER, et al. Prognostic value of metabolic metrics extracted from baseline positron emission tomography images in non-small cell lung cancer. Acta Oncol. 2013;52:1398–1404.
- Parmar C, Leijenaar RT, Grossmann P, et al. Radiomic feature clusters and prognostic signatures specific for Lung and Head & Neck cancer. Sci Rep. 2015;5:11044.
- van Timmeren JE, Leijenaar RTH, van Elmpt W, et al. Survival prediction of non-small cell lung cancer patients using radiomics analyses of cone-beam CT images. Radiother Oncol. 2017;123:363–369.
- Fave X, Mackin D, Yang J, et al. Can radiomics features be reproducibly measured from CBCT images for patients with non-small cell lung cancer? Med Phys. 2015;42:6784.
- Fave X, Zhang L, Yang J, et al. Delta-radiomics features for the prediction of patient outcomes in non-small cell lung cancer. Sci Rep. 2017;7:588.
- Leijenaar RT, Carvalho S, Velazquez ER, et al. Stability of FDG-PET Radiomics features: an integrated analysis of test-retest and inter-observer variability. Acta Oncol. 2013;52:1391–1397.
- van Timmeren JE, Leijenaar RT, van Elmpt W, et al. Test–retest data for radiomics feature stability analysis: generalizable or study-specific? Tomography. 2016;2:361–365.
- Balagurunathan Y, Gu Y, Wang H, et al. Reproducibility and prognosis of quantitative features extracted from CT images. Transl Oncol. 2014;7:72–87.
- Balagurunathan Y, Kumar V, Gu Y, et al. Test-retest reproducibility analysis of lung CT image features. J Digit Imaging. 2014;27:805–823.
- Fried DV, Tucker SL, Zhou S, et al. Prognostic value and reproducibility of pretreatment CT texture features in stage III non-small cell lung cancer. Int J Radiat Oncol Biol Phys. 2014;90:834–842.
- Zhao B, Tan Y, Tsai WY, et al. Reproducibility of radiomics for deciphering tumor phenotype with imaging. Sci Rep. 2016;6:23428.
- Feldkamp LA, Davis LC, Kress JW. Practical cone-beam algorithm. J Opt Soc Am A. 1984;1:612–619.
- Shafiq-Ul-Hassan M, Zhang GG, Latifi K, et al. Intrinsic dependencies of CT radiomic features on voxel size and number of gray levels. Med Phys. 2017;44:1050–1062.
- Janssens G, Jacques L, Orban de Xivry J, et al. Diffeomorphic registration of images with variable contrast enhancement. Int J Biomed Imaging. 2011;2011:891585.
- Bland JM, Altman DG. Statistical methods for assessing agreement between two methods of clinical meausrement. Lancet. 1986;1:307–310.
- Berkovic P, Paelinck L, Lievens Y, et al. Adaptive radiotherapy for locally advanced non-small cell lung cancer, can we predict when and for whom? Acta Oncol. 2015;54:1438–1444.
- Brink C, Bernchou U, Bertelsen A, et al. Locoregional control of non-small cell lung cancer in relation to automated early assessment of tumor regression on cone beam computed tomography. Int J Radiat Oncol Biol Phys. 2014;89:916–923.
- Bertelsen A, Schytte T, Bentzen SM, et al. Radiation dose response of normal lung assessed by Cone Beam CT – a potential tool for biologically adaptive radiation therapy. Radiother Oncol. 2011;100:351–355.
- Bernchou U, Hansen O, Schytte T, et al. Prediction of lung density changes after radiotherapy by cone beam computed tomography response markers and pre-treatment factors for non-small cell lung cancer patients. Radiother Oncol. 2015;117:17–22.
- Ahn SY, Park CM, Park SJ, et al. Prognostic value of computed tomography texture features in non-small cell lung cancers treated with definitive concomitant chemoradiotherapy. Invest Radiol. 2015;50:719–725.