
Abstract
Background: Targeting tumor vasculature with vascular disrupting agents (VDAs) results in substantial cell death that precede tumor shrinkage. Here, we investigate the potential of hyperpolarized magnetic resonance spectroscopy (HPMRS) to monitor early metabolic changes associated with VDA treatment.
Methods: Mice bearing C3H mammary carcinomas were treated with the VDAs combretastatin-A4-phosphate (CA4P) or the analog OXi4503, and HPMRS was performed following [1-13C]pyruvate administration. Similarly, treated mice were positron emission tomography (PET) scanned following administration of the glucose analog FDG. Finally, metabolic imaging parameters were compared to tumor regrowth delay and measures of vascular damage, derived from dynamic contrast-agent enhanced magnetic resonance imaging (DCE-MRI) and histology.
Results: VDA-treatment impaired tumor perfusion (histology and DCE-MRI), reduced FDG uptake, increased necrosis, and slowed tumor growth. HPMRS, revealed that the [1-13C]pyruvate-to-[1-13C]lactate conversion remained unaltered, whereas [1-13C]lactate-to-[13C]bicarbonate (originating from respiratory CO2) ratios increased significantly following treatment.
Conclusions: DCE-MRI and FDG-PET revealed loss of vessel functionality, impaired glucose delivery and reduced metabolic activity prior to cell death. [1-13C]lactate-to-[13C]bicarbonate ratios increased significantly during treatment, indicating a decline in respiratory activity driven by the onset of hypoxia. HPMRS is promising for early detection of metabolic stress inflicted by VDAs, which cannot easily be inferred based on blood flow measurements.
Introduction
Functional blood vessels delivering oxygen and nutrients are essential for tumor development, however, tumor vessels differ profoundly from the vasculature in normal tissue [Citation1]. Specifically, they are fragile and unstable, lack smooth muscle lining and have defects in the cell-to-cell endothelial junctions. This primitive structure makes them particularly vulnerable to vascular disrupting agents (VDAs) and allows rather selective tumor vessel targeting [Citation2]. To date, numerous agents have undergone extensive pre-clinical evaluation [Citation3] and several are in clinical development [Citation4]. The leading VDA is combretastatin A4 phosphate (CA4P) and is a tubulin-binding agent that interferes with the formation of microtubules leading to anatomical and functional abnormalities in newly formed endothelial cells. These effects cause rapid vascular collapse and subsequent induction of ischemia and necrosis within the central core of the tumor [Citation3]. OXi4503 is a second generation analog of CA4P (cis-isomer of CA4P), and it has been shown to exhibit higher therapeutic efficacy in preclinical studies [Citation5]. This is partly due to OXi4503 inducing greater vascular damage than CA4P [Citation5], but also because it undergoes oxidative activation to a quinone intermediate which gives it direct cell killing properties [Citation6].
Despite significant anti-tumor effects, VDAs generally leave a viable tumor rim, which is nutritionally supported from nearby normal vessels unresponsive to VDAs [Citation3]. Therefore, the potential application of VDAs will be in combination with more conventional therapies, especially radiation [Citation3] and if the appropriate timing and scheduling is used, CA4P and OXi4503 can enhance the effect of radiation therapy [Citation3,Citation7].
Early monitoring of the efficacy of a given cancer treatment is essential. This will allow the most appropriate therapy to be selected at an early stage, thus maximizing treatment efficacy and minimizing side effects from ineffective treatment while providing economic benefits for the health care system. Therefore, the development of imaging methods, that can give an early indication of treatment response, is warranted. The most widely used method for monitoring treatment effect relies on anatomical changes (e.g., tumor shrinkage) that are observable with computed tomographic (CT) or magnetic resonance imaging (MRI) [Citation8], however, not all treatment provide initial size reduction even when effective, and this is particularly true for VDAs due to the remaining viable rim [Citation3]. It is therefore desirable to develop alternative methods to monitor therapeutic efficacy. Measurement of vascular function after treatment with VDAs has so far mostly been performed with dynamic contrast-enhanced magnetic resonance imaging (DCE-MRI) and H215O positron emission tomography (PET) [Citation9,Citation10]. Although DCE-MRI has a high sensitivity, reproducibility between centers is limited by the wide variety of kinetic models and acquisition parameters [Citation11]. H215O PET also has limitations in studies of vascular function, as many scan facilities do not have a cyclotron to produce the short-lived 15O [Citation12].
Tumor treatment response can also be monitored by measuring changes in cancer cell metabolism. FDG uptake monitored by a PET scan is a well-established functional imaging method in oncology [Citation13]. However, FDG-PET, is not the optimal imaging modality in all tumor types because some tumors (e.g., prostate adenocarcinoma) show low FDG uptake [Citation14], whereas in others (e.g., brain), a high background uptake by surrounding normal tissue can mask tumor uptake [Citation15]. Thus, there is a need to develop alternative and complementary techniques for detecting tumor responses to treatment. Magnetic resonance spectroscopy (MRS) allows noninvasive imaging of molecules including sugars, pyruvate and amino acids [Citation16], but sensitivity is poor. The recent development of hyperpolarized 13C enriched metabolites has improved sensitivity by a factor of over 10,000 [Citation17]. For chemical reasons, hyperpolarization is often based on a 13C atom (a stable MR-active-isotope), which can be inserted into biologically active molecules. Not all molecules are suitable for hyperpolarized magnetic resonance spectroscopy (HPMRS), but pyruvate is especially interesting, as it is an important intermediate in many biochemical pathways, including central energy metabolism, and is rapidly hyperpolarized with a relatively long T1 relaxation time [Citation18]. Since HPMRS relies on naturally occurring and non-radioactive molecules, scans can, if desired, be repeated before, during and after treatment. The first-in-man study suggests that HPMRS may be valuable for initial diagnosis and for monitoring therapy [Citation19]. Specifically, HPMRS based assessment could lead to a better characterization of tumor metabolism and microenvironment, guide the selection of more precise treatment and make early evaluation and adjustment of treatment, possible.
Here, we investigate the vascular hemodynamic and metabolic consequence of VDAs treatment in a murine C3H mammary carcinoma model. We hypothesized that early after VDA treatment initiation and before the development of excessive necrosis, tumor oxygenation will deteriorate leading to a relative shift in the metabolic fate of pyruvate with reduced oxidation and possibly increased lactate formation.
Material and methods
Animal and tumor model
Female CDF1 mice were used in all experiments when at 200 mm3 in size. The derivation and maintenance of this tumor have been described previously [Citation20]. All animal experiments were performed according to the animal welfare policy of Aarhus University (http://dyrefaciliteter.au.dk) with the Danish Animal Experiments Inspectorate's approval.
Drug preparation
The VDAs used in this study included CA4P and its derivative OXi4503 (supplied by Mateon Therapeutics, Inc., South San Francisco, CA, USA); they were dissolved in either phosphate buffered saline (PBS; CA4P) or sterile saline (OXi4503) prior to each experiment and injected intraperitoneally (i.p.) at 0.02 ml/g mouse body weight.
Estimation of necrotic fraction
Tumor bearing mice were sacrificed by cervical dislocation 24 h after i.p. injection of different doses of CA4P or OXi4503, the tumors excised, and fixed in formalin, as previously described [Citation21]. Tumors were then sectioned and a random section chosen for analysis along with two additional sections that were separated by 400 μm from each previous section. Sections were hematoxylin and eosin stained and examined under a projecting microscope. Using a test system of equidistant points, the total number of points hitting the tumor (nT) and necrosis (nN) were recorded and necrotic fraction of the tumor defined by Σ nN/Σ nT.
Tumor regrowth
Treatment with different doses of CA4P and OXi4503 was assessed using a tumor growth time (TGT) assay. This involved treating mice with the VDAs when tumors had reached a volume of 200 mm3, and then determining tumor volume on a daily basis five times weekly (Monday to Friday) and calculating the time to reach five times pretreatment volume (TGT5).
HPMRS experimental set-up
Mice were treated with VDAs, injected i.p. three (CA4P) or six hours (OXi4503) prior to HPMRS. Non-anaesthetized mice were restrained in jigs, with their tumor-bearing legs exposed. Rectal temperature was measured, and a tail vein was cannulated and connected to a 110 cm line suitable for injection of [1-13C]pyruvate. Prior to HPMRS, the magnet bore of the 9.4 T MRI scanner system was heated to 23 °C. To secure sufficient oxygen supply, mice were gassed with atmospheric air at a flow rate of 2.5 l/min during HPMRS. A 13C 11 mm surface coil (Agilent, Santa Clara, CA, USA) positioned approximately 2 mm above the tumor was used for MR acquisitions. Mice were injected into the tail vein with a volume of 200 μl hyperpolarized [1-13C]pyruvate over a period of 30 seconds. Transfer time between dissolution and injection of hyperpolarized [1-13C]pyruvate was 26 seconds on average. After completing the scan, body temperature of the mouse was measured and Hoechst-33342 injected before sacrificing the animal (see below).
Estimation of vascular parameters
Following HPMRS, 15 mg/kg of the functional perfusion marker Hoechst-33342, was injected through the line into the tail vein in a volume of 4 ml/kg. After 1-minute circulation time, mice were sacrificed, tumors excised and immediately frozen. The following parameters were estimated: perfused area fraction, perfused number fraction, perfused vessel density and necrotic fraction.
FDG-PET and autoradiography experimental set-up
Scans were conducted using a high-resolution Mediso nanoScan PET/MRI (Mediso Ltd., Budapest, Hungary) with a spatial resolution of approximately 1 mm. Mice were treated as described for the HPMRS experiments and administered a FDG bolus via the tail vein and PET scanned 55–65 min after tracer injection. Subsequently, a 10 min anatomical MRI scan for tissue delineation was performed. Immediately following the scans, mice were sacrificed and brains and tumors were dissected, weighed and analyzed for radioactivity using a Packard well gamma counter (Packard Instruments Co., Meriden, CT). In addition, equatorial 10 μm cryo-sections were cut for high-resolution autoradiographic analysis of the intratumoral distribution of FDG.
DCE-MRI
A 7-T spectroscopy/imaging system (Varian Medical Systems, Palo Alto, CA) was used for DCE-MRI. Reduction in perfusion was estimated analyzing the initial area under the curve (IAUC) from concentration–time curves (90 s). IAUC is a robust estimate of vascularization, and it is easily comparable between studies [Citation22]. DCE-MRI was performed before and 3 h after CA4P administration (50 and 250 mg/kg) and 6 h after OXi4503 (50 mg/kg) making the results comparable with the HPMRS and FDG-PET scans.
For further details on Material and methods, see Supplemental material.
Statistical analysis
Results are expressed as the mean (±1 SE) and statistical significant differences between measurements were determined using one-way analysis of variance (ANOVA) followed by post hoc tests, as indicated in the figure legends. Data were log-transformed prior to analysis if necessary to meet the assumptions of normality. For all statistical tests, the significance level was p < .05.
Results
Histology and tumor growth
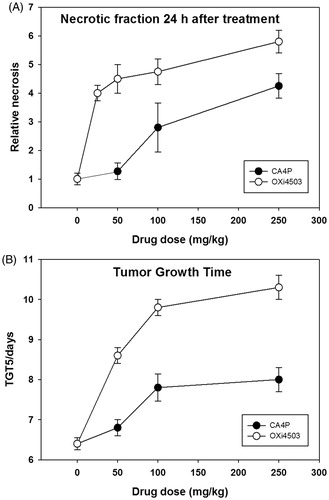
To demonstrate and compare the anti-tumor activity of both VDAs, we measured the development of tumor necrosis and tumor growth inhibition (). Tumor tissue analysis 24 h post-treatment revealed a significant induction of necrosis which increased in a drug-dose dependent way for both VDAs, with OXi4503 being more effective than CA4P at all tested doses (). Treatment-induced cell death was largely mirrored by slowed tumor growth as shown by an increase in the time required to reach five times the pretreatment volume (). Based on the data of , we selected 50 mg/kg OXi4503 for all further studies and two doses of CA4P; an OXi4503 identical dose (50 mg/kg) and one that had an equivalent anti-tumor effect (250 mg/kg).
Figure 1. Dose–response effects of VDAs. (A) Relative necrosis that develops 24 hours after VDA treatment. (B) The time taken in days for tumors to reach five times the treatment volume of 200 mm3 (TGT5). Results for both necrosis and TGT5 are from an average of six animals. Data points are indicated as mean ± SE.
Analysis of vessels and vessel perfusion, using endothelial cell immunostainings and the perfusion marker Hoechst-33342 revealed VDA treatment induced changes in vascular function (). These measurements were made in the same animals as used for the HPMRS studies and were performed at three and six hours after injecting CA4P and OXi4503, respectively. Previous studies with CA4P [Citation23] and OXi4503 (Horsman, unpublished observations) had shown that vascular shut-down was maximal at these times. All perfusion parameters showed large changes with the VDAs compared to controls. These decreases were significant for all parameters following OXi4503 treatment, but only the perfused fraction number was significantly reduced with CA4P. Interestingly, these perfusion changes occurred long before any significant increase in necrotic fraction.
Table 1. Histologic vascular parameters in control and VDA-treated animals measured at 3 h (CA4P) or 6 h (OXi4503) after treatment. Results are means (±SE) and the number of animals per group is 5–6; measurements were made on the same animals as used for the HPMRS study.
HPMRS, FDG-PET and DCE-MRI
Administration of hyperpolarized [1-13C]pyruvate via the tail vein resulted in a readily detectable 13C MR spectra showing [1-13C]pyruvate (170 ppm) and [1-13C]lactate (183 ppm) peaks in the C3H mammary carcinoma (). Time evolution of the hyperpolarized [1-13C]pyruvate and [1-13C]lactate over a period of 120 seconds (starting∼10 second post administration), showed the delayed built-up of labeled lactate compared to labeled pyruvate, as displayed in . The [1-13C]pyruvate-to-[1-13C]lactate conversion, as quantified by their AUC ratio, was not altered by treatment with VDAs (). In contrast, treatment resulted in significantly elevated [1-13C]lactate-to-[13C]bicarbonate AUC ratios (), and significantly reduced [13C]bicarbonate-to-[1-13C]pyruvate AUC ratios (). Treatment response was also assessed using DCE-MRI and, in accordance with histological findings, a significant reduction in tumor perfusion was seen in mice treated with VDAs compared to control mice ().
Figure 2. (A) Representative 13C spectra of a C3H mammary carcinoma, showing from left: lactate, pyruvate-hydrate, alanine, signal impurity, pyruvate, urea and bicarbonate. (B): Time evolution of the hyperpolarized [1-13C]pyruvate and [1-13C]lactate, showing the delayed conversion of lactate compared to pyruvate. (C) Relative change (normalized to control animals) in the pyruvate/lactate ratio measured using HPMRS either 3 h (CA4P) or 6 h (OXi4503) after treatment. (D) As in (C) but for the lactate/bicarbonate ratio. (E) As in (C) but for the bicarbonate/pyruvate ratio. (F) Relative change in the IAUC measured using DCE-MRI either 3 h (CA4P) or 6 h (OXi4503) after treatment. Results shown in C–F are means (±1 SE). Treated animals were compared to control animals using a one-way ANOVA followed by a Holm-Sidak test. *Changes significantly different from control (p < .05). Experiments involving different scanner technologies were conducted on separate cohorts of animals. The CA4P DCE-MRI data are from a previous publication (Nielsen et al., 2008, Int J Radiat Oncol Biol Phys. 70:859–866).
![Figure 2. (A) Representative 13C spectra of a C3H mammary carcinoma, showing from left: lactate, pyruvate-hydrate, alanine, signal impurity, pyruvate, urea and bicarbonate. (B): Time evolution of the hyperpolarized [1-13C]pyruvate and [1-13C]lactate, showing the delayed conversion of lactate compared to pyruvate. (C) Relative change (normalized to control animals) in the pyruvate/lactate ratio measured using HPMRS either 3 h (CA4P) or 6 h (OXi4503) after treatment. (D) As in (C) but for the lactate/bicarbonate ratio. (E) As in (C) but for the bicarbonate/pyruvate ratio. (F) Relative change in the IAUC measured using DCE-MRI either 3 h (CA4P) or 6 h (OXi4503) after treatment. Results shown in C–F are means (±1 SE). Treated animals were compared to control animals using a one-way ANOVA followed by a Holm-Sidak test. *Changes significantly different from control (p < .05). Experiments involving different scanner technologies were conducted on separate cohorts of animals. The CA4P DCE-MRI data are from a previous publication (Nielsen et al., 2008, Int J Radiat Oncol Biol Phys. 70:859–866).](/cms/asset/ddd03a47-2702-4e7f-978d-0cc6fe3a6ff4/ionc_a_1351622_f0002_c.jpg)
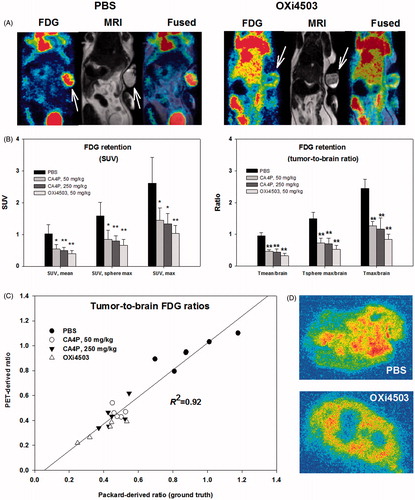
Visual inspection of FDG-PET images clearly showed that VDA treatment reduced tumor-to-normal tissue image contrast suggesting lowered tumor uptake (). Reduced tumor FDG uptake was also supported by quantitative analysis of whole-tumor or tumor sub-volume FDG retention following VDA treatment with little difference between CA4P and OXi4503 (). Traditional SUV based quantification and tumor-to-reference tissue (brain) quantification were in close agreement, but the latter approach proved slightly more robust, resulting in less variability and thus higher significance levels [Citation24]. Furthermore, a direct comparison between image-derived tissue ratios and ex vivo measurements of radioactivity in dissected tissue confirmed the validity of this imaged-based method, as a close relationship (R2 = 0.92) between PET-derived and gamma counter derived whole-tumor to whole-brain tracer ratios was found (). High-resolution autoradiograms revealed reduced FDG signal in the tumor core following treatment ().
Figure 3. FDG-PET as a means to visualize and quantify early metabolic changes during VDA treatment. (A) FDG-PET/MRI images showing a PBS treated (control) and an OXi4503 treated tumor-bearing mice. Arrows indicate tumor location. (B) Bar charts show summarized data for all treatments using SUV or reference-tissue-based quantification of whole-tumor average or tumor sub-volume glucose metabolism. Mean values ± SD are plotted. Treated animals were compared to control animals using a one-way ANOVA followed by Tukey’s test. Values significantly different from controls are indicated by *p < .05, **p < .001. (C) Scatterplot showing the close relationship between PET-derived and gamma counter derived (ground truth) whole-tumor to whole-brain tracer ratios. (D) Examples of high-resolution invasive analysis of the intratumoral distribution of FDG retention.
Discussion
The principal aim of this study was to investigate the usefulness of HPMRS to monitor metabolic changes induced by CA4P and its structural analog OXi4503. Both VDAs induced clear effects in this C3H mammary carcinoma model, as illustrated by profound changes in tumor perfusion, glucose metabolism, tumor necrosis and tumor growth. Although the [1-13C]pyruvate-to-[1-13C]lactate AUC ratio was unaffected by treatment, the [1-13C]lactate-to-[13C]bicarbonate AUC ratio increased significantly during treatment, suggesting that this parameter is a sensitive marker of energetic stress induced by vessel damage and the development of hypoxia.
Since VDA’s work by damaging the tumor-feeding vasculature, an obvious first-choice biomarker for the efficacy of treatment is blood flow. Perfusion changes can be monitored using clinically relevant technologies such as DCE-MRI, perfusion-CT or H215O-PET. Despite its inherent inability to separate between changes in blood flow and vessel permeability, DCE-MRI has received the bulk of attention [Citation9,Citation22]. Indeed, we observed changes in DCE-MRI (), which was in accordance with invasive histological analyses showing reduced vessel function (), necrosis induction () and reduced tumor growth (), suggesting a role for DCE-MRI for early prediction of treatment efficacy. Still, even if reliable perfusion measurements are available, subsequent cell killing may not easily be predicted based on blood flow changes, since tumor cells differ profoundly in their metabolic needs and robustness to nutritional starvation. Furthermore, in tumor tissue, blood flow and metabolic activity may correlate poorly globally or locally which may preclude meaningful estimates of the extent of oxygen and nutrient deprivation inflicted by a given reduction in blood flow. The inclusion of refined metabolic imaging technologies such as HPMRS and FDG-PET, that provides information on cellular metabolic status, may therefore be valuable on their own or in combination with direct or indirect measures of perfusion for early prediction of ultimate cell death.
PET imaging revealed highly significant and robust reductions in FDG tumor signal for all treatments regardless of the quantification approach, suggesting that glucose delivery and uptake are compromised or adaptively down-regulated, and that FDG-PET may be a useful tool for early treatment efficacy assessment (). For a treatment that induces massive central necrosis and leaves a largely unaffected rim of viable tumor cells, traditional PET SUV based quantification of a single tumor voxel, may not accurately recapitulate the overall tumor effect, but surprisingly, whole-tumor mean and tumor sub volume analysis were largely in agreement. Static PET assessments do not provide an accurate measure of glucose metabolic rate and lower SUV values during VDA treatment may indicate progressing cell death, adaptively reduced energy expenditure, and/or compromised FDG delivery. In addition, energy production from endogenous glucose reserves (e.g., glycogen) and autophagy may further complicate the relationship between reduced FDG signal and subsequent cell killing. Dynamic FDG-PET, and pharmacokinetic modeling, may allow us to separate between perfusion limitations and lowered metabolic activity/cell death and may serve as a valuable experimental tool, but such scan procedures are time-consuming and complex to perform and thus unattractive in a clinical routine. Nonetheless, FDG-PET may be particularly valuable to detect regrowth in tumor foci following restoration of perfusion, although the inherent low resolution in PET may prevent very early assessment of such viable, potentially treatment-decisive, areas. Future work should further define the usefulness of static and dynamic FDG-PET in VDA treatment guidance and specifically unravel whether it provides reliable information on metabolic alterations that translates into clinical relevant antitumor effects.
FDG-PET only provides information on the initial steps of glycolysis (uptake/trapping). In contrast, HPMRS is more refined and allows us to track and quantify the formation rates of metabolites formed, for example, from [1-13C]pyruvate, which may allow us to separate between exclusively perfusion-linked changes in biomarker distribution and true cellular metabolic changes. A previous rodent study in a lymphoma tumor model, showed that the apparent rate constant, describing label exchange between pyruvate and lactate, was reduced 6 h after CA4P treatment, and the authors concluded that this was likely caused by reduced tumor blood flow leading to reduced delivery of [1-13C]pyruvate [Citation25]. The AUC ratio of [1-13C]pyruvate and [1-13C]lactate, derived from time-concentration curves, was not changed during VDA treatment in our study (), when measured 3 h after drug administration. Lack of response, for this HPMRS-derived parameter, may relate to the tumor model used or to timing between the VDA treatment and HPMRS, although the 3 h (CA4P) and 6 h (OXi4503) intervals selected have been shown to be optimal for both VDAs in this C3H mammary carcinoma model ([Citation23] and Horsman unpublished observations). It may also relate to the working mechanism of these VDAs, where the metabolic alterations are delayed compared to the hemodynamic response. Furthermore, a viable well-nourished and metabolically unaltered tumor rim and a tumor core with no blood flow (i.e., no delivery of [1-13C]pyruvate) could in principle pass unnoticed, since our data provide measures of whole tumor mean responses. Therefore, tumor maps showing the intratumoral heterogeneity in treatment response may be more informative, but may also induce noise. Importantly, most tumor cells produce waste amounts of lactate even in the presence of oxygen (Warburg’s effect), and this inherent glycolytic phenotype may dampen relative changes in the pyruvate-to-lactate conversion during the development of hypoxia in cancerous tissue.
Since vascular shut down leads to hypoxia and cessation of respiration, stimulation of LDH activity and increased reliance on anaerobic ATP synthesis, we hypothesized that simultaneous assessment of 13C label built-up in lactate and bicarbonate (from respiration-derived CO2) may provide a more sensitive and specific measure of metabolic status, that is insensitive to [1-13C] pyruvate delivery. This was indeed the case, since a profound increase in the [1-13C]lactate-to-[13C]bicarbonate AUC ratio was observed during treatment (). The bicarbonate peak is rather weak () which may explain the relatively large standard deviation in (compared to ), but nonetheless, changes were highly significant and data variability may simply reflect true inter-animal variability in treatment response.
Overall, our findings support a role of HPMRS for early assessment of metabolic stress inflicted by VDA treatment, although this may require that also changes in bicarbonate labeling are considered rather than a traditional approach that only quantifies the conversion of pyruvate to lactate. Future studies should focus on establishing a linkage between HPMRS derived parameters and clinical relevant endpoints (e.g., tumor control probability) in animals treated with potentially curative treatment (e.g., VDA combined with radiotherapy).
IONC_A_1351622_Supplementary_Information.zip
Download Zip (17.6 KB)Acknowledgments
The authors would like to thank Ms. I.M. Horsman, Ms. D. Grand, Mr. M. Johannsen, Ms. P. Schjerbeck, Ms. M. Simonsen and Mr. H. Vestergaard for excellent technical assistance.
Compliance with ethical standards and ethical approval: All applicable international, national and/or institutional guidelines for the care and use of animals were followed.
Disclosure statement
The authors report no conflicts of interest and alone are responsible for the content and writing of the paper.
Additional information
Funding
Related Research Data
References
- Vaupel P, Kallinowski F, Okunieff P. Blood flow, oxygen and nutrient supply, and metabolic microenvironment of human tumors: a review. Cancer Res. 1989;49:6449–6465.
- Tozer GM, Kanthou C, Baguley BC. Disrupting tumour blood vessels. Nat Rev Cancer. 2005;5:423–435.
- Horsman MR, Siemann DW. Pathophysiologic effects of vascular-targeting agents and the implications for combination with conventional therapies. Cancer Res. 2006;66:11520–11539.
- Clemenson C, Chargari C, Deutsch E. Combination of vascular disrupting agents and ionizing radiation. Crit Rev Oncol Hematol. 2013;86:143–160.
- Salmon HW, Siemann DW. Effect of the second-generation vascular disrupting agent OXi4503 on tumor vascularity. Clin Cancer Res. 2006;12:4090–4094.
- Folkes LK, Christlieb M, Madej E, et al. Oxidative metabolism of combretastatin A-1 produces quinone intermediates with the potential to bind to nucleophiles and to enhance oxidative stress via free radicals. Chem Res Toxicol. 2007;20:1885–1894.
- Iversen AB, Busk M, Horsman MR. Induction of hypoxia by vascular disrupting agents and the significance for their combination with radiation therapy. Acta Oncol. 2013;52:1320–1326.
- Neves AA, Brindle KM. Assessing responses to cancer therapy using molecular imaging. Biochim Biophys Acta. 2006;1766:242–261.
- Galbraith SM, Maxwell RJ, Lodge MA, et al. Combretastatin A4 phosphate has tumor antivascular activity in rat and man as demonstrated by dynamic magnetic resonance imaging. JCO. 2003;21:2831–2842.
- Anderson HL, Yap JT, Miller MP, et al. Assessment of pharmacodynamic vascular response in a phase I trial of combretastatin A4 phosphate. J Clin Oncol. 2003;21:2823–2830.
- O'connor JP, Jackson A, Asselin MC, et al. Quantitative imaging biomarkers in the clinical development of targeted therapeutics: current and future perspectives. Lancet Oncol. 2008;9:766–776.
- Weber WA. Positron emission tomography as an imaging biomarker. J Clin Oncol. 2006;24:3282–3292.
- Sengupta D, Pratx G. Imaging metabolic heterogeneity in cancer. Mol Cancer. 2016;15:4.
- Takahashi N, Inoue T, Lee J, et al. The roles of PET and PET/CT in the diagnosis and management of prostate cancer. Oncology. 2007;72:226–233.
- Phelps ME, Mazziotta JC. Positron emission tomography: human brain function and biochemistry. Science. 1985;228:799–809.
- Serrao EM, Brindle KM. Potential clinical roles for metabolic imaging with hyperpolarized [1-(13)C]pyruvate. Front Oncol. 2016;6:59.
- Ardenkjaer-Larsen JH, Fridlund B, Gram A, et al. Increase in signal-to-noise ratio of >10,000 times in liquid-state NMR. Proc Natl Acad Sci USA. 2003;100:10158–10163.
- Golman K, In'T Zandt R, Thaning M. Real-time metabolic imaging. Proc Natl Acad Sci USA. 2006;103:11270–11275.
- Nelson SJ, Kurhanewicz J, Vigneron DB, et al. Metabolic imaging of patients with prostate cancer using hyperpolarized [1-(1)(3)C]pyruvate. Sci Transl Med. 2013;5:198ra108.
- Overgaard J. Simultaneous and sequential hyperthermia and radiation treatment of an experimental tumor and its surrounding normal tissue in vivo. Int J Radiat Oncol Biol Phys. 1980;6:1507–1517.
- Horsman MR, Ehrnrooth E, Ladekarl M, et al. The effect of combretastatin A-4 disodium phosphate in a C3H mouse mammary carcinoma and a variety of murine spontaneous tumors. Int J Radiat Oncol Biol Phys. 1998;42:895–898.
- Nielsen T, Wittenborn T, Horsman MR. Dynamic contrast-enhanced magnetic resonance imaging (DCE-MRI) in preclinical studies of antivascular treatments. Pharmaceutics. 2012;4:563–589.
- Murata R, Overgaard J, Horsman MR. Comparative effects of combretastatin A-4 disodium phosphate and 5,6-dimethylxanthenone-4-acetic acid on blood perfusion in a murine tumour and normal tissues. Int J Radiat Biol. 2001;77:195–204.
- Busk M, Munk OL, Jakobsen S, et al. FDG-PET reproducibility in tumor-bearing mice: comparing a traditional SUV approach with a tumor-to-brain tissue ratio approach. Acta Oncol. 2017;56:706–712.
- Bohndiek SE, Kettunen MI, Hu DE, et al. Detection of tumor response to a vascular disrupting agent by hyperpolarized 13C magnetic resonance spectroscopy. Mol Cancer Ther. 2010;9:3278–3288.