
Abstract
Background: Static positron emission tomography (PET) allows mapping of tumor hypoxia, but low resolution and slow tracer retention/clearance results in poor image contrast and the risk of missing areas where hypoxic cells and necrosis are intermixed. Fully dynamic PET may improve accuracy but scan protocols suitable for routine clinical use are warranted. A modeling study proposed that hypoxia specificity can be improved by a clinically feasible blood-flow normalization procedure that only requires a 10- to 15-min dynamic scan (perfusion), followed by a short late static scan, but experimental validation is desired.
Methods: Tumor-bearing mice were administered pimonidazole (hypoxia marker) and the PET hypoxia-tracer 18F-azomycin arabinoside (FAZA) and scanned for 3h. Subsequently, the distributions of FAZA (autoradiography) and hypoxic cells (pimonidazole) were compared on tissue sections. PET images collected in 10-min time intervals between 60 and 90 min post-injection (PETearly), which mimics the image contrast seen in patients, were compared voxel-by-voxel to 3-h PET (PETlate). For comparison, PETearly was normalized to the perfusion peak area, deduced from the first 10 min of the scan (PETperf), and the resulting parameter PETearly/PETperf was compared with PETlate.
Results: Tissue analysis revealed a near-perfect spatial match between FAZA signal and hypoxic cell density (pimonidazole) 3 h post-injection, regardless of the tumor type. Only a weak inverse or no correlation between PETperf and PETlate was seen, and the correlation between PETearly/PETperf and PETlate proved inferior to the correlation between PETearly and PETlate.
Conclusions: Late PET scans in rodents, unlike patients, provide an accurate map of hypoxia against which earlier time-point scans can be compared. PETearly and PETlate correlated to a variable extent but the correlation was lowered by normalization to perfusion (PETearly/PETperf). Our study challenges the validity/robustness of a perfusion normalization approach. This may reflect that the chaotic tumor vasculature uncouples microregional blood flow and oxygen extraction.
Introduction
Tumor hypoxia is linked to treatment resistance and is an important contributor to treatment failure [Citation1]. Several approaches to overcome the negative influence of tumor hypoxia are available, including the following: (i) treatment with radiosensitizers, (ii) hypoxia-activated pro-drugs and (iii) dose painting where radiation dose is escalated to hypoxic tumors or tumor sub-volumes [for reviews see Citation1,Citation2]. However, to offer the best possible therapy for individual patients, there is need for technologies that are able to identify hypoxic tumors, and for some treatments like dose painting, even maps showing the intratumoral distribution of hypoxic cells are required. The leading technology for noninvasive assessment of hypoxia in clinical settings is undoubtedly hypoxia positron emission tomography (PET). However, owing to slow tracer retention and clearance of unbound tracer, hypoxia PET results in images with poor intertissue and intratumoral image contrast even hours after tracer administration, and the problem is aggravated by the intrinsic low resolution of PET. The problem is particularly evident in tumors containing areas where viable tracer retaining hypoxic cells and necrosis with no tracer activity are intermixed, since such areas, because of signal dilution, may be missed by simple threshold-based image quantification [Citation3].
Intense efforts to develop better PET hypoxia tracers have been undertaken (e.g., [Citation4]); however, second-generation tracers like FAZA and 18F-flortanidazole (HX4) are not markedly superior to the standard tracer 18F-fluoromisonidazole (FMISO) [Citation5]. Full dynamic scans with calculation of relevant rate constants may overcome such limitations and improve the accuracy of hypoxia PET but are certainly not feasible in clinical routine. A reduced partly dynamic scan protocol has been proposed, for which patients are scanned dynamically for 15–30 min after receiving the hypoxia imaging agent and then again twice at later time points 2 and 4 h post-injection (PI), which in principle allows construction of tissue time activity curves using image co-registration and interpolation between missing time points [Citation6]. A subsequent modeling study suggested that an even simpler model consisting of a short dynamic scan (10–15 min) and a single late time static scan (e.g., 4 h PI), resulting in a total scan time of 30–40 min, is sufficient to improve the accuracy of hypoxia imaging substantially [Citation7]. Specifically, based on a 2D simulation model, it was shown that normalization of late time static scans to a surrogate perfusion measure (deduced from the area under the curve from the dynamic part of the scan), on a voxel-by-voxel basis, results in a corrected image with better correlation between voxel signal intensity and voxel median partial oxygen pressure (pO2).
The purpose of this study was to experimentally test whether a simple voxel-by-voxel perfusion correction improves the accuracy of hypoxia PET imaging, using dynamic FAZA hypoxia PET scan data obtained in tumor-bearing mice. Specifically, we exploit the fact that tracer kinetics, including effective wash-out of unbound tracer, is much more favorable in small animals, resulting in excellent hypoxia specificity at late time points [Citation8] and the possibility for post-scan invasive analysis, thus establishing a ‘ground truth’ against which raw or normalized imaging voxel parameters can be compared.
Material and methods
Animal and tumor models
Athymic NMRI-nu/nu and conventional C3H/HeNTac female mice were used as hosts for subcutaneous human or murine tumors, respectively. The murine SCCVII tumor was established in the footpad in the hind leg, which allows easy and effective tumor immobilization. Since human tumors, in our experience, grow poorly in the footpad, SiHa (human cervix) and PC3 (human prostate) were instead grown in the lower back. To stimulate reproducible tumor growth, human tumor cells were co-injected with High Concentration Matrigel (BD Biosciences, San Jose, CA, USA). All animal experiments were conducted according to the animal welfare policy of Aarhus University (hppt://dyrefaciliteter.au.dk) with approval from the Danish Animal Experiments Inspectorate (2012-15-2934-00087).
PET scans
PET scans were conducted in three animals per tumor model when tumors reached a volume of 500–1000 mm3, a size that allows PET studies on intratumoral heterogeneity in tracer kinetics. Anaesthesia was quickly induced with 4%–5% isoflurane, which was lowered to ∼3% during tail vein characterization and 1.5%–2% for maintenance under scans. Air was used as balance. Before the start of scan, mice were administered intraperitoneally with 60 mg/kg of the hypoxia probe pimonidazole, which allows subsequent immunological high-resolution mapping of hypoxic cells (‘ground truth’). Mice were then injected with 20–40 MBq FAZA in a small volume of saline via the vein line and PET scanned dynamically for 180 min using a Mediso nanoScan PET/MRI scanner (Mediso Medical Imaging Systems Ltd., Budapest, Hungary). PET listmode data were reconstructed with a 3D iterative algorithm (Tera-Tomo 3D, full detector model and normal regularization; Mediso Medical Imaging Systems Ltd., Budapest, Hungary) with four iterations and six subsets. PET images were reconstructed into 40 time frames of appropriate length at a voxel size of 0.4 × 0.4 × 0.4 mm3 or 0.8 × 0.8 × 0.8 mm3. Data were corrected for randoms, dead time and decay but not for attenuation and scatter because of the small size of the animals.
All post-imaging analyses were performed using the View and Fusion plug-ins of the PMOD software (PMOD Technologies Ltd., Zürich, Switzerland). Tumors were delineated from the last frame of the scan and whole-tumor average time–activity curves (TACs) were extracted. In addition, summed images representing three different stages of the scan were derived. Late time images were derived from an interval of 160 to 180 min PI (PETlate), when image contrast (i.e., hypoxia specificity) is excellent, far exceeding what is observed in patients [Citation8]. Images that mimic the contrast obtainable in patients were derived from 60 to 70 (PET60), 70 to 80 (PET70) and 80 to 90 min (PET80) PI and then compared voxel-wise to PETlate. In addition, PET60, PET70 and PET80 were divided by (e.g., normalized to) a simple surrogate measure of perfusion (tracer wash-in, determined as the time-averaged signal 0–10 min PI [PETperf]) and again compared voxel-wise to PETlate. To assess the influence of voxel noise issues, analyses were performed using two different voxel sizes.
Autoradiography and immunohistology (assessment of hypoxia specificity at late PET scan times)
After scan, tumors were excised and snap frozen in cooled isopentane, and equatorial 10-μm tissue cryosections were prepared. Subsequently, the intratumoral distribution of FAZA was revealed by exposing dried tissue sections to Fujifilm BAS-SR 2025 phosphor imaging plates (Tokyo, Japan). Tracer signal was read at a pixel size of 25 μm using a BAS-5000 bioimaging analyzer and visualized and analyzed with the ImageGauge software (Fujifilm, Tokyo, Japan). Following autoradiographic analysis, cryosections were stained for pimonidazole adducts and counterstained with hematoxylin as described previously [Citation8]. Pimonidazole-stained tissue sections were digitalized using a Hamamatsu NanoZoomer slide scanner (Hamamatsu Photonics, Shizuoka, Japan) and converted into binary images using the ImageJ analysis software (NIH, Bethesda, MD, USA). In short, a representative background signal was derived from a viable, homogenous and non-hypoxic (unstained) area. Using a threshold of 50% above the background signal, images were then converted into binary images showing pimonidazole-positive areas. Finally, FAZA autoradiograms and pimonidazole maps were co-registered and covered with a 1 × 1 mm grid (resembling the resolution limit in small-animal PET scanners) resulting in scatter plots showing the spatial linkage between tracer signal and hypoxic cell density (i.e., cells with pO2 below 10 mm Hg). Only pixels fully contained within the tumor area were included, and pixels with large tissue holes and folds were excluded. In contrast, areas of necrosis were not omitted since the purpose of this analysis was to estimate the expected late-time quantitative accuracy of PET images.
Statistics
The extent of spatial similarity between early PET images, uncorrected or perfusion-normalized and late PET images and between autoradiograms and pimonidazole maps were analyzed by the Pearson linear regression and reported as values for individual animals.
Results
Post-imaging invasive tissue analysis revealed that the distribution of FAZA is largely identical to the distribution of hypoxic cells as quantified by the distribution of pimonidazole adducts which forms at O2 levels below ∼10 mmHg, showing that hypoxia PET scans in tumor-bearing rodents map hypoxia accurately at late time points (). Time–activity curves (TACs) varied widely between tumor models (, Supplementary Figure S1). Although FAZA distributed very heterogeneously within the tumor volume at late time points, variability of TACs within a given tumor (subvolume analysis) or tumor model was much lower than the variability between tumors, especially for SCCVII and SiHa (, Supplementary Figure S1). summarizes our correlation analyses, whereas representative examples for individual animals are provided in . Generally, no or only a weak inverse correlation between PETperf and PETlate (i.e., extent of hypoxia shown in ) was observed. At 60–70 min PI (PET60), some hypoxia specificity was evident, and specificity improved somewhat at 70–80 (PET70) and 80–90 (PET80) min PI. Perfusion-normalized PET60, PET70 and PET80 images generally correlated less well with PETlate than did raw PET60, PET70 and PET80. Increasing voxel size or introducing a smoothing process (to reduce potential voxel noise) improved the spatial correlation between early and late scans, but again the correlation was weakened by introducing a perfusion normalization step.
Figure 1. Experimental set-up and rationale for conducting the study. (A): Time series for FAZA-PET showing that in tumor-bearing mice (unlike patients), excellent hypoxia specificity is ultimately reached at late scan time points. We hypothesized that a clinical realistic intertissue and intratumoral image contrast is reached somewhere in the interval from 1 to 1.5 h PI (see section Discussion). (B): Invasive analysis confirming that late time PET scans in tumor-bearing mice are characterized by excellent hypoxia specificity (i.e., hypoxia maps are reliable). First row: Pimonidazole staining showing the distribution of pimonidazole adducts (hypoxic cells). Second row: Matching FAZA autoradiogram determined before pimonidazole staining using the same section. Last row: scatter plots showing the degree of spatial match between FAZA signal and density of hypoxic cells (segmented pimonidazole, see section Material and methods) using a pixel size of 1 mm2. It is clear that the distribution of tracer largely reflects the distribution of viable hypoxic cells. FAZA: 18F-azomycin arabinoside; PET: positron emission tomography.
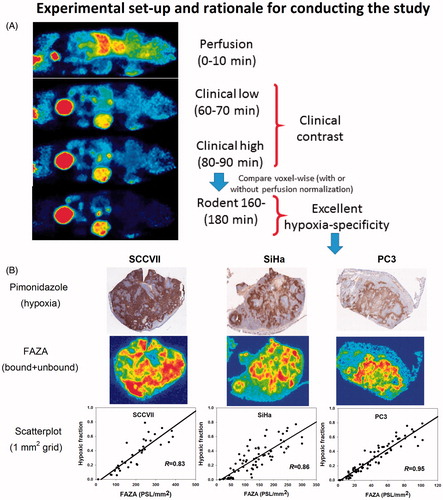
Figure 2. Scatterplot analysis for SCCVII. (A–C): PET images in two planes showing the time-dependent development of the intratumoral FAZA distribution in an SCCVII foot tumor. (D): whole-tumor TAC showing the distribution over time in average tumor tracer signal. (E): voxel-by-voxel correlation between late (PETlate: 160–180 min PI) and early (PETperf: 0–10 min PI) FAZA signal. (F): voxel-by-voxel correlation between PETlate and FAZA signal 60 min PI (PET60). (G): voxel-by-voxel correlation between PETlate and PET60 normalized to a perfusion surrogate measure derived as the average signal from 0 to 10 min PI (PET60/PETperf). FAZA: 18F-azomycin arabinoside; PET: positron emission tomography; PI: post-injection; TAC: time–activity curve.
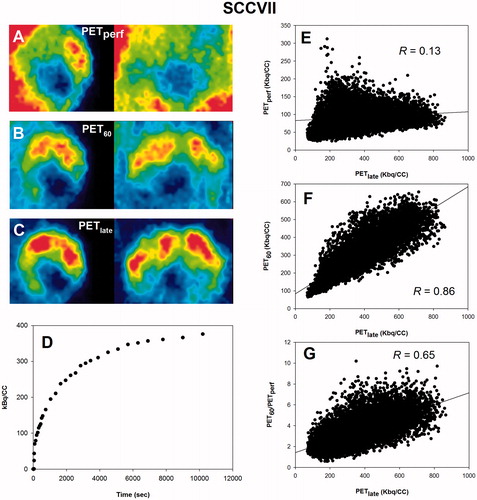
Figure 3. Scatterplot analysis for SiHa. (A–C): PET images in two dimensions showing the time-dependent development of the intratumoral FAZA distribution in an SiHa back tumor. (D): whole-tumor TAC showing the distribution over time in average tumor tracer signal. (E): voxel-by-voxel correlation between late (PETlate: 160–180 min PI) and early (PETperf: 0–10 min PI) FAZA signal. (F): voxel-by-voxel correlation between PETlate and FAZA signal 60 min PI (PET60). (G): voxel-by-voxel correlation between PETlate and PET60 normalized to a perfusion surrogate measure derived as the average signal from 0 to 10 min PI (PET60/PETperf). FAZA: 18F-azomycin arabinoside; PET: positron emission tomography; PI: post-injection; TAC: time–activity curve.
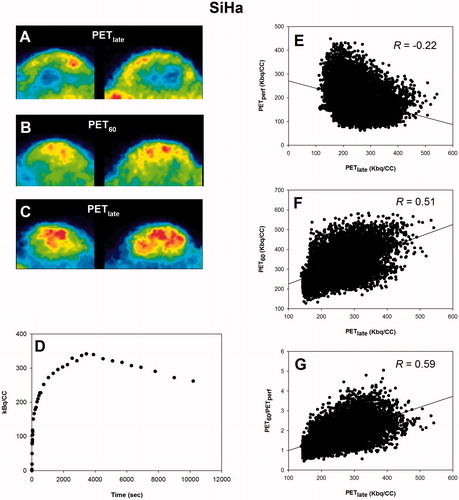
Figure 4. Scatterplot analysis for PC3. (A–C): PET images in two dimensions showing the time-dependent development of the intratumoral FAZA distribution in a PC3 back tumor. (D): whole-tumor TAC showing the distribution over time in average tumor tracer signal. (E): voxel-by-voxel correlation between late (PETlate: 160–180 min PI) and early (PETperf: 0–10 min PI) FAZA signal. (F): voxel-by-voxel correlation between PETlate and FAZA signal 60 min PI (PET60). (G): voxel-by-voxel correlation between PETlate and PET60 normalized to a perfusion surrogate measure derived as the average signal from 0 to 10 min PI (PET60/PETperf). FAZA: 18F-azomycin arabinoside; PET: positron emission tomography; PI: post-injection; TAC: time–activity curve.
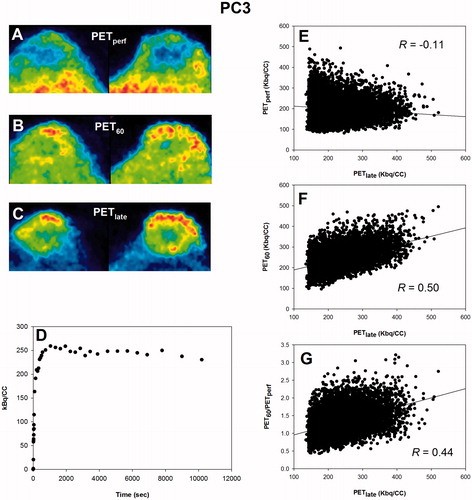
Table 1. Pearson regression coefficients (R) for different tumor models showing the voxel-by-voxel correlation between PET images derived at different imaging time points.
Discussion
Hypoxia PET may be useful for individualized treatment but static scan protocols result in low-contrast images that may be treacherous when images are converted to hypoxia maps by simple thresholding approaches. This inherent weakness may explain some of the apparent discrepancy between different hypoxia PET studies in terms of predicting the outcome following radiotherapy even in comparable patient groups [Citation9,Citation10]. Full dynamic PET scans with pharmacokinetic analysis is considered a gold standard in PET imaging, and may be particularly valuable in hypoxia imaging. Although such scans have been performed in patients, they are clinically irrelevant in routine applications. Furthermore, it remains unproven whether they actually improve the quality of the images (e.g., improves hypoxia specificity) since there is no ground truth to compare against. A small clinical study showed that kinetic analysis of dynamic FMISO PET scans improved the prognostic accuracy of hypoxia PET compared with a traditional SUV approach using late time static images [Citation6]. Whether this relates to improved determination of the extent of hypoxia is unclear, since different compartment and pharmacokinetic models have resulted in different results and may even lead to opposite physiological interpretations [Citation11]. Our results also point to a potential problem in using a universal pharmacokinetic model, since the over-all shape of TACs is largely determined by the tumor model rather than the extent of hypoxia in a given sub-volume (, Supplementary Figure S1). This corroborates with a previous study from our group [Citation8]. The true added advantage of full dynamic scans in patients is therefore not clear. Owing to the unsuitability of full dynamic scans in patients, Mönnich et al [Citation7] proposed a simplified scan protocol consisting of a short dynamic scan, a later static scan and a subsequent voxel-by-voxel perfusion correction approach which, according to model calculations, improved the correlation between voxel signal intensity and voxel median pO2. As with full dynamic scans, conclusive experimental validation that this approach is superior to conventional quantification of hypoxia PET using late time tumor-to-reference tissue ratios is not available.
Therefore, in our study we evaluated the possible added value of such an approach experimentally, taking advantage of the excellent hypoxia specificity that is obtainable in tumor-bearing rodents at late time points (). A validation of the hypoxia specificity of late time PET images by comparing the spatial distribution of FAZA with another 2-nitroimidazole-based agent (pimonidazole) may appear counterintuitive. This is not the case however, since the two assays differ fundamentally. During immunostaining, unbound pimonidazole is removed by thorough washing, thus leaving the bound (hypoxia-related) compound, whereas the autoradiograms include bound as well as unbound tracer. In addition, pimonidazole stainings have cellular resolution and may reveal small foci of hypoxic cells not visible using autoradiograms, where the real resolution (full width at half maximum, FWHM) for 18F is 100–200 microns. As a result, late time images serve as a valid control against which images (raw or perfusion normalized) obtained at earlier time points, which better resembles the clinical challenge in terms of image contrast, can be validated. We have previously shown in tumor-bearing mice that FAZA in tumor tissue is largely distributed homogenously 0.5 h PI, whereas excellent hypoxia specificity and very high tumormean-to-muscle tissue ratios are observed at 2 h PI or later [Citation12]. In the present study, we therefore reasoned that image contrast (i.e., hypoxia specificity) roughly mimics the clinical scenario somewhere between 60 and 90 min PI, with rather low intertissue and intratumoral contrast (). To broaden our analysis, we used three different PI time points (60–70, 70–80 and 80–90 min), where hypoxia specificity clearly improved between each time interval ( and ). Our analysis results were very consistent: a voxel-wise perfusion approach resulted in a worse correlation between early and late PET images than a similar analysis using uncorrected images, regardless of the actual used time frame ( and ). Considering the fast tracer kinetics in small animals, we also tested the usefulness of a shorter perfusion measurement (first 5 min). Although the weak inverse correlation between PETlate and perfusion was slightly more pronounced (), when the perfusion signal was collected over a shorter time period, subsequent normalization using this shorter period did not improve the correlation between early (60–90 min PI) and late PET images (not shown). Voxel noise may be a critical issue, especially when using very small voxel sizes, as often is the case in preclinical imaging. However, increasing the voxel volume eightfold (linear dimension twofold) and/or including a spatial smoothing step (Gaussian blurring) did not change the conclusion of our analyses.
Our results imply that even in preclinical settings with maximum experimental control, the value of a perfusion correction approach is questionable. Our study may have limitations. Fundamental differences between true patient tumors and preclinical subcutaneous rodent tumor models may exist. Of note, we typically do not observe a transient and clear perfusion peak following passage of the injected tracer bolus that has been reported in patients, and the overall shapes of TACs for various tumor subvolumes were remarkably similar for a given tumor type (), especially for SiHa and SCCVII, which may be fundamentally different in patient tumors. Nonetheless, our results agree well with the results and conclusions in a recent clinical study comparing the retention of FAZA and blood flow measurements (calculated from 15O-water PET) in patients [Citation13]. The interpretation of that study in the context of our finding is complex, however. The authors concluded that perfusion and tracer signal at late time points are not necessarily inversely correlated suggesting that hypoxia may be prevalent in well-perfused areas. Conversely, it was suggested that low tracer retention in areas with low blood flow might imply tracer delivery limitation issues, underscoring the low contrast problem in patients, which indeed would justify some model that incorporates blood flow to increase signal. Several studies have examined the usefulness of dynamic contrast-enhanced magnetic resonance imaging (DCE-MRI) as a means to predict tumor hypoxia, based on the assumption that blood flow and hypoxia correlates inversely. In accordance, a strong inverse correlation between Ktrans and hypoxia, on a global tumor basis, was demonstrated in mice bearing cervix tumor xenografts [Citation14]. However, Ktrans provides a measure of both blood flow and vessel permeability, thus complicating a direct comparison between that study and our study.
Repositioning of patients during multiple short scans to make complex PET protocols widely available and feasible in the clinic is problematic. Although an anatomic CT scan is performed before each PET session, image co-registration at an accuracy that allows meaningful/accurate voxel-by-voxel perfusion correction may be very challenging. This limitation could possibly be circumvented by combining different technologies. For example, it would be technologically feasible to perform a late time hypoxia PET scan followed by a perfusion CT scan, while the patient remains immobilized on the scanner bed, even though many CT scanners have a small field of view.
Our study showed that a clinically feasible perfusion-normalization approach were unable to improve PET hypoxia specificity. The lack of an inverse correlation between blood flow and hypoxia could compromise the usefulness of global and regional blood flow measurements (e.g., DCE-MRI, 15O-water PET) as reliable surrogate markers for tumor hypoxia. However, voxel noise issues and the fact that our study relies on a surrogate estimate of blood flow based on the initial distribution of the hypoxia tracer itself may contribute to our negative findings, and further studies are required. Particularly informative would be studies that provide a direct voxel-wise comparison of late time hypoxia PET and state-of-the art technologies for blood flow measurements in tumor-bearing mice.
Disclosure satement
No potential conflict of interest was reported by the authors.
IONC_A_1355114_Supplementary_Information.zip
Download Zip (2.7 MB)Acknowledgments
The authors thank Ms. M. Simonsen from the PET Centre (Aarhus University Hospital), Ms. I. M. Horsman, Mr. M. Johannsen, Ms. D. Grand and Ms. M. Kristiansen from the Department of Experimental and Clinical Oncology (Aarhus University Hospital) for excellent technical and practical assistance.
Additional information
Funding
Related Research Data
References
- Horsman MR, Mortensen LS, Petersen JB, et al. Imaging hypoxia to improve radiotherapy outcome. Nat Rev Clin Oncol. 2012;9:674–687.
- Wilson WR, Hay MP. Targeting hypoxia in cancer therapy. Nat Rev Cancer. 2011;11:393–410.
- Busk M, Horsman MR, Overgaard J. Resolution in PET hypoxia imaging: voxel size matters. Acta Oncol. 2008;47:1201–1210.
- Busk M, Jakobsen S, Horsman MR, et al. PET imaging of tumor hypoxia using 18F-labeled pimonidazole. Acta Oncol. 2013;52:1300–1307.
- Wack LJ, Mönnich D, van Elmpt W, et al. Comparison of [18F]-FMISO, [18F]-FAZA and [18F]-HX4 for PET imaging of hypoxia: a simulation study. Acta Oncol. 2015;54:1370–1377.
- Thorwarth D, Eschmann SM, Paulsen F, et al. A kinetic model for dynamic [18F]-Fmiso PET data to analyse tumor hypoxia. Phys Med Biol. 2005;21:2209–2224.
- Mönnich D, Troost EG, Kaanders JH, et al. Correlation between tumor oxygenation and 18F-fluoromisonidazole PET data simulated based on microvessel images. Acta Oncol. 2013;52:1308–1313.
- Busk M, Munk OL, Jakobsen S, et al. Assessing hypoxia in animal tumor models based on pharmacokinetic analysis of dynamic FAZA PET. Acta Oncol. 2010;49:922–933.
- Mortensen LS, Johansen J, Kallehauge J, et al. FAZA PET/CT hypoxia imaging in patients with squamous cell carcinoma of the head and neck treated with radiotherapy: results from the DAHANCA 24 trial. Radiother Oncol. 2012;105:14–20.
- Zips D, Zöphel K, Abolmaali N, et al. Exploratory prospective trial of hypoxia-specific PET imaging during radiochemotherapy in patients with locally advanced head-and-neck cancer. Radiother Oncol. 2012;105:21–28.
- Shi K, Souvatzoglou M, Astner ST, et al. Quantitative assessment of hypoxia kinetic models by a cross-study of dynamic 18F-FAZA and 15O-H2O in patients with head and neck tumors. J Nucl Med. 2010;51:1386–1394.
- Busk M, Horsman MR, Jakobsen S, et al. Can hypoxia-PET map hypoxic cell density heterogeneity accurately in an animal tumor model at a clinically obtainable image contrast? Radiother Oncol. 2009;92:429–436.
- Iqbal R, Kramer GM, Verwer EE, et al. Multiparametric analysis of the relationship between tumor hypoxia and perfusion with 18F-fluoroazomycin arabinoside and 15O-H2O PET. J Nucl Med. 2016;57:530–535.
- Øvrebø KM, Hompland T, Mathiesen B, et al. Assessment of hypoxia and radiation response in intramuscular experimental tumors by dynamic contrast-enhanced magnetic resonance imaging. Radiother Oncol. 2012;102:429–435.