
Abstract
Background: PET imaging may be used to personalize radiotherapy (RT) by identifying radioresistant tumor subvolumes for RT dose escalation. Using the tracers [18F]-fluorodeoxyglucose (FDG) and [18F]-fluoromisonidazole (FMISO), different aspects of tumor biology can be visualized. FDG depicts various biological aspects, e.g., proliferation, glycolysis and hypoxia, while FMISO is more hypoxia specific. In this study, we analyzed size and overlap of volumes based on the two markers for head-and-neck cancer patients (HNSCC).
Material and methods: Twenty five HNSCC patients underwent a CT scan, as well as FDG and dynamic FMISO PET/CT prior to definitive radio-chemotherapy in a prospective FMISO dose escalation study. Three PET-based subvolumes of the primary tumor (GTVprim) were segmented: a highly FDG-avid volume VFDG, a hypoxic volume on the static FMISO image acquired four hours post tracer injection (VH) and a retention/perfusion volume (VM) using pharmacokinetic modeling of dynamic FMISO data. Absolute volumes, overlaps and distances to agreement (DTA) were evaluated.
Results: Sizes of PET-based volumes and the GTVprim are significantly different (GTVprim>VFDG>VH >VM; p < .05). VH is covered by VFDG or DTAs are small (mean coverage 74.4%, mean DTA 1.4 mm). Coverage of VM is less pronounced. With respect to VFDG and VH, the mean coverage is 48.7% and 43.1% and the mean DTA is 5.3 mm and 6.3 mm, respectively. For two patients, DTAs were larger than 2 cm.
Conclusions: Hypoxic subvolumes from static PET imaging are typically covered by or in close proximity to highly FDG-avid subvolumes. Therefore, dose escalation to FDG positive subvolumes should cover the static hypoxic subvolumes in most patients, with the disadvantage of larger volumes, resulting in a higher risk of dose-limiting toxicity. Coverage of subvolumes from dynamic FMISO PET is less pronounced. Further studies are needed to explore the relevance of mismatches in functional imaging.
Introduction
Positron emission tomography (PET) imaging with the hypoxia marker [18F]-fluoromisonidazole (FMISO) is prognostic for local tumor control in advanced squamous cell carcinomas of the head and neck (HNSCC) following radio-chemotherapy (RCT) [Citation1–3]. PET imaging with [18F]-fluorodeoxyglucose (FDG) has also shown to be prognostic in HNSCC [Citation4].
As treatment outcome in HNSCC is heterogeneous, with still a large proportion of loco-regional failures [Citation5], an intensification of radiotherapy (RT) treatment by focal dose escalation to presumably radioresistant tumors or tumor subvolumes [Citation6] represents a promising approach towards personalized RT [Citation7]. It has been shown that dose escalation in tumor subvolumes is technically feasible [Citation8], though it was clinically realized in few studies only. In these studies, escalation volumes were either based on FDG PET [Citation9–12] or on FMISO PET [Citation13].
The potential advantage of using FMISO PET imaging in RT is its capability to visualize a particular radiobiologically relevant phenomenon related to radioresistance, i.e., tumor hypoxia. In contrast, FDG is a marker of various aspects of tumor biology, e.g., proliferation rate, glycolysis and possibly hypoxia, resulting generally in larger FDG-avid volumes in the tumor than FMISO [Citation14].
While FMISO PET imaging is suitable to identify high risk patients, it is challenging to segment hypoxic tumor subvolumes for dose escalation, due to the low image contrast to noise ratio. There is no consensus whether static FMISO PET images acquired several hours post tracer injection (p.i.) [Citation15] or pharmacokinetic analysis of dynamic FMISO PET data should be used to segment escalation volumes [Citation16]. Conceptually, the latter method can be used to derive a voxel-based parameter combining perfusion and tracer retention. Based on retrospective and prospective data, it has been suggested that tumors containing regions with FMISO retention in combination with low perfusion are particularly resistant to RCT [Citation13,Citation16].
High contrast FDG PET imaging might be more suitable to efficiently define RT dose escalation volumes. However, highly FDG-avid subvolumes are expected to be less specific and larger than hypoxic volumes [Citation17]. The potential escalation dose might therefore be limited by excess toxicity [Citation12]. The majority of previous studies comparing FDG and hypoxia PET volumes were performed in non-small cell lung cancer (NSCLC), using different hypoxia PET tracers [Citation18,Citation19].
Using imaging data obtained in a prospective study, we investigated the size and overlap between highly FDG-avid and hypoxic volumes in HNSCC. Overlap between FDG PET based segmentations and FMISO PET positive regions was assessed, in order to evaluate the feasibility of a hypoxia PET based stratification followed by an FDG PET guided dose escalation. Furthermore, the overlap between FMISO PET hypoxic volumes segmented from static images and from kinetic modeling parameters of dynamic FMISO PET data was assessed.
Material and methods
Patients
This study used imaging data from 25 patients with histology proven advanced HNSCC that were enrolled in a prospective phase II FMISO PET dose escalation study at our institution between 2009 and 2013 (NCT02352792). Tumors were located in the hypo- and oropharynx. All patients gave informed consent and were treated with definitive RCT (70/77 Gy in 35 fractions and concomitant 5FU/MMC or Cisplatinum). A planned interim analysis of the dose escalation study was performed for this patient cohort, reporting on toxicities and the feasibility of a 10% dose escalation in hypoxic areas [Citation13]. In the present study, four patients were excluded for reasons given in the description of the imaging procedure.
Imaging
As per study protocol, all patients underwent a computed tomography (CT) scan for RT treatment planning with immobilization using a thermoplastic mask covering head and shoulders, a neck support and a flat table top.
FDG PET/CT for staging prior to therapy was performed following injection of a mean activity of 348 MBq (319–382 MBq) in a Siemens Biograph 16 (N = 11) or a Siemens Biograph mCT (N = 10) (Siemens Healthcare, Erlangen, Germany) in diagnostic positioning without immobilization. Images were reconstructed with OSEM 3D (four iterations, eight subsets) or PSF + TOF (two iterations, 21 subsets), depending on the scanner. The primary tumor without lymph node metastases (GTVprim) was delineated in the planning CT for all patients, integrating information from the FDG PET/CT.
Dynamic and static FMISO PET/CT scans were performed in RT treatment position, identical to the planning CT, in the same scanner as FDG PET/CT. Following intravenous injection of a mean activity of 371 MBq (315–444 MBq) FMISO. The dynamic acquisition protocol consisted of a dynamic scan for 40 minutes with the following framing: 12 × 10 s, 8 × 15 s, 11 × 60 s and 5 × 300 s. Static scans were acquired two and four hours p.i. with an acquisition time of 15 minutes each. Images were reconstructed iteratively using OSEM 3D (four iterations, eight subsets), 5 mm Gaussian filtering and CT based attenuation correction. The median time between FMISO and FDG scans was seven days (1–25 days).
From the complete set of FMISO PET images, a voxel-based malignancy parameter M was derived by kinetic modeling as described previously [Citation20]. It combines information about the degrees of perfusion and hypoxia in a single parameter and has been shown to correlate with local control in advanced HNSCC following definitive RCT [Citation16]. This parameter was used in our phase II FMISO PET/CT dose escalation study to define the escalation volume as M ≥ 1.
Four patients had to be excluded for the following reasons: three patients were imaged in a PET standalone scanner and a CT image for co-registration was not available, for one patient treatment positioning with mouth open did not match the positioning during FDG PET/CT imaging and co-registration was impossible. Therefore, 21 patients were included in the analysis. For one additional patient, only FDG and static FMISO PET/CT was analyzed, because the M-parameter map was too noisy. Consequently, the full set of image volumes was available for 20 patients.
Image co-registration
FDG and FMISO PET/CT images as well as the planning CT were deformably co-registered using the open source software elastix 4.5 (http://elastix.isi.uu.nl). Registration parameters were based on a method validated for CT-MR registration in the head and neck region [Citation21]. Briefly, the mutual information similarity measure between the two CT datasets is optimized in combination with a bending energy penalty term, which favors a smooth deformation field and penalizes physiologically unrealistic deformations. First, a rigid registration was performed. The resulting transform was then used for the initialization of the deformable registration. The final CT–CT transformations were visually inspected for registration accuracy and were then applied to the PET images, the M-parameter maps and the GTVprim contours.
Image segmentation
Highly FDG-avid subvolumes (VFDG) were segmented on FDG PET images using a source-to-background method with an adaptive threshold [Citation22]. The algorithm takes into account the threshold dependence on contrast by a scanner specific phantom calibration curve.
Hypoxic subvolumes (VH) were defined using a static tumor-to-muscle (TMR) threshold of 1.4 applied to the FMISO PET acquired four hours p.i. The background was defined by the mean activity in a manually delineated ROI in the neck muscle. For the present dataset, this threshold is more than six standard deviations above the mean muscle activity of the patient cohort (c.f. Supplementary Material, Figure 1), ensuring that only severely hypoxic regions are included in VH. A similar threshold was used before in other studies [Citation15,Citation17,Citation23]. Though, as a note, TMR values are not necessarily well comparable between studies [Citation24].
According to the procedure used in our FMISO dose escalation study, a threshold of M ≥ 1 was applied to segment hypoxic volumes (VM) from the M-value parameter maps. All segmentations were restricted to the GTVprim expanded by a 5 mm margin. The margin accounts for potential inaccuracies during image registration.
Volume comparison
The segmented volumes VFDG, VH and VM were mutually compared with respect to their overlap and the distance to agreement (DTA) of non-overlapping voxels. The difference between absolute volumes was tested using a Mann–Whitney U test in R 3.2.3 (https://www.R-project.org) and p values below .05 were considered significant. The DTA analysis was performed for all voxels of the typically smaller volume with respect to the typically larger volume, i.e., typically VFDG>VH>VM (cf., section ‘Results’). Apart from the volume comparison, a voxel-based quantitative correlation analysis was performed for the three PET parameters, using Pearson’s linear correlation coefficient rp and Spearman’s rank correlation coefficient rs.
Results
The mean adaptive threshold applied to segment FDG PET images was 0.48×Amax (0.40–0.54×Amax), where Amax is the maximum activity concentration in the segmented volume.
The voxel-based correlation analysis of the three PET parameters resulted in linear correlation coefficients of 0.65 (0.38–0.87), 0.34 (–0.04 to 0.71) and 0.33 (–0.07 to 0.78) between FMISO4h and FDG, FMISO4h and M and FDG and M, respectively (Supplementary Material, Table 1).
Absolute volumes and volume overlap data are summarized in . The highly FDG-avid volume VFDG (12.8 cm3, 3.8–31.7 cm3) is generally larger than the hypoxic subvolumes VH (9.7 cm3, 0.0–43.9 cm3) and VM (1.9 cm3, 0.0–16.6 cm3). The GTV of the primary tumor delineated for treatment planning (53.0 cm3, 15.9–209.3 cm3) is on average more than four times larger than VFDG. All sets of volume are significantly different from each other (Supplementary Material, Table 2).
Table 1. Characteristics of segmented volumes.
Volumes derived from static FMISO PET VH are covered by or are located in proximity to highly FDG-avid volumes VFDG. The mean coverage is 74.4% (42.1–100%) and the mean DTA is 1.4 mm (0.0–3.1 mm). This is illustrated in . For more than 90% of the voxels considered hypoxic, the distance is smaller than 6 mm. Less than 2% of voxels are located at distances larger than 10 mm.
Figure 1. Cumulative histogram showing the distance to agreement (DTA) of voxels in VH but outside VFDG (upper curve). For voxels in VM the DTA to VFDG (middle) as well as to VH (lower) is shown.
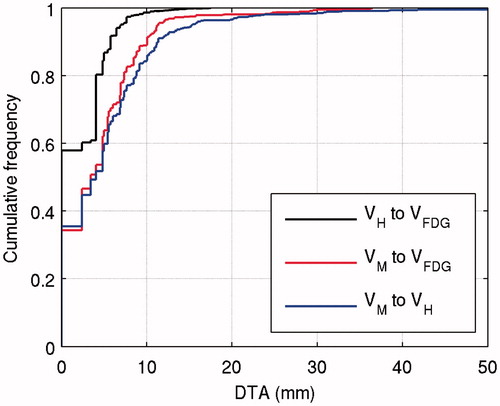
Coverage of volumes derived from dynamic FMISO PET by FDG PET volumes is less pronounced. On average, 48.7% (0.0–100%) of VM is covered by VFDG and the mean DTA is 5.3 mm (0.0–15.2 mm). The cumulative DTA histogram in shows that 90% of the voxels considered hypoxic are within 10 mm of the nearest FDG positive voxel. About 2% (15 voxels) are located at distances larger than 20 mm. Large mean DTAs were observed for patients Tue012 (11.8 mm) and Tue017 (15.2 mm), which strongly influence the overall data, because the respective volumes VM are large. If the two patients are excluded from the analysis, the maximum DTA reduces to 19 mm (cf., Supplementary Material, Figure 2). The large VM of Tue004 strongly influences the cumulative DTA curve for small DTA values.
The overlap between volumes segmented from static and dynamic FMISO PET images is patient dependent as well. On average, 43.1% (0.0–100%) of VM is covered by VH. The average DTA overall patients is 6.3 mm (0.0–26.1 mm). Again, patients Tue012 and Tue017 strongly influence the overall data, with mean DTAs of 13.7 mm and 26.1 mm. The cumulative DTA histogram in shows that for 2% of VM (15 voxels) the nearest voxel in VH is located at very large distances above 24 mm. Again, excluding patients Tue012 and Tue017 from the analysis strongly reduces the maximum DTA to 24 mm.
Discussion
In this study, tumor subvolumes segmented on FDG and FMISO PET/CT images from HNSCC patients were analyzed. The highly FDG-avid volumes were created by applying an adaptive threshold to FDG PET images, using an established quantitative method [Citation22]. For FMISO PET, two different datasets were segmented, static scans acquired four hours p.i. and parameter maps generated from pharmacokinetic modeling of dynamic PET data. Resulting absolute volumes, volume overlaps and voxel-based correlations were evaluated.
Most previous studies comparing FDG and hypoxia PET/CT were performed in NSCLC with different hypoxia tracers [Citation18,Citation19]. A direct comparison of results in HNSCC and NSCLC does not appear reasonable, because lung GTVs are typically much larger and moving during PET acquisition. For HNSCC one study assessed voxel-based correlations between FDG and FMISO PET and found a moderate, though highly significant, mean linear correlation of 0.63 with a large range among patients (0.19–0.86) [Citation14]. The reported values are well comparable to the results of the study presented here. Overlap between volumes segmented on FDG and FMISO PET images has not been reported for HNSCC yet.
In this study, it was observed that both volumes derived from FMISO PET imaging are significantly smaller than the highly FDG-avid volumes. Comparing just FDG and static FMISO PET the same result can be read from a small previous study reporting data for five HNSCC patients [Citation17]. This shows a potential advantage of the hypoxic tumor subvolumes with respect to dose escalation, as in smaller volumes higher doses may be achieved with similar toxicity. This was demonstrated in previous treatment planning studies, e.g., in HNSCC and NSCLC [Citation8,Citation23]. In addition, it was found that VFDG is significantly smaller than GTVprim, i.e., it represents a proper subvolume of the tumor.
The overlap analysis showed, that volumes derived from static FMISO PET imaging are covered by or very close to FDG positive volumes and thus would be largely included in a dose escalation in the less specific VFDG, as realized in a clinical trial [Citation9]. With respect to a hypoxia specific dose escalation, it remains unclear whether volumes from a combined retention/perfusion parameter or from FMISO retention alone are more efficient. In terms of volume, the combined parameter is superior, as it generates significantly smaller volumes, which can potentially be escalated to the highest dose of the three PET volumes. However, static images are technically easier to acquire with less burden to the patient. They are also less prone to artifacts than the M-parameter maps, for which artifacts may arise from registration of image volumes acquired at different timepoints, between which the patient left the scanner bed. Also, there is a lower limit to the size of an escalation volume that can be boosted using modern RT technology [Citation13].
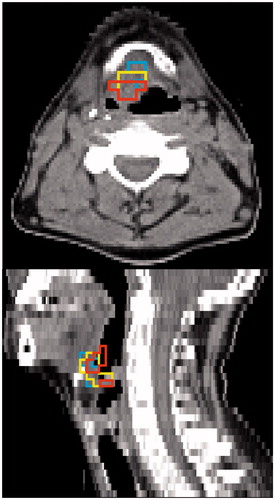
For many patients, both, hypoxic volumes from static imaging and highly FDG-avid volumes cover large parts of M-parameter volumes or distances are small. For two patients, larger discrepancies were observed. For patient Tue012, a metastatic lymph node was directly adjacent to the primary tumor and therefore included in the GTVprim. In this lymph node, an area was identified as hypoxic by the combined M-parameter, but as normoxic by the static hypoxia image as well as normally FDG-avid. For patient Tue017, again only the M-parameter was positive in an area in the soft palate on the edge of the GTV. In this region, the M-parameter is prone to artifacts due to the mobile tissue–air interface. For other patients, large overlaps between all three potential escalation volumes were observed (). An overview of all patients is given in Supplementary Material, Figures 4–24.
Figure 2. Tumor subvolumes for patient Tue013 shown on the CT of the 2 h p.i. FMISO PET/CT. High overlap with small DTAs is observed between VFDG, VH and VM (cf., ).
The limitations of the study are mainly potential misregistration, especially for the FDG PET/CT volumes, as the images were acquired without patient immobilization. This was the main reason for using a deformable registration method in this study. In addition, the median time of seven days between FMISO and FDG PET/CT acquisition may affect the results. This leads to the very important general question of the temporal stability of the PET volumes. There is evidence for FDG as well as for FMISO PET in HNSCC that, at least within a time interval of two to three days, the images are reproducible [Citation25]. The segmentation methods used and most importantly the applied thresholds have a strong influence. Established thresholds haven been used, however, these do not necessarily result in optimum RT dose escalation volumes. The chosen segmentation threshold values for hypoxic subvolumes result in on average significantly smaller volumes VM compared to VH. This can be explained by different concepts of both parameters, as the M-parameter is meant to account for low tracer retention in hypoxic tissue tending towards necrosis. Furthermore, thresholds for hypoxia PET image segmentation remain arbitrary. An alternative approach would be to adjust thresholds in order to achieve similar average volumes in the patient cohort, however, this would strongly reduce the comparability with other published results.
Conclusions
Hypoxic subvolumes derived from static PET imaging are typically covered by or in close proximity to highly FDG-avid subvolumes. Therefore, dose escalation to FDG positive tumor subvolumes should cover the static hypoxic subvolumes in most patients, with the disadvantage of larger irradiated volumes, resulting in a higher risk of dose-limiting toxicity. Coverage of subvolumes from dynamic FMISO PET is less pronounced. Further studies are needed to explore the radiobiological as well as clinical relevance of mismatches in functional imaging.
IONC_A_1363910_Suppplementary_Information.zip
Download Zip (6.8 MB)Disclosure statement
No potential conflict of interest was reported by the authors.
References
- Rajendran JG, Schwartz DL, O’Sullivan J, et al. Tumor Hypoxia Imaging with [F-18] fluoromisonidazole positron emission tomography in head and neck cancer. Clin Cancer Res. 2006;12:5435–5441.
- Dirix P, Vandecaveye V, De Keyzer F, et al. Dose painting in radiotherapy for head and neck squamous cell carcinoma: value of repeated functional imaging with (18)F-FDG PET, (18)F-fluoromisonidazole PET, diffusion-weighted MRI, and dynamic contrast-enhanced MRI. J Nucl Med. 2009;50:1020–1027.
- Zips D, Zöphel K, Abolmaali N, et al. Exploratory prospective trial of hypoxia-specific PET imaging during radiochemotherapy in patients with locally advanced head-and-neck cancer. Radiother Oncol. 2012;105:21–28.
- Chaput A, Calais J, Robin P, et al. Correlation between fluorodeoxyglucose hotspots on pretreatment positron emission tomography/CT and preferential sites of local relapse after chemoradiotherapy for head and neck squamous cell carcinoma. Head Neck. 2017;39:1155--1165.
- Linge A, Lohaus F, Löck S, et al. HPV status, cancer stem cell marker expression, hypoxia gene signatures and tumour volume identify good prognosis subgroups in patients with HNSCC after primary radiochemotherapy: a multicentre retrospective study of the German Cancer Consortium Radiation Oncology Group (DKTK-ROG). Radiother Oncol. 2016;121:364–373.
- Ling CC, Humm J, Larson S, et al. Towards multidimensional radiotherapy (MD-CRT): biological imaging and biological conformality. Int J Radiat Oncol Biol Phys. 2000;47:551–560.
- Baumann M, Krause M, Overgaard J, et al. Radiation oncology in the era of precision medicine. Nat Rev Cancer. 2016;16:234–249.
- Thorwarth D, Eschmann SM, Paulsen F, et al. Hypoxia dose painting by numbers: a planning study. Int J Radiat Oncol Biol Phys. 2007;68:291–300.
- Heukelom J, Hamming O, Bartelink H, et al. Adaptive and innovative Radiation Treatment FOR improving Cancer treatment outcomE (ARTFORCE); a randomized controlled phase II trial for individualized treatment of head and neck cancer. BMC Cancer. 2013;13:84.
- Duprez F, De Neve W, De Gersem W, et al. Adaptive dose painting by numbers for head-and-neck cancer. Int J Radiat Oncol Biol Phys. 2011;80:1045–1055.
- Madani I, Duthoy W, Derie C, et al. Positron emission tomography-guided, focal-dose escalation using intensity-modulated radiotherapy for head and neck cancer. Int J Radiat Oncol Biol Phys. 2007;68:126–135.
- Rasmussen JH, Håkansson K, Vogelius IR, et al. Phase I trial of 18F-fludeoxyglucose based radiation dose painting with concomitant cisplatin in head and neck cancer. Radiother Oncol. 2016;120:76–80.
- Welz S, Mönnich D, Pfannenberg C, et al. Prognostic value of dynamic hypoxia PET in head and neck cancer: results from a planned interim analysis of a randomized phase II hypoxia-image guided dose escalation trial. Radiother Oncol. Forthcoming. [cited 2017 Apr 20]. DOI:10.1016/j.radonc.2017.04.004
- Rajendran JG, Mankoff DA, O’Sullivan F, et al. Hypoxia and glucose metabolism in malignant tumors: evaluation by [18F]fluoromisonidazole and [18F]fluorodeoxyglucose positron emission tomography imaging. Clin Cancer Res. 2004;10:2245–2252.
- Mortensen LS, Johansen J, Kallehauge J, et al. FAZA PET/CT hypoxia imaging in patients with squamous cell carcinoma of the head and neck treated with radiotherapy: results from the DAHANCA 24 trial. Radiother Oncol. 2012;105:14–20.
- Thorwarth D, Eschmann SM, Scheiderbauer J, et al. Kinetic analysis of dynamic 18F-fluoromisonidazole PET correlates with radiation treatment outcome in head-and-neck cancer. BMC Cancer. 2005;5:152–160.
- Bittner M-I, Wiedenmann N, Bucher S, et al. Exploratory geographical analysis of hypoxic subvolumes using 18F-MISO-PET imaging in patients with head and neck cancer in the course of primary chemoradiotherapy. Radiother Oncol. 2013;108:511–516.
- Zegers CML, Elmpt WV, Reymen B, et al. In vivo quantification of hypoxic and metabolic status of NSCLC tumors using [18F]HX4 and [18F]FDG-PET/CT imaging. Clin Cancer Res. 2014;20:6389–6397.
- Bollineni VR, Kerner GSMA, Pruim J, et al. PET imaging of tumor hypoxia using 18F-fluoroazomycin arabinoside in stage III–IV non-small cell lung cancer patients. J Nucl Med. 2013;54:1175–1180.
- Thorwarth D, Eschmann S-M, Paulsen F, et al. A kinetic model for dynamic [18F]-Fmiso PET data to analyse tumour hypoxia. Phys Med Biol. 2005;50:2209–2224.
- Leibfarth S, Mönnich D, Welz S, et al. A strategy for multimodal deformable image registration to integrate PET/MR into radiotherapy treatment planning. Acta Oncol. 2013;52:1353–1359.
- Schaefer A, Kremp S, Hellwig D, et al. A contrast-oriented algorithm for FDG-PET-based delineation of tumour volumes for the radiotherapy of lung cancer: derivation from phantom measurements and validation in patient data. Eur J Nucl Med Mol Imaging. 2008;35:1989–1999.
- Even AJG, van der Stoep J, Zegers CML, et al. PET-based dose painting in non-small cell lung cancer: comparing uniform dose escalation with boosting hypoxic and metabolically active sub-volumes. Radiother Oncol. 2015;116:281–286.
- Mönnich D, Welz S, Thorwarth D, et al. Robustness of quantitative hypoxia PET image analysis for predicting local tumor control. Acta Oncol. 2015;54:1364–1369.
- Rasmussen JH, Vogelius IR, Aznar MC, et al. Spatio-temporal stability of pre-treatment 18F-fludeoxyglucose uptake in head and neck squamous cell carcinomas sufficient for dose painting. Acta Oncol. 2015;54:1416–1422.