
Abstract
Background: Gastro-intestinal (GI) toxicity after radiotherapy (RT) for prostate cancer reduces patient’s quality of life. In this study, we explored associations between spatial rectal dose/volume metrics and patient-reported GI symptoms after RT for localized prostate cancer, and compared these with those of dose–surface/volume histogram (DSH/DVH) metrics.
Material and methods: Dose distributions and six GI symptoms (defecation urgency/emptying difficulties/fecal leakage, ≥Grade 2, median follow-up: 3.6 y) were extracted for 200 patients treated with image-guided RT in 2005–2007. Three hundred and nine metrics assessed from 2D rectal dose maps or DSHs/DVHs were subject to 50-times iterated five-fold cross-validated univariate and multivariate logistic regression analysis (UVA, MVA). Performance of the most frequently selected MVA models was evaluated by the area under the receiving–operating characteristics curve (AUC).
Results: The AUC increased for dose-map compared to DSH/DVH-based models (mean SD: 0.64 ± 0.03 vs. 0.61 ± 0.01), and significant relations were found for six versus four symptoms. Defecation urgency and faecal leakage were explained by high doses at the central/upper and central areas, respectively; while emptying difficulties were explained by longitudinal extensions of intermediate doses.
Conclusions: Predictability of patient-reported GI toxicity increased using spatial metrics compared to DSH/DVH metrics. Novel associations were particularly identified for emptying difficulties using both approaches in which intermediate doses were emphasized.
Introduction
Prostate cancer is the most common cancer entity among men [Citation1]. Radiotherapy (RT) is a successful treatment modality of this disease, often used in combination with endocrine therapy [Citation2]. Radiation dose-escalation (>70 Gy) combined with state-of-the-art RT techniques has resulted in high biochemical control rates, and may further improve cancer-specific survival [Citation3–5]. However, adverse effects of the closely located gastro-intestinal (GI) tract are still being observed, and are important to monitor and prevent since their extent and severity could limit the quality of life (QoL) of patients treated for prostate cancer [Citation6–10].
Adverse effects of the GI tract following RT of prostate cancer are primarily related to the rectum irradiation, which is located in close proximity to the prostate and often receives doses up to the prescription levels [Citation11]. Rectal dose–response relationships have mainly been based on metrics sampled either from dose–surface or dose–volume histograms (DSHs, DVHs) [Citation12,Citation13] and have primarily focused on late rectal bleeding [Citation14]. More recently, attention has been brought to detailed functional effects, in particular to defecation urgency and faecal leakage [Citation15]. Such effects have in studies based on patient-reported outcomes (PROs) been associated to patients’ QoL [Citation10,Citation13,Citation16]. Different from using DVHs/DSHs, application of two-dimensional (2D) dose maps allows spatial dose information to be incorporated into response modelling of the GI tract. For instance, Buettner et al. [Citation17] previously demonstrated that the lateral extent of intermediate doses at the anal canal explained the occurrence of PROs for the loss of sphincter control. Heemsbergen et al. [Citation18] found PRO-based rectal bleeding as well as faecal incontinence to be associated with high doses at the upper and lower part of the rectum, respectively. More recently, Wortel et al. [Citation19] demonstrated that posterior-cranial regions of the rectum receiving intermediate doses (25–50 Gy) were significantly larger for patients presenting with ≥ Grade 2 acute proctitis compared to patients with Grades 0–1 proctitis. Using instead parameterized DSHs, similar associations have been observed between high doses (61–67 Gy) and late proctitis [Citation20]. However, no study has so far studied the associations between spatial dose distributions of the rectum and a whole array of PRO-based GI symptoms.
The aim of this study was therefore to explore to what extent spatial dose distributions of the rectum explain the occurrence of RT-induced PRO-based GI symptoms. For each symptom, multiple spatial dose metrics were investigated within univariate- and multivariate logistic regression analysis (UVA and MVA), and the ability of these metrics to explain the investigated symptoms was compared to that of using standard dose representations, that is, DSHs and DVHs.
Material and methods
Patient cohort and GI symptoms
This study included all 200 patients treated with three-dimensional conformal external-beam RT (3DCRT) at Aarhus University Hospital, Aarhus, Denmark in 2005–2007 (12 patients treated in the same time period with intensity-modulated RT were excluded as the GI dose–response relationships may be different [Citation21]). Further details regarding the cohort and treatment techniques can be found elsewhere [Citation10]. In brief, patients were CT scanned for planning and subsequently treated in supine position. The prescribed dose was 78 Gy in daily fractions of 2 Gy (five fractions/week), and daily orthogonal kV-based image-guidance utilizing implanted fiducial markers was applied for patient set-up. The planning target volume (PTV) was defined as the prostate and in most cases also the seminal vesicles with a margin of 7 mm in all directions, except in the cranio-caudal direction where it was 9 mm. For the majority of patients, RT was planned with 15 MV photon beam quality with a dose grid of 2 mm, and delivered in a two-phase approach including the proximal seminal vesicles to 50 Gy. For each patient, the rectum (including contents) was systematically re-defined from the slice above the anal canal to the slice below the recto-sigmoid flexure in the planning CT scan under supervision of a senior radiation oncologist. Planning objectives for the rectum (contoured from the distal end of anus to the recto-sigmoid junction) were V70Gy ≤ 20% and V74Gy ≤ 1 cm3.
Patients completed a cross-sectional questionnaire [Citation10] in 2010 at a median time-to-follow-up of 3.6 (range: 2.4–5.0) years. The questionnaire originally included 18 symptoms that to some extent directly reflected RT-induced GI injuries. In this study, we focused on the six symptoms with a prevalence ≥19% (n = 38) for a moderate symptom severity, that is, ≥answering category 2, which typically corresponded to at least a monthly occurrence, and judged clinically relevant (MH). The prevalence of the 12 excluded symptoms was ≤12%. Of the six included symptoms two were primarily related to defecation urgency, two to emptying difficulties and two to faecal leakage (soiling/flatulence; ) [Citation6,Citation10].
Table 1. The symptoms studied, and the related prevalence (N (%)) for specific symptom cut-offs.
Dose map representation
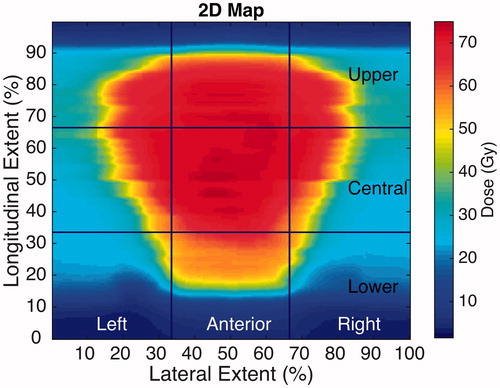
Generation of dose maps followed the approach of Tucker et al. and Buettner et al. [Citation22,Citation23]. In summary, the rectum as defined in the planning CT scan was digitally unfolded, and 2D maps of the rectal dose distribution were created for each patient. At every axial slice where the rectum was contoured, rectum was divided into eight 45°-sectors, and 25 equidistant points along the contour were defined per sector (200 points per contour). Each contour was then unwrapped at the posterior point defined by the sagittal plane containing the contour centroid. Finally, all 2D maps were normalized to a common frame of 240 × 240 pixels where the vertical central line corresponded to the most anterior part of the rectum, while the two lateral edges represented the most posterior line ().
Figure 1. An illustration of the segments division in the generated 2D maps. Left and right sectors are combined to create the different posterior sectors: posterior, posterior upper, posterior central and posterior lower. Note: lateral edges represent the posterior line of the rectum.
Statistical analysis – univariate and multivariate cross-validation
Potential predictors were derived from the 2D map of each patient by areas and extents of dose thresholds in the range 35–75 Gy (in 5 Gy steps) calculated over nine equally distributed segments, and over their lateral and longitudinal combinations: anterior and posterior (laterally); lower, central and upper (longitudinally, ). We extracted a total of 279 spatial dose metrics (126 area-based; 153 extent-based), where area- and extent-based metrics accounted for the percentage of area and extent covered by the different dose thresholds, respectively. The modelling was performed separately for the area- and extent-based metrics, but both approaches followed the same modelling procedure: UVA followed by MVA, both within logistic regression with 50-times iterated five-fold cross-validation (250 iterations in total). Potential predictors on UVA qualified to MVA if: (1) the lower limit of the 95% confidence interval of the area under the receiver-operating characteristics curve (AUC) was >0.50 (c.f. Supplementary Material A, [Citation24,Citation25]), (2) presenting at most a modest correlation (Pearson’s Correlation Coefficient <0.75) with other potential predictors with a higher mean (over the 250 iterations) AUC, (3) a chi-squared statistic (χ2) < 1 and (4) positive regression coefficients [Citation26,Citation27]. On MVA, a stepwise algorithm with a combined backward and forward optimization method that minimized the Akaike information criterion was used [Citation26,Citation27]. After these procedures, our final MVA model was identified as the most frequently selected MVA model (occurring in ≥10% of the 250 possible models). If more than one MVA model was suggested, those presenting with the highest AUC and the steepest dose–response curves, that is, the largest observed difference between the most and the least risky quartile, were judged as final models. Predictability of the final MVA model was assessed by the AUC, Spearman’s rank correlation coefficient (Rs) and associated p values, and the agreement between the observed and predicted probability was evaluated using the Hosmer–Lemeshow p value (pHL) goodness of fit test with 10 degrees of freedom [Citation26,Citation28,Citation29].
An analogous but separate procedure as outlined above was applied for the DSH-based metrics, including a total of nine potential predictors (the relative area irradiated to at least x Gy, Ax; A35–A75 in 5 Gy steps). Separately, 21 DVH-based potential predictors were evaluated and included the minimum dose to the hottest x% of the volume (Dx; D5–D60 in 5% steps, 12 metrics), as well as the relative volume receiving at least x Gy (Vx; V35–V75 in 5 Gy steps, 9 metrics), the rectal volume, its length and its cross-sectional area.
Statistical analysis – 2D map permutation test
Finally, for each symptom, an alternative population-based approach was conducted in which 2D maps were generated and compared pixel-wise between asymptomatic and symptomatic patients. The comparison was based on a permutation analysis as previously proposed by Chen et al. [Citation20], and also applied by Wortel et al. [Citation17]. Significance was denoted by an adjusted p value defined as the proportion of the higher normalized maximum in the resampled sets than the observed sample. The number of permutations was set to 1000, and significance was denoted on the two-sided 5% level.
All statistical analyses were carried out in Matlab R2015a (The MathWorks, Inc., Natick, MA, USA) using the CERR and DREES platforms [Citation30,Citation31].
Results
Area- and extent-based spatial metrics predict defecation urgency, emptying difficulties and faecal leakage
The final MVA models for defecation urgency and faecal leakage typically included one to two metrics of the high dose region (>60 Gy) at the anterior/central part of the rectum (). Final MVA models for emptying difficulties, on the other hand, included metrics addressing the longitudinal extension of intermediate to high doses (45–75 Gy, ). Defecation urgency (1) was the only investigated item for which no area-based metrics qualified for MVA. Overall, similar dose and spatial features were identified by area- and extent-based models, but the latter provided slightly higher AUC values, although not significantly so: 0.63 ± 0.02 versus 0.64 ± 0.03 (mean ± SD) for area- and extent-based models, respectively (). High dose metrics (>70 Gy) were present in the majority (8/11) of the final models.
Figure 2. (Left panel) 2D dose map for one of the patients presenting defecation urgency (2) symptoms, and the associated spatial dose metrics of the extent-based model. (Right panel) Dose–response curves for defecation urgency (2) the best area-based (red) and extent based (black) models; confidence intervals in the observed data are given by the 95% binomial confidence intervals. Note: dose–response curves for the remaining symptoms and for the DSH/DVH-based models in the Supplementary Material.
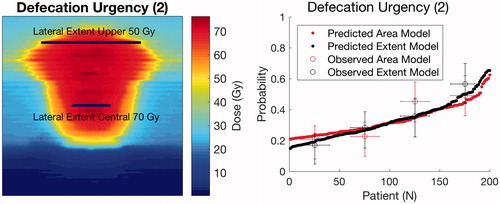
Table 2. An overview of the final spatial- and DSH/DVH-based MVA models for each studied symptom.
DSH, and DVH metrics provide overall lower discriminative ability than spatial metrics
Consistent with the spatial metrics, the final MVA models using DSH or DVH metrics typically included one metric of the high dose region (>60 Gy) for defecation urgency and faecal leakage, whereas metrics of the intermediate region (35–60 Gy) explained emptying difficulties. For defecation urgency (1) and faecal leakage (1), none of the potential DVH or DSH metrics qualified for MVA. In general, DSH metrics showed a slightly higher discriminative ability than DVH metrics (mean ± SD over all symptoms: AUC = 0.62 ± 0.01 vs. 0.60 ± 0.01; ). A lower discriminative ability was observed for DVH- and DSH-based models compared to the spatial-based models: 0.61 ± 0.01 versus 0.64 ± 0.03, respectively (). In addition, the difference between the most and the least risky quartile for the final MVA models was in the range of 13–39% for the spatial-based models, and 9–25% for the DSH/DVH-based models (Supplementary Material B and C). Consequently, this resulted in at most 30% of missing data per model (patients presenting with either 0% or 100% dose coverage for specific dose thresholds). All final models indicated high goodness-of-fit between predicted and observed risk with pHL ranging between 0.27 and 0.56.
Upper and lower regions of the population averaged 2D maps explain defecation urgency and faecal leakage
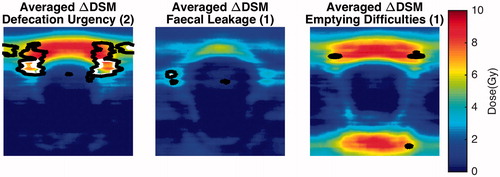
Areas of significant dose differences between population averaged 2D maps of asymptomatic and symptomatic patients were identified for defecation urgency (2), faecal leakage (1) and emptying difficulties (1). For defecation urgency (2) and faecal leakage (1), this was most pronounced for the central and upper parts, while for emptying difficulties (1) this was seen both at the upper and lower part of the 2D maps with dose differences up to 5.2–8.7 Gy (). A similar agreement was observed for the final spatial-based MVA models (cf. previous section) where metrics pointed towards the lateral extent in the upper and central part for defecation urgency (2) and faecal leakage (1), and longitudinal extents for emptying difficulties ((1); ). For the remaining symptoms, no significant (adjusted p value ≤.10) dose differences were observed in the population averaged 2D maps stratified by symptomatic and asymptomatic patients (Supplementary Material D).
Figure 3. Average difference 2D maps for the three symptoms where areas of significant dose difference were found based on the permutation analysis. Note: areas enclosed by the white contours refer to significance on the 5% level, whereas black contours to the 10% significance level.
Discussion
In the present work, we have investigated to what extent 2D dose map-based metrics of the rectum describe the occurrence of six patient-reported GI symptoms [Citation10] related to defecation urgency, emptying difficulties or faecal leakage following RT for localized prostate cancer. Furthermore, the analysis was based on a thorough internal generalizability approach (including both UVA and MVA with 50 times iterated five-fold cross-validation [Citation26,Citation27]). Spatial dose metrics were presented with the overall highest discriminative ability and using this dose representation we established significant relationships for all six symptoms compared to four symptoms using DSHs/DVHs.
Dose reduction methods such as DVHs and DSHs have been extensively used to associate dose with GI toxicity [Citation32–34]. While a consistent range of the rectal DVH has been shown to explain rectal bleeding across studies [Citation12–14], a considerably wider range of the rectal DVH has been associated with defecation urgency and faecal leakage. Fiorino et al. [Citation34] found that DVHs reflecting intermediate rectal doses (V40Gy) best explained defecation urgency, while for a similar symptom and dose representation Stenmark et al. [Citation35] found associations with low to high doses (V25Gy–V75Gy) but at the inferior part of the rectum. Faecal incontinence/leakage, on the other hand, has previously been explained by DVHs of the intermediate to high dose range (V50Gy–V70Gy) of the inferior part of the rectum [Citation27], and by low to intermediate anal sphincter doses (V30Gy, mean dose) [Citation6]. Using the DSH/DVH approach, our findings indicated that metrics of the high-dose rectal region provided the best discriminative ability (amongst DSH/DVH models) for defecation urgency and faecal leakage. Emptying difficulties have been less studied and were here found to be associated with intermediate rectal doses.
Buettner et al. [Citation23] identified dose–response relationships for rectal bleeding, loose stools and overall GI toxicity using either DSHs, DVHs or spatial wall metrics of the anal sphincter and the rectum (AUC: 0.63–0.67). In our data, the prevalence of the corresponding bleeding and loose stools symptoms for a moderate severity was below that of our specified inclusion rate (12% and 7%). For our considerably wider range of studied PRO-assessed GI symptoms, defecation urgency, emptying difficulties and faecal incontinence [Citation10], we identified discriminative abilities of the same range as by Buettner et al. [Citation23] using 2D map-based metrics (AUC range: 0.65–0.68). We found dose–response relationships to be symptom-specific, but for each symptom there was good agreement in the identified dose levels using either of the three dose representations, that is, spatial-based, DSHs and DVHs. In general, spatial-based models resulted in models with the overall highest discriminative ability, and in particular for defecation urgency (2). Our spatial-based models for faecal leakage agreed with the results from Heemsbergen et al. [Citation18] where associations were observed between high doses (≥60 Gy) at the 40–50% (central-lower part of the anorectal wall) and soiling and faecal leakage. Finally, for emptying difficulties, a dose–response relationship has previously not been identified, but our results for this symptom indicate an association with the longitudinal extent of intermediate/high doses. The mechanisms behind the occurrence of GI toxicity are still poorly understood, in particular those regarding faecal leakage [Citation15]. Even though the knowledge of how and to what extent RT impairs the rectal/ano-rectal structure is incomplete, our findings suggest clear differences in the addressed doses and areas across the investigated symptoms, and in particular between either defecation urgency or faecal leakage with emptying difficulties.
The implementation of our 2D dose map-based method is straightforward, and opens up for investigating generalizability of our results to other RT delivery techniques beyond 3DCRT with daily image-guidance, or where GI toxicity has been defined differently. A potential limitation of this study could be that the 3D dose distribution of the rectum surface was parameterized into a normalized 2D map. In the present study, a slice-wise method has been selected, and has previously been applied in other related studies [Citation22,Citation23]. On the other hand, we extracted spatial-based metrics using the relative extension (longitudinal and lateral) of dose thresholds, which are less prone to distortions compared to physical distances or areas. The cross-validation approach allowed us to explore internal generalizability of our findings [Citation36,Citation37]; its usefulness for dose–response purposes has been supported by several theoretical studies [Citation26,Citation27].
The overall scope of this work has primarily been to investigate various approaches to parameterize rectal dose distributions in a population-based setting. Nonetheless, the co-existence of various patient- and treatment-related characteristics such as, for example, smoking, surgery, use of antihypertensive and/or anticoagulants could be useful for the purpose of tailoring the predictions on a patient-specific level [Citation36–38]. Even though all included patients were treated with image-guidance, we cannot entirely exclude the residual contribution from intra- and inter-fractional organ motion as presented by the bladder, prostate and the rectum, possibly resulting in somewhat different patterns of association using delivered as opposed to planned doses [Citation39]. Another aspect that has been disregarded in this study is detailed information on ano-rectal physiology/biomechanical properties, and how these relate to rectal dose and GI morbidity. For instance, patients experiencing defecation urgency and faecal leakage have been shown to tolerate a lower rectal pressure compared to asymptomatic patients [Citation40,Citation41], and for defecation urgency this finding was successfully anchored to the rectal dose [Citation42].
In conclusion, in the present study, we reported associations between intermediate to high rectal doses in central/upper region and both defecation urgency, and faecal leakage by using parameterized spatial metrics derived from 2D maps and patient-reported outcomes. Additionally, a novel dose–response relationship was identified between emptying difficulties and intermediate rectal doses. Future efforts could further exploit our path of analysis for patient-specific risk estimation, for example, in the presence of other potentially predisposing characteristics, and for generalizability testing, for example, in cohorts including patients treated with other RT techniques.
IONC_A_1370130_Supplementary_Information.zip
Download Zip (705.6 KB)Disclosure statement
The authors report no conflicts of interest.
Additional information
Funding
Related Research Data
References
- Ferlay J, Steliarova-Foucher E, Lortet-Tieulent J, et al. Cancer incidence and mortality patterns in Europe: estimates for 40 countries in 2012. Eur J Cancer. 2013;49:1374–1403.
- Fosså SD, Wiklund F, Klepp O, et al. Ten- and 15-yr prostate cancer-specific mortality in patients with nonmetastatic locally advanced or aggressive intermediate prostate cancer, randomized to lifelong endocrine treatment alone or combined with radiotherapy: final results of the Scandinavian Prostate Cancer Group-7. Eur Urol. 2016;70:684–691.
- Peeters STH, Heemsbergen WD, Koper PCM, et al. Dose–response in radiotherapy for localized prostate cancer: results of the Dutch multicenter randomized phase III trial comparing 68 Gy of radiotherapy with 78 Gy. J Clin Oncol. 2006;24:1990–1996.
- Nguyen Q-N, Levy LB, Lee AK, et al. Long-term outcomes for men with high-risk prostate cancer treated definitively with external beam radiotherapy with or without androgen deprivation. Cancer. 2013;119:3265–3271.
- Heemsbergen WD, Al-Mamgani A, Slot A, et al. Long-term results of the Dutch randomized prostate cancer trial: impact of dose-escalation on local, biochemical, clinical failure, and survival. Radiother Oncol. 2014;110:104–109.
- Thor M, Olsson CE, Oh JH, et al. Relationships between dose to the gastro-intestinal tract and patient-reported symptom domains after radiotherapy for localized prostate cancer. Acta Oncol. 2015;54:1326–1334.
- Budäus L, Bolla M, Bossi A, et al. Functional outcomes and complications following radiation therapy for prostate cancer: a critical analysis of the literature. Eur Urol. 2012;61:112–127.
- Schaake W, Wiegman EM, de Groot M, et al. The impact of gastrointestinal and genitourinary toxicity on health related quality of life among irradiated prostate cancer patients. Radiother Oncol. 2014;110:284–290.
- Zelefsky MJ, Poon BY, Eastham J, et al. Longitudinal assessment of quality of life after surgery, conformal brachytherapy, and intensity-modulated radiation therapy for prostate cancer. Radiother Oncol. 2016;118:85–91.
- Petersen SE, Bentzen L, Emmertsen KJ, et al. Development and validation of a scoring system for late anorectal side-effects in patients treated with radiotherapy for prostate cancer. Radiother Oncol. 2014;111:94–99.
- Michalski JM, Yan Y, Watkins-Bruner D, et al. Preliminary toxicity analysis of 3-dimensional conformal radiation therapy versus intensity modulated radiation therapy on the high-dose arm of the Radiation Therapy Oncology Group 0126 prostate cancer trial. Int J Radiat Oncol Biol Phys. 2013;87:932–938.
- Jackson A, Marks LB, Bentzen SM, et al. The lessons of QUANTEC: recommendations for reporting and gathering data on dose–volume dependencies of treatment outcome. Int J Radiat Oncol Biol Phys. 2010;76:S155–S160.
- Michalski JM, Gay H, Jackson A, et al. Radiation dose–volume effects in radiation-induced rectal injury. Int J Radiat Oncol Biol Phys. 2010;76:S123–S129.
- Liu M, Moiseenko V, Agranovich A, et al. Normal Tissue Complication Probability (NTCP) modeling of late rectal bleeding following external beam radiotherapy for prostate cancer: a test of the QUANTEC-recommended NTCP model. Acta Oncol. 2010;49:1040–1044.
- Maeda Y, Høyer M, Lundby L, et al. Faecal incontinence following radiotherapy for prostate cancer: a systematic review. Radiother Oncol. 2011;98:145–153.
- Lund J-Å, Kaasa S, Wibe A, et al. Late radiation effects to the rectum and anus after treatment for prostate cancer; validity of the LENT/SOMA score. Acta Oncol. 2013;52:727–735.
- Buettner F, Gulliford SL, Webb S, et al. The dose–response of the anal sphincter region – an analysis of data from the MRC RT01 trial. Radiother Oncol. 2012;103:347–352.
- Heemsbergen WD, Hoogeman MS, Hart GAM, et al. Gastrointestinal toxicity and its relation to dose distributions in the anorectal region of prostate cancer patients treated with radiotherapy. Int J Radiat Oncol Biol Phys. 2005;61:1011–1018.
- Wortel RC, Witte MG, van der Heide UA, et al. Dose–surface maps identifying local dose-effects for acute gastrointestinal toxicity after radiotherapy for prostate cancer. Radiother Oncol. 2015;117:515–520.
- Hamlett LJ, McPartlin AJ, Maile EJ, et al. Parametrized rectal dose and associations with late toxicity in prostate cancer radiotherapy. Br J Radiol. 2015;88:20150110.
- Troeller A, Yan D, Marina O, et al. Comparison and Limitations of DVH-Based NTCP models derived from 3D-CRT and IMRT data for prediction of gastrointestinal toxicities in prostate cancer patients by using propensity score matched pair analysis. Int J Radiat Oncol Biol Phys. 2015;91:435–443.
- Tucker SL, Zhang M, Dong L, et al. Cluster model analysis of late rectal bleeding after IMRT of prostate cancer: a case-control study. Int J Radiat Oncol Biol Phys. 2006;64:1255–1264.
- Buettner F, Gulliford SL, Webb S, et al. Modeling late rectal toxicities based on a parameterized representation of the 3D dose distribution. Phys Med Biol. 2011;56:2103–2118.
- Wald A, Wolfowitz J. Confidence limits for continuous distribution functions. Ann Math Stat. 1939;10:105–118.
- Agresti A, Coull BA. Approximate is better than “exact” for interval estimation of binomial proportions. Am Stat. 1998;52:119–126.
- Snee RD. Validation of regression models: methods and examples on JSTOR. Technometrics. 1977;19:415–428.
- Xu C-J, van der Schaaf A, Schilstra C, et al. Impact of statistical learning methods on the predictive power of multivariate normal tissue complication probability models. Int J Radiat Oncol Biol Phys. 2012;82:e677–e684.
- Hanley JA, McNeil BJ. The meaning and use of the area under a receiver operating characteristic (ROC) curve. Radiology. 1982;143:29–36.
- Hosmer DW, Lemesbow S. Goodness of fit tests for the multiple logistic regression model. Commun Stat – Theory Methods. 1980;9:1043–1069.
- Deasy JO, Blanco AI, Clark VH. CERR: a computational environment for radiotherapy research. Med Phys. 2003;30:979–985.
- Naqa I El, Suneja G, Lindsay PE, et al. Dose response explorer: an integrated open-source tool for exploring and modelling radiotherapy dose–volume outcome relationships. Phys Med Biol. 2006;51:5719–5735.
- Nguyen PL, Chen RC, Hoffman KE, et al. Rectal dose–volume histogram parameters are associated with long-term patient-reported gastrointestinal quality of life after conventional and high-dose radiation for prostate cancer: a subgroup analysis of a randomized trial. Int J Radiat Oncol Biol Phys. 2010;78:1081–1085.
- Gulliford SL, Foo K, Morgan RC, et al. Dose–volume constraints to reduce rectal side effects from prostate radiotherapy: evidence from MRC RT01 Trial ISRCTN 47772397. Int J Radiat Oncol Biol Phys. 2010;76:747–754.
- Fiorino C, Fellin G, Rancati T, et al. Clinical and dosimetric predictors of late rectal syndrome after 3D-CRT for localized prostate cancer: preliminary results of a multicenter prospective study. Int J Radiat Oncol Biol Phys. 2008;70:1130–1137.
- Stenmark MH, Conlon ASC, Johnson S, et al. Dose to the inferior rectum is strongly associated with patient reported bowel quality of life after radiation therapy for prostate cancer. Radiother Oncol. 2014;110:291–297.
- Cella L, D’Avino V, Liuzzi R, et al. Multivariate normal tissue complication probability modeling of gastrointestinal toxicity after external beam radiotherapy for localized prostate cancer. Radiat Oncol. 2013;8:221.
- Vanasek J, Odrazka K, Dolezel M, et al. Statistical analysis of dose–volume profiles and its implication for radiation therapy planning in prostate carcinoma. Int J Radiat Oncol Biol Phys. 2013;86:769–776.
- Ospina JD, Zhu J, Chira C, et al. Random forests to predict rectal toxicity following prostate cancer radiation therapy. Int J Radiat Oncol Biol Phys. 2014;89:1024–1031.
- Thor M, Apte A, Deasy JO, et al. Dose/volume-response relations for rectal morbidity using planned and simulated motion-inclusive dose distributions. Radiother Oncol. 2013;109:388–393.
- Petersen SE, Bregendahl S, Langschwager M, et al. Pathophysiology of late anorectal dysfunction following external beam radiotherapy for prostate cancer. Acta Oncol. 2014;53:1398–1404.
- Casares-Magaz O, Thor M, Liao D, et al. An image-based method to quantify biomechanical properties of the rectum in radiotherapy of prostate cancer. Acta Oncol. 2015;54:1335–1342.
- Smeenk RJ, Hopman WPM, Hoffmann AL, et al. Differences in radiation dosimetry and anorectal function testing imply that anorectal symptoms may arise from different anatomic substrates. Int J Radiat Oncol Biol Phys. 2012;82:145–152.