
Abstract
Introduction: A previous pattern-of-failure study has suggested that up to 50% of the loco-regional failures (LRF) in head and neck squamous cell carcinoma (HNSCC) occur outside the initial hypoxic volume determined by [18F]-fluoromisonidazole-PET ([18F]-FMISO-PET). The aim of the present analysis was to correlate spatial patterns of failure with respect to the pretherapeutic dynamic [18F]-FMISO-PET/CT in HNSCC after radiochemotherapy (RCT).
Material and methods: Within a running phase 2 trial using [18F]-FMISO-PET imaging prior to RCT in HNSCC patients (n = 54), we have observed so far 11 LRF with a minimum follow-up of 12 months. For nine patients, LRF imaging (CT or [18F]-FDG-PET/CT) for pattern-of-failure analysis was available. Analysis included the static 4-h hypoxic subvolume (VH) as well as a M-parameter volume (VM), which is derived from modeling of dynamic PET. Deformable image registration of the CT scan with the recurrent tumor to the pre-treatment [18F]-FMISO-PET/CT and the planning CT was done to quantify the hypoxic subvolumes compared to the recurrent tumor volume. Moreover, a point-of-origin analysis was performed.
Results: A total of five local, two regional and two loco-regional recurrences were detected. After deformable image registration of the CT scan with the recurrent tumor to the pre-treatment [18F]-FMISO-PET/CT and the planning CT, a significant overlap of the recurrence volume with [18F]-FMISO-positive subvolumes in the initial gross tumor volume (GTV) was observed. Median overlap of 40.2%, range 9.4–100.0%, for VH and 49.0%, range 4.4–96.4%, for VM was calculated. The point-of-origin analysis showed median distances of 0.0 mm, range 0.0–11.3 mm to VH and 8.6 mm, range 0.0–15.5 mm to VM, respectively.
Conclusions: Our data suggest that loco-regional recurrences after RCT originate from the initial GTV (primary tumor and/or lymph node metastases) containing hypoxic subvolumes, which supports the concept of hypoxia imaging-based dose escalation.
Introduction
Hypoxia is one of the major causes of therapy resistance in head and neck squamous cell carcinoma (HNSCC), especially for patients treated with radio- or radiochemotherapy (RCT) [Citation1–6]. Despite advances in the treatment outcome after RCT loco-regional failure remains a major problem [Citation7,Citation8]. Non-invasive imaging acquired with hypoxia-specific PET tracers such as [18F]-fluoromisonidazole ([18F]-FMISO), [18F]-fluoroazomycin arabinoside ([18F]-FAZA) and [18F]-HX4 was shown to be correlated with local control after RCT [Citation5,Citation9–11]. First clinical trials are currently on their way to individualize treatment based on hypoxia PET imaging [Citation12,Citation13]. Dose painting by numbers is an elegant way to individualize radiotherapy by functional imaging such as PET, which could overcome the resistance of hypoxic HNSCC [Citation12,Citation14,Citation15], but there are controversial findings about the spatial stability, especially over the time course of treatment for the detected hypoxic subvolumes [Citation16–18]. An important rationale for dose escalation to the macroscopic tumor or a subvolume of it comes from the distribution of recurrences as this intervention is based on the assumption that recurrences are formed by the most resistant and therefore surviving tumor cells. Zschaeck et al. [Citation16] showed for 12 patients in a post hoc analysis of a prospective phase 2 trial, that the consensual hypoxic subvolume is only moderately stable during treatment and that local relapse occurs only for some patients in this consensual hypoxic subvolume, in a substantial proportion of patients even outside the initial [18F]-fluorodeoxyglucose PET ([18F]-FDG-PET)-positive volume [Citation16]. As discussed by the authors, this observation puts a concerning caveat to selective dose escalation to hypoxic subvolumes and maybe an argument in favor of dose escalation to the entire tumor assuming a general more malignant phenotype of hypoxic tumors [Citation19]. The aim of the present analysis using data from a prospective clinical trial was to correlate patterns of loco-regional failure related to the pretherapeutic hypoxic subvolumes in HNSCC.
Material and methods
Patients
This study used datasets from 54 patients, which were treated in a running phase 2 hypoxia dose escalation trial (NCT 02352792). So far 11 loco-regional failures have been detected. For nine of these relapses, imaging (CT or [18F]-FDG-PET/CT) was available. Patient characteristics are summarized in . Minimum follow-up was 12 months. All patients gave informed consent and were treated with definitive RCT. Details on the protocol and therapy are described in Welz et al. [Citation12]. Briefly, IMRT with prescribed doses of 54 and 60 Gy were delivered in 30 fractions to elective clinical target volume (CTV) and high-risk CTV including macroscopic disease. A sequential boost of 10 Gy was delivered to the gross tumor volume (GTV). In the dose escalation arm, a 10% dose escalation to the initial hypoxic subvolume was applied in 35 fractions (2.2 Gy/fraction). No additional margin was added to the initial hypoxic subvolume. Concomitant 5FU/MMC or Cisplatinum was administered. All patients were p16 negative. A planned interim analysis of the dose escalation study was performed after 25 patients, including treatment toxicities and the feasibility of a 10% dose escalation in hypoxic areas [Citation12].
Table 1. Patient characteristics.
Imaging
A non-contrast treatment planning CT with immobilization using a thermoplastic mask covering head and shoulders with a neck support and a flat table top was performed for all patients. [18F]-FDG-PET/CT was performed routinely before treatment planning in normal diagnostic setup. In addition, dynamic and static [18F]-FMISO-PET/CT scans were performed in radiotherapy (RT) treatment position. [18F]-FMISO-PET/CT images were acquired in a Siemens Biograph 16 (N = 2) or a Siemens Biograph mCT (N = 7) (Siemens Healthcare GmbH, Erlangen, Germany). Forty minutes dynamic PET acquisition was followed by a static 2 and 4-h post-injection (p.i.) scan. Reconstruction was done iteratively using ordered subset expectation maximization (OSEM 3D, four iterations, eight subsets), 5 mm Gaussian filtering and CT-based attenuation correction. As described previously, a voxel-based malignancy map was calculated based on the dynamic [18F]-FMISO-PET images using kinetic modeling [Citation5]. Briefly, the model combines information about perfusion and hypoxia on a voxel basis in a single parameter M, which was shown to be correlated with local control in advanced HNSCC after RCT [Citation5]. Recently, the prognostic value was demonstrated in a prospective cohort [Citation12]. Follow-up imaging was performed in usual diagnostic CT-positioning.
Image co-registration
[18F]-FMISO-PET/CT images acquired 4-h p.i. and the M-parameter map as well as the CT of the recurrence were rigid and deformable co-registered to the planning CT using a research version of syngo.via RT Image suite (Siemens Healthcare GmbH). First, a rigid registration was performed for the [18F]-FMISO-PET and the M-parameter maps and for the CT of the recurrence. The resulting transform was then used to initialize the deformable registration of the recurrence CT to the planning CT using a deformation approach restricted to a volume of interest (VOI) containing the region of the initial/recurrent disease. The registration result was visually checked for physically unrealistic deformation especially in the region of the recurrent disease.
ROI delineation and calculation of volume overlap
All delineations where done on the initial planning CT with the co-registered PET or CT overlaid. First, a muscle ROI in the deep muscles of the neck was delineated and the mean uptake was calculated. To delineate the hypoxic subvolume inside the initial GTV, a threshold of 1.4 with regard to the mean uptake in the muscle was used, which proved to be reliable in a previous analysis [Citation20]. The malignancy volume (VM) based on the M-parameter map from kinetic analysis of dynamic [18F]-FMISO data was manually delineated inside the initial GTV for the area of relapse. The recurrent disease was delineated on the deformed CT or [18F]-FDG-PET/CT by experienced physicians blinded with regards to initial GTV and hypoxic subvolumes. Overlapping intersections of the initial hypoxic subvolume (VH) and the recurrent GTV (GTVRec) was calculated (VH/Rec). The same was done for the initial M-parameter volume (VM) and resulted in the M-volume in the GTVRec (VM/Rec). To determine the relative overlap of volumes, the ratio of VH/Rec and VH, respectively VM/Rec and VM as well as the proportion of VH/Rec and VM/Rec with respect to GTVRec was calculated.
Point-of-origin analysis
A numerical point-of-origin analysis was performed as established by others [Citation21]. The point within the recurrence (GTVRec) with the minimal maximum distance to its surface was assumed to be the geometric point of origin of the recurrence (PO-R) using MATLAB R2009b (The MathWorks Inc., Natick, MA, USA). Distance of PO-R to the surface of VH and VM was calculated as the minimum distance to the surface of the respective volumes.
Results
Five local (T-site), two loco-regional (T- and N-side) and two regional (N-site) failures were detected. All recurrences occurred in patients with initial tumor and/or lymph node hypoxia as defined by the M-parameter. Overall, the deformable image registration was adequate for delineation and image analysis. Volumes of recurrent GTVs showed large inter-patient variations. Median GTVRec volume was determined to be 19.1 (range: 5.1–122.4) cm³. Median pretherapeutic hypoxic (VH) and M-parameter volumes (VM) were 17.5 (0.3–50.6) cm³ and 2.2 (1.2–11.5) cm³. shows exemplarily for one patient (#3) the recurrence volume GTVRec as well as the hypoxic (VH) and the M-parameter volumes (VM) as well as their geographical overlap. The median overlapping subvolumes with respect to the GTVRec were 4.5 (0.3–27.0) cm³ and 1.3 (0.1–5.6) cm³, for VH/Rec and VM/Rec, respectively. Median overlap of VH with respect to VM were 1.3 (0.1–5.9) cm³. The relative M-parameter volume covered by the VH was 62.9 (4.4–97.5) %. The median relative overlap of the pretherapeutic hypoxic and M-parameter subvolumes with respect to the GTVRec were determined as 40.2 (9.4–100.00) % and 49.0 (4.4–96.4) % for VH/Rec/VH and VM/Rec/VM, respectively. Point-of-origin analysis revealed a median distance to the surface of 0.0 (0.0–11.3) mm and 8.6 (0.0–15.5) mm for VH and VM, respectively. Axial slides of the volumes containing the PO-R are shown in . An overview summarizing all data is shown in . depicts the Venn–Euler diagrams of all nine patients for illustration of the overlaps between the different volumes as well as inter-patient variation.
Figure 1. Example images of patient #3. Planning CT (A and C) and deformed CT of the recurrence (B and D) with the VOI in green VH, in yellow VM and in red the GTVRec.
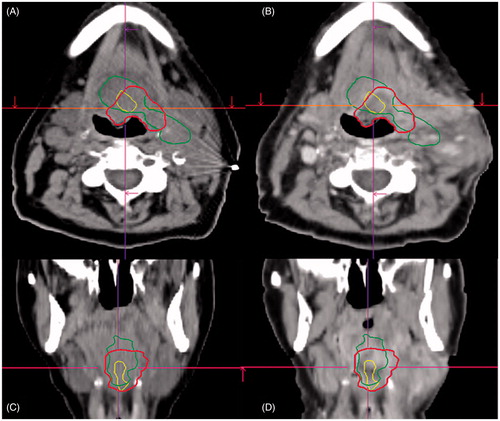
Figure 2. Axial slides of GTVRec (white); VH (dark grey) and VM (red) and the PO-R (yellow) for each analyzed patient. In images with more than one PO-R all shown points have the same distance to the surface of GTVRec. Due to the localization of the PO-R, not all subvolumes are visible in each image.
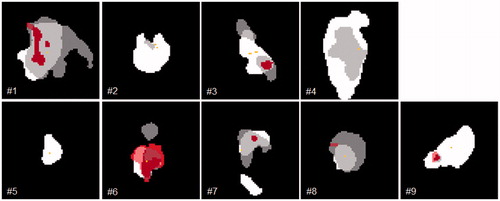
Figure 3. Venn diagram for the proportional overlap between GTVRec (white); VH (dark grey) and VM (red) for each analyzed patient and the mean for all patients.
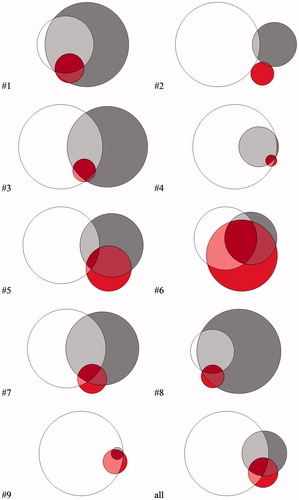
Table 2. Overview of the different VOIs and the minimum distance of the PO-R analysis for each patient.
Discussion
In this prospective study, we analyzed the spatial location of failures with respect to pretherapeutic hypoxic subvolumes in a cohort of patients with locally advanced HNSCC treated in a randomized controlled phase 2 study. Recurrent GTV was manually delineated on a deformed CT and the volumes were compared regarding relative volume overlap. A point-of-origin analysis was performed for the recurrences and distances to the surface of the pretherapeutic subvolumes were calculated. So far, no clear evidence exists about the stability of hypoxic subregions or the relation of the geometric position of the hypoxic subregions to the site of local failure for HNSCC. A previous study by Zschaeck et al. (2015) showed in a small group of patients that in half of the patients recurrent GTV had no overlap with the consensual hypoxic subvolumes, neither with the pretherapeutic [18F]-FMISO-PET nor with the subsequent [18F]-FMISO-PET in Week 2 of the treatment [Citation16]. Dirix et al. [Citation10] showed, that three out of nine recurrences developed outside the initial hypoxic subvolume, but all in the high dose area [Citation10]. Our study shows different results. Although the recurrent GTV is much larger than the initial hypoxic subvolume, we see a significant fraction of the pretherapeutic hypoxic and malignant subvolumes contained in the GTVRec with a median of 40.2% for the VH and 49.0% for the VM, which suggest a decent conformity of the hypoxic subvolumes remaining in the recurrent GTV. The moderate overlap of VH and VM is consistent with an analysis of 25 patients in the interim report (Mönnich et al., submitted to Acta Oncologica).
One obvious outlier was patient #2, where the recurrent disease already outgrew the initial GTV. Between the time of initial therapy and the detected recurrence, the patient had already developed a second cancer in the base of the tongue, outside the initially treated volume 25 months after initial RCT, which was resected. This patient had also a therapy induced kyphosis which made a deformable image registration borderline possible. The other patient with only a small overlap of only 19.9% between hypoxic volume and GTVRec was patient #5, who had recurrent disease in the hypopharynx, which progressed after initial regression and was subsequently resected.
There are a number of limitations in this study. The change in anatomy of the individual patients after RCT and the sometimes very advanced recurrent disease makes an analysis like the present difficult. Due to the fact, that the CT scans of the recurrent disease were acquired in routine diagnostic positioning and the altered anatomy after therapy, a deformable image registration was needed to merge this data on the initial planning CT and planning PET/CTs. Because of the often large recurrent GTV the ratio of the overlap of the initially small VH and VM with the recurrent GTV was rather low. Thus, we focused on ratio of the initial hypoxic and malignant subvolumes contained in the recurrent GTV compared to the entire pretherapeutic hypoxic and malignant subvolumes. The point-of-origin analysis revealed median distances to the pre-therapeutic subvolumes with 0.0 mm to the VH and 8.6 mm to VM. Of note, the VH is larger than VM in the majority of patients. Although it appears that the small distances would not exclude the possibility that the recurrences originated from the initial hypoxic subvolumes, the concept of geometric PO-R has limitations. In particular, the geometric PO-R concept assumes an equal growth of the recurrence in all directions. This might not be necessarily the case as the growth might be affected by anatomical location and borders, shrinkage of fibrotic surrounding tissues and necrotic cell loss at the mucosal surface. The question whether the recurrent disease originates from initially hypoxic cells remains therefore open. However, even when accounting for all limitations including the small number of patients, our data appear to be consistent that the majority of recurrences originate from the hypoxic tumor. Thus, our data would be in support of dose escalation to hypoxic tumors. Whether the entire tumor or only hypoxic subvolumes should be escalated remains to be tested in clinical trials. We did not compare the recurrent disease with the whole initial hypoxic subvolume, as we wanted to focus only on the recurrent and thus likely resistant part of the tumor. In one patient (#6), a salvage lymph node dissection of the former hypoxic lymph nodes was performed, before he showed the recurrent primary tumor, and in one patient, we only assessed the hypoxic subvolume in the progressive lymph node, because the primary tumor was controlled after RCT (patient #8). Another patient presented with an isolated regional failure where we did not assess the initially hypoxic primary tumor (patient #9). Only for one patient we had a [18F]-FDG-PET/CT of the recurrence, so we did not include [18F]-FDG-based subvolumes in this analysis. As pattern-of-recurrence studies are essential to challenge novel therapeutic approaches systematic follow-up including [18F]-FDG-PET imaging are indispensable to detect already small outgrowing recurrences.
Conclusions
Our data suggest that loco-regional recurrences after RCT originate from the initial GTV (primary tumor and/or lymph node metastases) containing hypoxic subvolumes, which supports the concept of hypoxia imaging-based dose escalation. The limitations of our study emphasize the importance of repeated imaging in follow-up for detailed high-resolution pattern-of-recurrence analysis in interventional RCT trials.
Acknowledgments
The authors thank Siemens Healthcare GmbH for providing research version of syngo.via RT image Suite (VB 20).
Disclosure statement
No potential conflict of interest was reported by the authors.
Related Research Data
References
- Nordsmark M, Bentzen SM, Rudat V, et al. Prognostic value of tumor oxygenation in 397 head and neck tumors after primary radiation therapy. An international multi-center study. Radiother Oncol. 2005;77:18–24.
- Zips D, Zophel K, Abolmaali N, et al. Exploratory prospective trial of hypoxia-specific PET imaging during radiochemotherapy in patients with locally advanced head-and-neck cancer. Radiother Oncol. 2012;105:21–28.
- Linge A, Löck S, Krenn C, et al. Independent validation of the prognostic value of cancer stem cell marker expression and hypoxia-induced gene expression for patients with locally advanced HNSCC after postoperative radiotherapy. Clin Transl Radiat Oncol. 2016;1:19–26.
- Linge A, Lo ck S, Gudziol V, et al. Low cancer stem cell marker expression and low hypoxia identify good prognosis subgroups in HPV(-) HNSCC after postoperative radiochemotherapy: a multicenter study of the DKTK-ROG. Clin Cancer Res. 2016;22:2639–2649.
- Thorwarth D, Eschmann SM, Scheiderbauer J, et al. Kinetic analysis of dynamic 18F-fluoromisonidazole PET correlates with radiation treatment outcome in head-and-neck cancer. BMC Cancer. 2005;5:152–160.
- Thorwarth D, Eschmann S-M, Paulsen F, et al. A model of reoxygenation dynamics of head-and-neck tumors based on serial 18F-fluoromisonidazole positron emission tomography investigations. Int J Radiat Oncol. 2007;68:515–521.
- Pignon J-P, Maître A. l, Maillard E, et al. Meta-analysis of chemotherapy in head and neck cancer (MACH-NC): an update on 93 randomised trials and 17,346 patients. Radiother Oncol. 2009;92:4–14.
- Budach V, Stromberger C, Poettgen C, et al. Hyperfractionated Accelerated Radiation Therapy (HART) of 70.6 Gy with concurrent 5-FU/Mitomycin C is superior to HART of 77.6 Gy alone in locally advanced head and neck cancer: long-term results of the ARO 95-06 randomized phase III trial. Int J Radiat Oncol. 2015;91:916–924.
- Horsman MR, Mortensen LS, Petersen JB, et al. Imaging hypoxia to improve radiotherapy outcome. Nat Rev Clin Oncol. 2012;9:674–687.
- Dirix P, Vandecaveye V, De Keyzer F, et al. Dose painting in radiotherapy for head and neck squamous cell carcinoma: value of repeated functional imaging with (18)F-FDG PET, (18)F-fluoromisonidazole PET, diffusion-weighted MRI, and dynamic contrast-enhanced MRI. J Nucl Med. 2009;50:1020–1027.
- Mortensen LS, Johansen J, Kallehauge J, et al. FAZA PET/CT hypoxia imaging in patients with squamous cell carcinoma of the head and neck treated with radiotherapy: results from the DAHANCA 24 trial. Radiother Oncol. 2012;105:14–20.
- Welz S, Mönnich D, Pfannenberg C, et al. Prognostic value of dynamic hypoxia PET in head and neck cancer: results from a planned interim analysis of a randomized phase II hypoxia-image guided dose escalation trial. Radiother Oncol. 2017; DOI: 10.1016/j.radonc.2017.04.004.
- Lee N, Schoder H, Beattie B, et al. Strategy of using intratreatment hypoxia imaging to selectively and safely guide radiation dose de-escalation concurrent with chemotherapy for locoregionally advanced human papillomavirus-related oropharyngeal carcinoma. Radiat Oncol Biol. 2016;96:9–17.
- Toma-Dasu I, Uhrdin J, Antonovic L, et al. Dose prescription and treatment planning based on FMISO-PET hypoxia. Acta Oncol. 2012;51:222–230.
- Thorwarth D, Eschmann S-M, Paulsen F, et al. Hypoxia dose painting by numbers: a planning study. Int J Radiat Oncol Biol Phys. 2007;68:291–300.
- Zschaeck S, Haase R, Abolmaali N, et al. Spatial distribution of FMISO in head and neck squamous cell carcinomas during radio-chemotherapy and its correlation to pattern of failure. Acta Oncol. 2015;54:1355–1363.
- Bittner M, Wiedenmann N, Bucher S, et al. Exploratory geographical analysis of hypoxic subvolumes using 18F-MISO-PET imaging in patients with head and neck cancer in the course of primary chemoradiotherapy. Radiother Oncol. 2013;108:511–516.
- Okamoto S, Shiga T, Yasuda K, et al. High reproducibility of tumor hypoxia evaluated by 18F-fluoromisonidazole PET for head and neck cancer. J Nucl Med. 2013;54:201–208.
- Yaromina A, Krause M, Thames H, et al. Pre-treatment number of clonogenic cells and their radiosensitivity are major determinants of local tumour control after fractionated irradiation. Radiother Oncol. 2007;83:304–310.
- Mönnich D, Welz S, Thorwarth D, et al. Robustness of quantitative hypoxia PET image analysis for predicting local tumor control. Acta Oncol. 2015;54:1364–1369.
- Due AK, Vogelius IR, Aznar MC, et al. Methods for estimating the site of origin of locoregional recurrence in head and neck squamous cell carcinoma. Strahlenther Onkol. 2012;188:671–676.