
 ?Mathematical formulae have been encoded as MathML and are displayed in this HTML version using MathJax in order to improve their display. Uncheck the box to turn MathJax off. This feature requires Javascript. Click on a formula to zoom.
Abstract
Background: The increased linear energy transfer (LET) at the end of the Bragg peak causes concern for an elevated and spatially varying relative biological effectiveness (RBE) of proton therapy (PT), often in or close to dose-limiting normal tissues. In this study, we investigated dose-averaged LET (LETd) distributions for spot scanning PT of prostate cancer patients using different beam angle configurations. In addition, we derived RBE-weighted (RBEw) dose distributions and related normal tissue complication probabilities (NTCPs) for the rectum and bladder.
Material and methods: A total of 21 spot scanning proton plans were created for each of six patients using a prescription dose of 78 Gy(RBE1.1), with each plan using two ‘mirrored’ beams with gantry angles from 110°/250° to 70°/290°, in steps of 2°. Physical dose and LETd distributions were calculated as well as RBEw dose distributions using either RBE = 1.1 or three different variable RBE models. The resulting biological dose distributions were used as input to NTCP models for the rectum and bladder.
Results: For anterior oblique (AO) configurations, the rectum LETd volume and RBEw dose increased with increasing angles off the lateral opposing axis, with the RBEw rectum dose being higher than for all posterior oblique (PO) configurations. For PO configurations, the corresponding trend was seen for the bladder. Using variable RBE models, the rectum NTCPs were highest for the AO configurations with up to 3% for the 80°/280° configuration while the bladder NTCPs were highest for the PO configurations with up to 32% for the 100°/260°. The rectum D1cm3 constraint was fulfilled for most patients/configurations when using uniform RBE but not for any patient/configuration with variable RBE models.
Conclusions: Compared to using constant RBE, the variable RBE models predicted increased biological doses to the rectum, bladder and prostate, which in turn lead to substantially higher estimated rectum and bladder NTCPs.
Introduction
The concept of relative biological effectiveness (RBE) is used to relate the biological effect of charged particles, e.g., proton therapy (PT), to the effect of conventional photon-based radiotherapy (RT). As of today, PT planning is performed, assuming that the biological effect of protons is uniformly 10% higher than for photons (as recommended by the ICRU), expressed as a constant proton RBE of 1.1. However, the RBE is known to depend on several factors such as the dose per fraction [Citation1], the α/β ratio of the tissue obtained from cell survival curves after exposure to X-rays ((α/β)x) [Citation2], as well as the linear energy transfer (LET) [Citation3]. In addition, the LET varies along the particle track, increasing toward the distal end of the spread-out Bragg peak (SOBP), with implications for the estimated RBE [Citation4–7]. Paganetti [Citation5] also suggested that a generic RBE value is not unreasonable within the SOBP that encloses the target, but recommends that the RBE should be chosen conservatively in order to achieve the prescribed tumor dose.
When treating prostate cancer patients with protons, two opposing lateral beams have often been used. However, this might give relatively high doses to organs such as the femur/femoral heads, or in some cases, the target or normal tissue constraints cannot be fulfilled. Oblique lateral fields may therefore be applied as in the study of Colaco et al. [Citation8], where beam angles up to ±11° off the lateral opposing field configuration were used. Using anterior or posterior oblique (AO/PO) lateral fields, the distal ends of the SOBP will be directed more toward or extend into organs at risk (OARs), such as the rectum or bladder. Consequently, this approach may produce areas of higher RBE in proximity or within these OARs. One way to assess the implications of this with respect to the varying RBE is by using proton-specific biological models that incorporates parameters such as dose, tissue α/β ratio and LET [Citation9–11]. Many of the published RBE models for protons are based on in vitro data, but are also distinctly different primarily in their dependence on ((α/β)x) [Citation9]. Hence, including several models in clinical analyses is valuable to account for the different possible RBE scenarios.
The aim of this study was therefore to investigate how the increased dose-averaged LET (LETd) at the distal end of oblique lateral spot scanning proton beams influenced the RBE-weighted (RBEw) dose to OARs for prostate cancer patients. We applied three different variable RBE models to derive RBEw dose distributions that were used as input to normal tissue complication probability (NTCP) models of rectum and bladder toxicity.
Material and methods
Patient and image materials
Six patients (without rectal balloons or spacers) diagnosed with prostate cancer were included in the analysis. The planning CTs (pCTs) with relevant volumes of interest were delineated by a radiation oncologist. The CT scans were acquired with the patient in supine position using a 2–3 mm slice thickness and with an image size of 512 × 512 pixels. The clinical target volume (CTV) included the prostate only (i.e., no seminal vesicles), and the CTV to planning target volume (PTV) margins were 4 mm axially and 6 mm in the superior/inferior directions as used by Mendenhall et al. [Citation12] and Bryant et al. [Citation13]. The rectal wall and bladder wall were automatically constructed as 3-mm-thick wall structures within the rectum and bladder.
Treatment planning
The PTV was prescribed a dose of 78 Gy(RBE1.1) in 39 fractions. In the overlapping region between the PTV and the rectum, this PTV region was permitted to receive a lower dose in order to accommodate the rectum constraints (). The proton plans were optimized in TRiP98 [Citation14] with two ‘mirrored’ beams ranging from 110°/250° to 70°/290° in steps of 2° resulting in 21 plans for each patient (Suppl. figure 1 for an overview of beam angle configurations). Spot sizes, which are matched with an accelerator table once the beam energies are known, were 3 mm (full width at half maximum) while the spot spacing was set to 1 mm. TRiP98 was used for treatment planning as it provided both LETd calculations (not available in our clinical TPS) and easily accessible scripting to allow calculations of multiple plans with different beam angle configurations. The dE/dx tables of TRiP98 are Monte Carlo generated and based on Lühr et al. [Citation15].
Table 1. Dosimetric constraints for rectum wall, bladder wall, rectum and PTV.
Data analysis
The physical dose and LETd distributions were calculated in TRiP98 for all beam angle configurations and patients. These were further applied in three variable RBE models, McNamara [Citation9], Wedenberg [Citation10] and Carabe [Citation11], to calculate the resulting RBEw dose distributions (). Besides dose per fraction and LETd, (α/β)x ratios for different tissues were required input for all three models. Model parameters applied were the (α/β)x ratios of the rectum (3.0 Gy [Citation16]), bladder (4.0 Gy [Citation17]) and prostate/CTV (1.93 Gy [Citation18]), while the remaining volume was considered generic normal tissue, with (α/β)x = 3.0 Gy. Dose-volume histograms (DVHs) were then extracted for all plans and patients and analyzed for the rectum, rectum wall, bladder, bladder wall and PTV using different metrics ( and ). LETd volume histograms (LVHs) were also extracted for the rectum and bladder where we calculated the metric V10keV/µm, quantifying the volume fraction of the OARs receiving LETd of more than 10 keV/µm (we assumed low LET to be 10 keV/µm or below). The Lyman–Kutcher–Burman NTCP model was used for the rectum and bladder. The rectum parameters applied (TD50 = 76.9 Gy, n = 0.09 and m = 0.13) were for endpoint grade ≥2 late toxicity or rectal bleeding [Citation19], while for the bladder (TD50 = 91.0 Gy, n = 0.01 and m = 0.19), the endpoint was obstruction [Citation20]. All calculations were performed with the DVH analysis tool DVHmetrics.
Figure 1. From top to bottom: RBE1.1 dose distribution, LETd distribution and difference in dose distribution between the three RBE models (McNamara, Wedenberg and Carabe) and RBE1.1 for three beam angle configurations (80°/280° (left), 90°/270° (middle) and 100°/260° (right)) for one patient (Patient 3). Orange/top contour is the bladder, blue/middle contour is the PTV, and brown/bottom contour is the rectum. MN: McNamara; WB: Wedenberg; CB: Carabe.
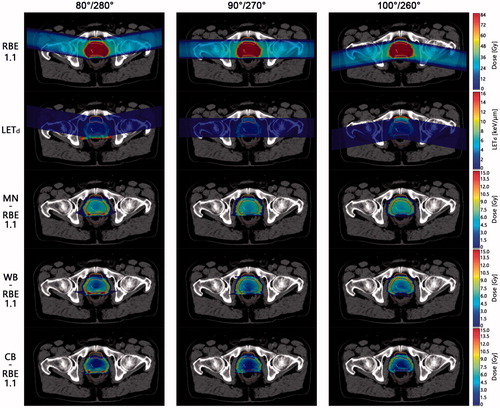
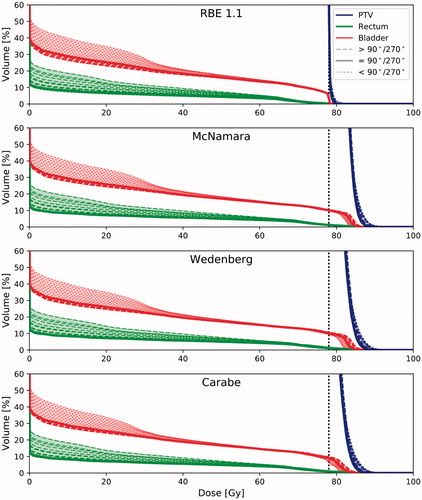
Figure 2. DVHs for PTV (blue/far right curves), rectum (green/bottom curves) and bladder (red/top curves) for one patient (Patient 3). Vertical dotted black line is an indicator of the prescribed dose of 78 Gy(RBE1.1). The general trend is that posterior oblique fields increase the rectum dose and decrease bladder dose, while the opposite is seen for anterior oblique fields. As a result, for the most posterior fields, the highest dose is seen in the rectum, and the opposite is seen for the bladder and the most anterior fields.
Results
The mean (physical) doses to the rectum increased while the doses to the bladder decreased with increasing off-axis angles for AO field configurations, whereas the opposite was seen for PO field configurations (). However, for the LETd, this trend was reversed as the V10keV/µm in the rectum increased with angles away from the lateral opposing axis for AO field configurations, while increasing off-lateral axis angle for PO configurations increased the V10keV/µm in the bladder (). In one patient, the rectum V10keV/µm increased from 0% for lateral opposing fields to 6% for the outermost AO field configuration, while an increase from 0% up to 3% was seen in the bladder for another patient for PO field configurations ( and Suppl. figure 2 for further details).
Figure 3. LVHs for PTV (blue/almost solid vertical line), rectum (light green) and bladder (dark purple) for all patients. Dotted lines represent angle configurations below the 90°/270° configuration, solid line is the 90°/270° configuration, and dashed lines represent configurations above the 90°/270° configuration. The general trend is that anterior oblique fields increase the rectum LETd and decrease bladder LETd, while the opposite is seen for posterior oblique fields. As a result, for the most anterior fields, the highest LETd is seen in the rectum, and the opposite is seen for the bladder and the most posterior fields.
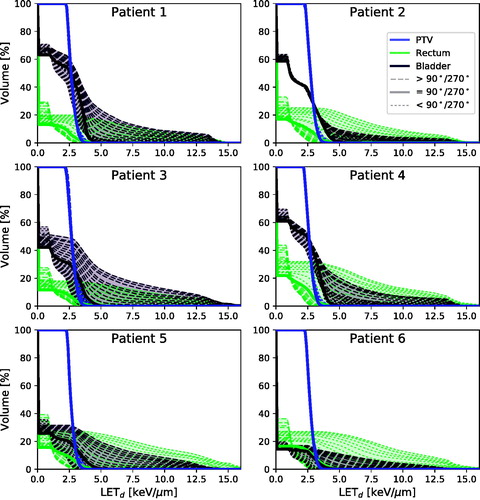
Table 2. The high-LET volume percentage V10keV/µm for LETd and range in the rectum and bladder for five different beam angle configurations (70°/290°, 80°/280°, 90°/270°, 100°/260° and 100°/250°).
The trend seen for the LETd also translated across the variable RBEw dose distributions as they were highly influenced by the LETd. Almost every constraint () was fulfilled for both the variable RBE models and the uniform RBE model (RBE = 1.1) except for the rectum D1cm3 constraint. This rectum constraint was fulfilled for most field configurations and patients when using the uniform RBE of 1.1 while it was violated for all configurations and patients when using the variable RBE models. For one patient and all three variable RBE models, we found that the D1cm3 constraint for the 80°/280° configuration had higher values than even the outermost PO configuration () with a median value of 78.8 Gy (range: 77.7–79.2 Gy) for the 80°/280° configuration vs. 77.6 Gy (range: 76.1–78.6 Gy) for the outermost PO configuration. The V82Gy for the bladder wall was below the constraint for all cases except for one case (Patient 2) with the RBEMcNamara model where the values were consistently higher for all angle configurations with a median of 7.5 cm3 (range: 7.4–7.6 cm3).
Figure 4. (a) Rectum D1cm3 and (b) rectum NTCP values for one patient (Patient 2) and (c) bladder NTCP values for one patient (Patient 5) for all angle configurations and models (RBE1.1 (blue/dots), McNamara (green/triangles), Wedenberg (yellow/plus signs) and Carabe (red/diamonds)). The gray line is the D1cm3 constraint (D1cm3 < 74 Gy(RBE1.1)). For (b) rectum NTCP, we considered the endpoint grade ≥2 late toxicity or rectal bleeding [Citation19] (TD50 = 76.9 Gy, n = 0.09 and m = 0.13), and for (c) bladder NTCP, we considered the endpoint obstruction [Citation20] (TD50 = 91.0 Gy, n = 0.01 and m = 0.19).
![Figure 4. (a) Rectum D1cm3 and (b) rectum NTCP values for one patient (Patient 2) and (c) bladder NTCP values for one patient (Patient 5) for all angle configurations and models (RBE1.1 (blue/dots), McNamara (green/triangles), Wedenberg (yellow/plus signs) and Carabe (red/diamonds)). The gray line is the D1cm3 constraint (D1cm3 < 74 Gy(RBE1.1)). For (b) rectum NTCP, we considered the endpoint grade ≥2 late toxicity or rectal bleeding [Citation19] (TD50 = 76.9 Gy, n = 0.09 and m = 0.13), and for (c) bladder NTCP, we considered the endpoint obstruction [Citation20] (TD50 = 91.0 Gy, n = 0.01 and m = 0.19).](/cms/asset/df5410c1-7652-4419-bde4-8e461d4444d7/ionc_a_1373198_f0004_c.jpg)
Using the constant RBEw dose distribution, the PTV D95% constraint was fulfilled for all patients with no particular differences between beam angle configurations, which was also the case for the mean dose of the PTV. Depending on variable RBE model, the overall median D95% and median mean dose were 4–7% and 2–6% higher than what was seen for the constant RBE (Carabe producing the lowest values and McNamara producing the highest values in both cases).
The rectum NTCPs followed the same trend as was seen for the D1cm3 metric with higher values with increasing off-axis angles for AO configurations with the variable RBE models, and reversely, the bladder NTCPs were higher for the PO field configurations. For the variable RBE models, even moderately oblique AO beam angle configurations such as the 80°/280° AO configuration for the rectum had higher NTCP compared to the outermost PO configuration (). A corresponding trend was seen for the bladder NTCP for the 100°/260 configuration vs. the AO directions (). Overall, for the variable RBE models, the lowest RBE value found was 0.8 (Carabe), while the largest was 3.1 (McNamara).
Discussion
In this study, we have explored the variation of LETd distributions for different spot scanning beam angle configurations used to treat prostate cancer, and how the LETd distributions in turn impacts the RBE doses that may deviate from using a constant RBE of 1.1. Compared to using a constant RBE, we found that AO field configurations increased the LETd in the rectum, leading to an increase also in the rectum RBEw doses when using the variable RBE models. The situation was reversed for the PO field configurations.
Our analysis of beam configurations showed that one constraint in particular (the rectum D1cm3) could be challenging to fulfill for some configurations even when using the constant RBE of 1.1. Using the variable RBE models, this constraint was violated for all configurations and patients (Suppl. figure 1), indicating that the variable RBE models have large influence on the dose levels close to the prescription doses. Underwood et al. [Citation21] performed a similar study in which they investigated the situations where PT should be expected to outperform intensity-modulated RT. Although only considering ±35° proton beams and only using the Wedenberg model, their conclusion was similar to ours as they also were unable to meet the tumor and rectal constraints for both fixed and variable RBE models. Rectal spacers were not included in the patient cohort in our study, but have been shown to be efficient when using AO fields in treatment of prostate cancer [Citation22]. Hence, for the rectum, this could potentially have improved the outcome of our results (e.g., the D1cm3 constraint), which proved to be hard to fulfill when evaluated with the variable RBE models. It should also be pointed out that beam angle configurations using oblique beams with as much as ±20° off the lateral axis are not common practice, although configurations around ±11° have been used clinically [Citation12,Citation13]. In our results, the main difference between beam angles around ±10° and ±20° off-axis was the volume percentage receiving high LETd ().
As demonstrated in our study, the elevated LETd at the distal end of the proton beam increased the variable RBEw dose in posterior or anterior OARs when going off-axis relative to the lateral opposing configuration. The resulting regions of increased variable RBEw dose are then directed toward the bladder and rectum and increased the estimated NTCP. In addition, Grün et al. [Citation23] recently showed that the effective proton range, i.e., distal end of the Bragg peak, was also influenced by the variable RBE, with up to 4 mm increased penetration depth compared to an RBE of 1.1. In turn, this impacts the RBE gradient and thus also the biologically effective penetration depth of the beam.
Variable RBEw proton dose distributions have been used as input to conventional NTCP models also in a few previous studies that focused on prostate cancer, yet mostly on single or few patient cases [Citation24,Citation25]. Furthermore, we used three different variable RBE models to account for the uncertainty in these models. The main difference between the three RBE models comes from the large differences in the databases used, i.e., the in vitro data. In addition, different fit parameters and different dependencies in the models can also be credited to particular differences between the models: (i) the Carabe model [Citation11] applies a linear relationship between RBEmin, RBEmax and LETd with a slope depending on (α/β)x; (ii) the Wedenberg model [Citation10] is based on the assumption that there is a linear relationship between α and LETd with a slope depending on (α/β)x, while RBEmin is assumed to be independent of LETd and (α/β)x; and (iii) the McNamara model [Citation9] is based on the same assumptions as the Carabe model but with a RBEmin dependence on . In our study, we also assumed that the NTCP model, as well as the parameters used as input, was applicable for the variable RBEw dose distributions, despite being derived from outcomes after photon-based RT. Also with accurate quantification of the input variables (e.g., dose and LET), the output (e.g., NTCP and RBE estimates) will be influenced by uncertainties in the parameters of the models (α/β ratios for RBE models, and TD50, n and m parameters for the NTCP model), which are estimated from empirical data. In addition, the variable RBEw dose distributions overall increased the maximum dose to OARs compared to the uniform RBEw dose. Since the NTCP parameters for both the rectum and bladder have low n values (suggesting a low volume effect), the influence of the RBE models on the NTCP should be larger for prostate cancer patients than it would for tumor sites where, e.g., the lung (that has an n value close to 1) is the critical normal tissue; for the lung, the NTCP correlates with the mean dose and may therefore be less influenced by the differences between the constant and variable RBEw doses. In order to further investigate the uncertainties in the parameters, and their influence on the RBEw dose, one option would be to perform a model parameter scan to identify the influence of these variations [Citation26].
In our study, we found that the low α/β ratio of the prostate translated into a higher biological dose in the target than estimated using RBE = 1.1 [Citation5]. The RBE also increases with decreasing dose [Citation2]. However, hypo-fractionation is becoming a more common treatment scheme for prostate cancer [Citation27], which could lower the RBE. In such case, the difference between the constant RBE and the three variable RBE dose distributions would become less pronounced.
A study by Moteabbed et al. [Citation28] showed that using ±35° proton beams made prostate treatment more susceptible to target under-dosage caused by inter-fractional variations. An interesting future study would be to combine inter-fractional motion with variable RBE models, both in regard to target coverage as they showed, but also to see whether there would be an elevated risk of normal tissue toxicity in the rectum and bladder regions.
In conclusion, use of oblique beam angles had a significant impact on the LETd distribution in the rectum and bladder during PT of prostate cancer. By using three recent LETd-based RBE models, we also showed that this led to elevated biological doses in the rectum, bladder and prostate compared to using a constant RBE of 1.1. Consequently, this resulted in substantially higher estimated rectum and bladder NTCPs. In addition, normal tissue constraints that were fulfilled when using a constant RBE of 1.1 were not met when considering the variable RBEw dose distributions.
IONC_A_1373198_Supplementary_Information.docx
Download MS Word (5.7 MB)Acknowledgments
Michael Krämer, GSI Biophysik, Darmstadt, is acknowledged for providing TRiP98.
Disclosure statement
No potential conflict of interest was reported by the authors.
References
- Wouters ABG, Lam GKY, Oelfke U, et al. Measurements of relative biological effectiveness of the 70 MeV proton beam at TRIUMF using Chinese hamster V79 cells and the high-precision cell sorter assay. Radiat Res. 2016;146:159–170.
- Paganetti H, Niemierko A, Ancukiewicz M, et al. Relative biological effectiveness (RBE) values for proton beam therapy. Int J Radiat Oncol Biol Phys. 2002;53:407–421.
- Paganetti H, Van Luijk P. Biological considerations when comparing proton therapy with photon therapy. Semin Radiat Oncol. 2013;23:77–87.
- Carabe A, Moteabbed M, Depauw N, et al. Clinical consequences of relative biological effectiveness variations in proton radiotherapy of the prostate, brain and liver. Phys Med Biol. 2013;58:2103–2117.
- Paganetti H. Relative biological effectiveness (RBE) values for proton beam therapy. Variations as a function of biological endpoint, dose, and linear energy transfer. Phys Med Biol. 2014;59:R419–R472.
- Chaudhary P, Marshall TI, Perozziello FM, et al. Relative biological effectiveness variation along monoenergetic and modulated Bragg peaks of a 62-MeV therapeutic proton beam: a preclinical assessment. Int J Radiat Oncol Biol Phys. 2014;90:27–35.
- Peeler CR, Mirkovic D, Titt U, et al. Clinical evidence of variable proton biological effectiveness in pediatric patients treated for ependymoma. Radiother Oncol. 2016;121:395–401.
- Colaco RJ, Hoppe BS, Flampouri S, et al. Rectal toxicity after proton therapy for prostate cancer: an analysis of outcomes of prospective studies conducted at the University of Florida Proton Therapy Institute. Int J Radiat Oncol Biol Phys. 2015;91:172–181.
- McNamara AL, Schuemann J, Paganetti H. A phenomenological relative biological effectiveness (RBE) model for proton therapy based on all published in vitro cell survival data. Phys Med Biol. 2015;60:8399–8416.
- Wedenberg M, Lind BK, Hårdemark B. A model for the relative biological effectiveness of protons: the tissue specific parameter α/β of photons is a predictor for the sensitivity to LET changes. Acta Oncol. 2013;52:580–588.
- Carabe A, Moteabbed M, Depauw N, et al. Range uncertainty in proton therapy due to variable biological effectiveness. Phys Med Biol. 2012;57:1159–1172.
- Mendenhall NP, Li Z, Hoppe BS, et al. Early outcomes from three prospective trials of image-guided proton therapy for prostate cancer. Int J Radiat Oncol Biol Phys. 2012;82:213–221.
- Bryant C, Smith TL, Henderson RH, et al. Five-year biochemical results, toxicity, and patient-reported quality of life after delivery of dose-escalated image guided proton therapy for prostate cancer. Int J Radiat Oncol Biol Phys. 2016;95:422–434.
- Krämer M, Jäkel O, Haberer T, et al. Treatment planning for heavy-ion radiotherapy: physical beam model and dose optimization. Phys Med Biol. 2000;45:3299–3317.
- Lühr A, Toftegaard J, Kantemiris I, et al. Stopping power for particle therapy: the generic library libdEdx and clinically relevant stopping-power ratios for light ions. Int J Radiat Biol. 2012;88:209–212.
- Marzi S, Saracino B, Petrongari M, et al. Modeling of alpha/beta for late rectal toxicity from a randomized phase II study: conventional versus hypofractionated scheme for localized prostate cancer. J Exp Clin Cancer Res. 2009;28:117.
- Koukourakis MI, Abatzoglou I, Touloupidis S, et al. Biological dose volume histograms during conformal hypofractionated accelerated radiotherapy for prostate cancer. Med Phys. 2007;34:76–80.
- Vogelius IR, Bentzen SM. Meta-analysis of the alpha/beta ratio for prostate cancer in the presence of an overall time factor: bad news, good news, or no news? Int J Radiat Oncol Biol Phys. 2013;85:89–94.
- Michalski JM, Gay H, Jackson A, et al. Radiation dose-volume effects in radiation-induced rectal injury. Int J Radiat Oncol Biol Phys. 2010;76(3 Suppl):123–129.
- Thor M, Olsson C, Oh JH, et al. Urinary bladder dose-response relationships for patient-reported genitourinary morbidity domains following prostate cancer radiotherapy. Radiother Oncol. 2016;119:117–122.
- Underwood T, Giantsoudi D, Moteabbed M, et al. Can we advance proton therapy for prostate? Considering alternative beam angles and relative biological effectiveness variations when comparing against intensity modulated radiation therapy. Int J Radiat Oncol Biol Phys. 2016;95:454–464.
- Underwood TSA, Voog JC, Moteabbed M, et al. Hydrogel rectum-prostate spacers mitigate the uncertainties in proton relative biological effectiveness associated with anterior-oblique beams. Acta Oncol. 2017;56:575–581.
- Grün R, Friedrich T, Krämer M, et al. Physical and biological factors determining the effective proton range. Med Phys. 2013;40:111716.
- Tilly N, Johansson J, Isacsson U, et al. The influence of RBE variations in a clinical proton treatment plan for a hypopharynx cancer. Phys Med Biol. 2005;50:2765–2777.
- Ödén J, Eriksson K, Toma-Dasu I. Inclusion of a variable RBE into proton and photon plan comparison for various fractionation schedules in prostate radiation therapy. Med Phys. 2017;44:810–822.
- Stokkevåg CH, Fukahori M, Nomiya T, et al. Modelling of organ-specific radiation-induced secondary cancer risks following particle therapy. Radiother Oncol. 2016;120:300–306.
- Yu JB. Hypofractionated radiotherapy for prostate cancer: further evidence to tip the scales. J Clin Oncol. 2017;35:1867–1869.
- Moteabbed M, Trofimov A, Sharp GC, et al. Proton therapy of prostate cancer by anterior-oblique beams: implications of setup and anatomy variations. Phys Med Biol. 2017;62:1644–1660.