
Abstract
Purpose: Few data is available on rectal tumor shrinkage during preoperative chemoradiotherapy (CRT). This regression pattern is interesting to optimize timing of dose escalation on the tumor.
Methods: Gross tumor volumes (GTV) were contoured by two observers on magnetic resonance imaging (MRI) obtained before, weekly during, 2–4 weeks after, and 7–8 weeks after a 5-week course of concomitant CRT for rectal cancer.
Results: Overall, 120 MRIs were acquired in 15 patients. A statistically significant tumor volume reduction is seen from the first week, and between any two time points (p < .007). At the end of CRT, 46.3% of the initial tumor volume remained, and 32.4% at time of surgery. PTV measured 61.2% at the end of treatment. Tumor shrinkage is the fastest in the beginning of treatment (26%/week), slows down to 7%/week in the last 2 weeks of CRT, and finally to 1.3%/week in the last 5 weeks before surgery.
Conclusions: The main rectal tumor regression occurs during CRT course itself, and mostly in the first half, with shrinking speed decreasing over the course. This suggests that a sequential boost is preferably done after the elective fields, yielding an average PTV-reduction of 39%. A simultaneous integrated boost strategy could benefit from adaptive planning during the course.
Introduction
The standard of care for locally advanced rectal cancer is pre-operative chemoradiotherapy (CRT) followed by total mesorectal excision (TME) surgery [Citation1]. CRT decreases the risk of local recurrence, and can downsize the tumor, thereby increasing the chance of a radical resection. In around 15–20% of patients, tumor reduction yields a pathological complete response (pCR), i.e., no tumor is found in the resection specimen [Citation2]. Hence, an organ preservation strategy might be considered in patients with a clinical complete response after CRT [Citation3], and such a ‘wait and watch’ strategy may result in the same clinical outcome as surgery [Citation4].
Therefore, it is of interest to maximize the complete response rate. Since this rate is dose-dependent [Citation5–8], dose escalation on the primary tumor, a boost dose, is attractive [Citation9]. The boosted volume should however be kept to a minimum, in order to limit any increase in toxicity. A boost dose can be delivered sequentially (before or after the regular radiotherapy course) or as a simultaneous integrated boost (SIB), combining the elective dose and the boost dose in the same delivery [Citation10,Citation11]. The volume to be boosted will depend on the chosen strategy and timing. For a SIB, it may prove beneficial to adapt the boost volume during treatment, if tumor regression during treatment is common. This raises the question when the gross tumor volume (GTV) responds during treatment. Only two articles have assessed the GTV volume during CRT, and only at one time point [Citation12,Citation13]. A more precise volume–time curve can reveal the optimal timing for a tumor boost, and show whether adaptive radiotherapy (ART) is warranted when using a SIB approach. We therefore performed a prospective study in which the rectal tumor was evaluated every week during CRT. Magnetic resonance imaging (MRI) evaluation was chosen over CT imaging because of its superiority in rectal tumor visualization.
Methods
Patients and treatment
Patients with a biopsy-proven adenocarcinoma of the rectum (cT3–4 N0–2), referred for preoperative CRT, were prospectively included. The trial was approved by the ethical committee (NL31131.041.10), and all patients signed informed consent.
Patients received standard preoperative CRT treatment according to institution guidelines including standardized bladder filling instructions. Irradiation dose was 50 Gy in 25 fractions of 2 Gy, delivered in 5 weeks on workdays combined with oral capecitabine (Xeloda®, Roche, Basel, Swiss) b.i.d. (two times a day). No special clinical preoperative evaluations were planned, since response prediction was not the aim of this study.
Magnetic resonance imaging
Eight MRI scans sessions were performed for every patient: before therapy, weekly during 5 weeks of treatment, 2–4 weeks after CRT, and 7–8 weeks after CRT (shortly before surgery). MRI was performed in treatment position (supine), using a flat table-top on a 3T MRI scanner (Philips Achieva and Philips Ingenia 3TX, Best, the Netherlands). Anatomical T2w and diffusion weighted images (DWI) were acquired. T2w imaging was acquired on a resolution of 0.47 × 0.47 mm2 (Philips Achieva) or 0.82 × 0.82 mm2 (Philips Ingenia), with a slice thickness of 3 mm.
Since, we aimed to evaluate a potential boost volume, the GTV of the primary tumor was contoured on axial T2-weighted images [Citation14], by two experienced radiation oncologists independently, for every MRI scan. Resulting contours were compared by Dice similarity coefficients. In case of a dissimilarity (Dice <0.7), the contours were discussed and a consensus contouring reached, otherwise the mean volume was noted. Planning target volumes (PTVs) were created using expansions of 7 mm laterally, 11 mm anteroposterior and 13 mm craniocaudally around the GTV [Citation15].
Statistics
Volumes at different time points were compared with paired t-tests, after checking normality. To compensate for these multiple comparisons (n = 7), α was set at 0.007, according to the Bonferroni correction. A cubic interpolation of PTV measurements was done to enable finding optimal adaptation time points.
Results
Overall, 120 MRIs were acquired in 15 patients, after exclusion of one patient without MRI baseline. Patient characteristics are shown in . Most patients presented with cT3 disease (n = 13/15). Initial GTV volume ranged from 16 to 138 cc. After initial contouring of all MRIs, Dice similarity between observers was 0.76 ± 0.17 on average. Dice measured >0.7 for all MRIs of 13/15 patients. Consensus delineations were obtained for the remaining two patients.
Table 1. Patients characteristics.
In almost all patients, tumor shrinkage was clearly visible in the first 2 weeks of CRT ( and ). One patient showed no response during CRT and suffered local progression before planned surgery. He was however included in all analyzes.
Figure 1. Example of tumor regression over time in a single patient (sagittal T2-weighted images). Decrease in GTV volume (red) is already visible in the first week of CRT.
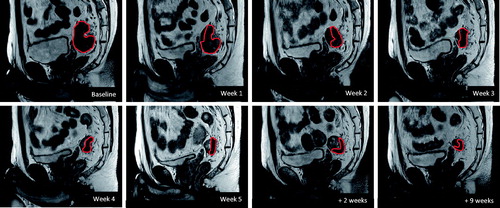
Figure 2. Evolution of target volumes (mean ± standard deviation) over time, relative to baseline volume, for GTV (red) and PTV (blue). N = 15. Asterisk (*) denotes significant difference with previous time-point (p < .007). Other p values range between .01 and .07.
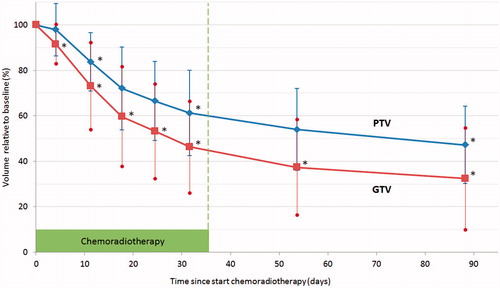
On the whole, a statistically significant reduction is seen in Week 1 (measuring point averagely after 3.9 days of treatment), and also between any other two time points (, ). GTV measured 46.3% of the initial volume in the fifth week of CRT, and 32.4% at time of surgery (). Initial tumor volume had no influence on the relative shrinkage. PTV reduction was less pronounced, with a remaining volume of 61.2% at the end of treatment compared to the initial PTV.
Table 2. Mean tumor volumes at different time points during and after therapy (n = 15).
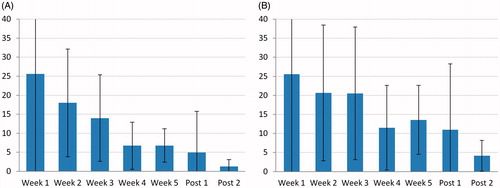
Tumor shrinkage rate is the fastest in the beginning of treatment (26%/week), slows down to 7%/week in the last 2 weeks of CRT, and finally to 1.3%/week in the last 5 weeks before surgery (, percentages relative to initial tumor volume).
Figure 3. Speed of GTV shrinkage over the CRT course (mean ± standard deviation). (A) Absolute shrinkage per week (expressed in % relative to the baseline volume). (B) Shrinkage relative to the previous measurement (%/week). (N = 15; Post 1 and 2: respectively 2–4 weeks and 7–8 weeks post CRT).
shows the average PTV reduction that can be obtained with different adaptive strategies, either by adapting a SIB plan (12.4–21.6% reduction of baseline PTV volume) or with a sequential boost after the regular course (39% reduction).
Table 3. Average PTV boost volume reduction using different adaptive strategies.
Discussion
We aimed to determine the regression pattern of rectal tumors during CRT. Based on our evaluation, shrinkage starts already in the first week of CRT, and continues up to the time of surgery (), albeit slowing down. The majority of tumor regression therefore occurs during CRT (54% reduction of the GTV), which can have important consequences on boost strategies. Naturally, PTV reduction is less pronounced (), since an important part of the planning volume is created by applying a fixed uncertainty margin. Yet, with an average PTV reduction of 69 cc (39%), adapting the target volume can prove worthwhile, depending on the boost strategy chosen.
A first option is a simultaneous boost (SIB) strategy, with the advantage of integrating different dose levels within a single treatment fraction. It seems then interesting to adapt the boosted volume to the shrinking tumor (). Adapting at one time point (halfway the course) already yields a reduction of 12.4% of the average PTV, when the whole course is taken into account. Providing more adaptation points improves the benefit, but differences become smaller. A daily modification provides the maximum advantage of the SIB approach: 20% when every new plan is taken into use the next fraction and 21.6% if the daily plan is used on-line immediately. The exact impact of these strategies on dosimetry should be explored. The interest in ART is increasing, but practical considerations restrain broad clinical use, among which the high workload of recontouring and replanning [Citation16]. Of course, more frequent adaptation brings more workload. The balance between workload and benefit can be assessed in , together with the optimal adaptation time points in function of the number of adaptations. Systems such as the MRI linac aim to improve the adaptation workflow with high quality online soft-tissue imaging and automatic non-rigid contour propagation [Citation17].
A second strategy is a sequential boost dose delivery after the regular CRT treatment. The treatment duration is then slightly prolonged, but this additional fractionation can also provide radiobiological advantages [Citation18]. The main benefit of this approach is however boosting the smallest tumor volume obtainable (), and minimizing irradiation of organs at risk. This is especially important in the context of an organ preservation strategy, where also rectal dose becomes meaningful, since late rectal toxicity is associated with rectal volume receiving ≥60 Gy [Citation19,Citation20]. The shrinkage benefit amounts 39% of PTV volume, almost twice the benefit of an adaptive SIB approach (), which can easily be explained by the fact that a SIB starts at fraction 1 and for sequential boost the optimal time is awaited. Lastly, delivering the boost separately could make target positioning more precise, since the elective fields don’t have to be reckoned with.
Until present, the pattern of rectal tumor shrinkage during CRT was unknown. A linear (fixed volume over time) or an exponential regression (fixed proportion over time) was expected. On , the decrease of the speed from 26%/week to 7%/week seems exponential, which could mean the velocity decreases at the same rate as the tumor. However, plotting the weekly reduction over the current tumoral volume () does not yield a fixed percentage of the tumor volume. Instead, even in relative sense, the regression in the first half of CRT (∼22% per week) is faster than in the last half (circa 13%/week). A plausible explanation is that the remaining volume is also the most radioresistant part of the tumor, despite fractionation benefits such as reoxygenation. This provides an additional motive for boosting at the end of the treatment. Alternatively, tumor cell kill could be proportionally constant during the entire treatment, with other phenomena, such as a decrease of edema and/or of inflammatory cell infiltration, accounting for the early regression.
The most important limitation of this study is the limited number of patients, which is inherent to the detailed methodology. However, the results were consistent over different patients, and the resulting MRI tumor volume of 32.4% after CRT is in line with the values of 26.7–33.5% described in other articles [Citation21–26]. Due to the limited number of patients no definitive conclusions can be drawn on the predictive potential of the volume regression observed in our study.
Conclusion
The main rectal tumor regression occurs during the CRT course itself, and mostly in the first half, with speed of shrinkage decreasing over the course. This increases the advantage of a boost after the elective fields: boosting the smallest volume possible, which is by definition also the most radioresistant part of the tumor, since it is the remaining portion after the elective fields. A significant PTV reduction of 39% can be reached this way. On the other hand, SIB approaches could benefit from adaptive planning during the course, with a maximum advantage of 21.6% in PTV volume, when calculated over the entire treatment course.
Disclosure statement
No potential conflict of interest was reported by the authors.
Related Research Data
References
- McCarthy K, Pearson K, Fulton R, et al. Pre-operative chemoradiation for non-metastatic locally advanced rectal cancer. Cochrane Database Syst Rev. 2012;12:CD008368.
- Martin S, Heneghan H, Winter D. Systematic review and meta-analysis of outcomes following pathological complete response to neoadjuvant chemoradiotherapy for rectal cancer. Br J Surg. 2012;99:918–928.
- Appelt AL, Pløen J, Harling H, et al. High-dose chemoradiotherapy and watchful waiting for distal rectal cancer: a prospective observational study. Lancet Oncol. 2015;16:919–927.
- Van der Valk M. The International Watch & Wait database (IWWD) for rectal cancer: an update. J Clin Oncol. 2017;35(Suppl. 4):521.
- Overgaard M, Overgaard J, Sell A. Dose-response relationship for radiation therapy of recurrent, residual, and primarily inoperable colorectal cancer. Radiother Oncol. 1984;1:217–225.
- Mohiuddin M, Regine WF, John WJ, et al. Preoperative chemoradiation in fixed distal rectal cancer: dose time factors for pathological complete response. Int J Radiat Oncol Biol Phys. 2000;46:883–888.
- Chan AK, Wong AO, Langevin J, et al. Preoperative chemotherapy and pelvic radiation for tethered or fixed rectal cancer: a phase II dose escalation study. Int J Radiat Oncol Biol Phys. 2000;48:843–856.
- Appelt AL, Pløen J, Vogelius IR, et al. Radiation dose-response model for locally advanced rectal cancer after preoperative chemoradiation therapy. Int J Radiat Oncol Biol Phys. 2013;85:74–80.
- Burbach JPM, den Harder AM, Intven M, et al. Impact of radiotherapy boost on pathological complete response in patients with locally advanced rectal cancer: a systematic review and meta-analysis. Radiother Oncol. 2014;113:1–9.
- Engels B, Tournel K, Everaert H, et al. Phase II study of preoperative helical tomotherapy with a simultaneous integrated boost for rectal cancer. Int J Radiat Oncol. 2012;83:142–148.
- Engels B, Platteaux N, Van Den Begin R, et al. Preoperative intensity-modulated and image-guided radiotherapy with a simultaneous integrated boost in locally advanced rectal cancer: report on late toxicity and outcome. Radiother Oncol. 2014;110:155–159.
- Kim YC, Lim JS, Keum KC, et al. Comparison of diffusion-weighted MRI and MR volumetry in the evaluation of early treatment outcomes after preoperative chemoradiotherapy for locally advanced rectal cancer. J Magn Reson Imaging. 2011;34:570–576.
- Lambrecht M, Vandecaveye V, De Keyzer F, et al. Value of diffusion-weighted magnetic resonance imaging for prediction and early assessment of response to neoadjuvant radiochemotherapy in rectal cancer: preliminary results. Int J Radiat Oncol Biol Phys. 2012;82:863–870.
- Burbach JPM, Kleijnen J-PJ, Reerink O, et al. Inter-observer agreement of MRI-based tumor delineation for preoperative radiotherapy boost in locally advanced rectal cancer. Radiother Oncol. 2016;118:399–407.
- Burbach JM, Verkooijen HM, Intven M, et al. RandomizEd controlled trial for pre-operAtive dose-escaLation BOOST in locally advanced rectal cancer (RECTAL BOOST study): study protocol for a randomized controlled trial. Trials. 2015;16:58.
- Thörnqvist S, Hysing LB, Tuomikoski L, et al. Adaptive radiotherapy strategies for pelvic tumors – a systematic review of clinical implementations. Acta Oncol. 2016;55:943–958.
- Lagendijk JJW, van Vulpen M, Raaymakers BW. The development of the MRI linac system for online MRI-guided radiotherapy: a clinical update. J Intern Med. 2016;280:203–208.
- Withers H. The four R’s of radiotherapy. Adv Radiat Biol. 1975;5:241–271.
- Michalski JM, Gay H, Jackson A, et al. Radiation dose-volume effects in radiation-induced rectal injury. Int J Radiat Oncol Biol Phys. 2010;76(Suppl. 3):S123–S129.
- Liu M, Moiseenko V, Agranovich A, et al. Normal Tissue Complication Probability (NTCP) modeling of late rectal bleeding following external beam radiotherapy for prostate cancer: a test of the QUANTEC-recommended NTCP model. Acta Oncol. 2010;49:1040–1044.
- Yeo S-G, Kim DY, Park JW, et al. Tumor volume reduction rate after preoperative chemoradiotherapy as a prognostic factor in locally advanced rectal cancer. Int J Radiat Oncol Biol Phys. 2012;82:e193–e199.
- Kim YH, Kim DY, Kim TH, et al. Usefulness of magnetic resonance volumetric evaluation in predicting response to preoperative concurrent chemoradiotherapy in patients with resectable rectal cancer. Int J Radiat Oncol Biol Phys. 2005;62:761–768.
- Suzuki T, Sadahiro S, Tanaka A, et al. Relationship between histologic response and the degree of tumor shrinkage after chemoradiotherapy in patients with locally advanced rectal cancer. J Surg Oncol. 2014;109:659–664.
- Lambregts DMJ, Rao S-X, Sassen S, et al. MRI and diffusion-weighted MRI volumetry for identification of complete tumor responders after preoperative chemoradiotherapy in patients with rectal cancer: a bi-institutional validation study. Ann Surg. 2015;262:1034–1039.
- Nougaret S, Rouanet P, Molinari N, et al. MR volumetric measurement of low rectal cancer helps predict tumor response and outcome after combined chemotherapy and radiation therapy. Radiology. 2012;263:409–418.
- Kang JH, Kim YC, Kim H, et al. Tumor volume changes assessed by three-dimensional magnetic resonance volumetry in rectal cancer patients after preoperative chemoradiation: the impact of the volume reduction ratio on the prediction of pathologic complete response. Int J Radiat Oncol Biol Phys. 2010;76:1018–1025.