
Abstract
Objectives: Local recurrence (rec) in lung cancer is associated with poor survival. This study examined whether the pattern of failure is associated with the most PET avid volume in the planning-FDG-PET/CT scan (p-PET/CT).
Methods: 162 consecutive inoperable NSCLC patients (pts) receiving radiotherapy between January 2012 and April 2014 were reviewed. Radiotherapy was delivered in 2 Gy/fraction (5f/week) to a total dose of 60–66 Gy. Pts were followed with CT scans every third month. Patients with local rec as first event were analyzed. For the primary tumor (T) the overlap-fraction (OF) between 50% of SUVpeak on p-PET/CT and the volume of T-rec was calculated: OF = (SUVp50∩T-rec)/min(SUVp50, T-rec). Similarly for the GTV on the p-CT: OF = (GTV∩T-rec)/min(GTV, T-rec). OF was based on a rigid registration between p-PET/CT and rec-CT with PET guided delineation of T- rec. For lymph nodes (LN), the correlation between the location of treated-LN and the location of recurrence-LN was evaluated.
Results: 67 patients developed local rec. 51 pts had rec in T-site, 45 pts in LN-site. Due to anatomical changes, reliable registration between p-CT and rec-CT was only obtained in 26 pts with T-rec. The median OFSUVp50 was 52, 8% [range 26; 100%] and the median OFGTV was 80.5% [19.7; 100%]. Eleven pts had higher OFSUVp50 than OFGTV. LN-rec predominantly occurred in the station 2R (32%), 4R (46%), 7 (46%) and right hilum (36%). Pts with malignant LNs in station 4R or 7 on p-CT had a high risk of rec in these stations; 4R (55%) and 7 (83%).
Conclusions: This study indicates that the most PET active volume on p-PET-CT is a driver for rec at T-site. LN-recurrences predominantly appear in station 2R, 4R, 7 and right hilum. Additional confirmatory studies regarding lymph node mapping and selective lymph node irradiation is needed.
Introduction
Lung cancer remains one of the leading causes of death. About one-quarter of patients (pts) with non-small-cell lung cancer (NSCLC) presents with stage III disease with mediastinal lymph node involvement. Studies from the past several decades and subsequent meta-analyses have established concomitant chemo-radiotherapy (CRT) with 60–66 Gy in 2 Gy per fraction as the standard treatment of stage III NSCLC [Citation1]. Concomitant CRT, as compared with sequential CRT, improved survival of pts with locally advanced NSCLC [Citation2], however local tumor failure is still observed within three years in 70% of these patients [Citation3]. An early identification of pts with a high risk of local treatment failure is important, as these pts may potentially benefit from additional therapy [Citation4], since there is a strong association between loco-regional control and survival in locally advanced NSCLC [Citation5]. Improvements in local tumor control may be achieved by escalating the radiation dose, where local control rates over 90% can be reached for tumor doses of 120 Gy [Citation6] in stage I and II NSCLC patients. While phase I/II dose escalation trials have shown a benefit of increasing the radiation dose to obtain better local control [Citation7,Citation8], the randomized RTOG0617 trial showed a survival detriment in the dose escalated arm. Bradley et al. [Citation9] on multivariate analysis demonstrated that the heart dose was the best explain of worse survival rate in dose escalated arm.
Positron emission tomography (PET) with the tracer 18fluorodeoxyglucose (FDG) has a major impact on the management of NSCLC with radical radiotherapy (RT) [Citation10]. The pre-radiotherapy FDG-PET/CT scan identifies areas of potential concern in the tumor, but it is not yet established whether these areas are responsible for local recurrence. Newer studies have shown that the location of residual FDG-uptake areas after RT corresponds to the high FDG-uptake areas pre-radiotherapy (pre-RT) [Citation11–13], indicating that, a pre-RT FDG-PET/CT scan can be used for RT dose redistribution in order to heterogeneously escalate the dose [Citation12].
The aim of the current study was to examine whether the pattern of failure coincides with a pre-determined PET volume in the pre-therapeutic planning PET/CT. Furthermore, we studied the pattern of failure in lymph nodes in the mediastinum in relation to the pre-therapeutic lymph node location.
Material and methods
Pre-treatment image acquisition
The planning FDG-PET/CT (p-PET/CT) scans were performed at Aarhus University Hospital, using an integrated PET/CT scanner (Philips Big Bore Gemini TF) or a diagnostic PET scanner (Siemens Biograph 64). For the diagnostic PET scanning, only a low dose CT was acquired. The patients were injected intravenously with 18FDG after a fasting period of at least 6 h. The scans were obtained approximately 1 h after 18FDG-injection (5 MBq/kg min. 200 MBq – max. 600 MBq).
The treatment planning CT (p-CT) scan was performed as a time resolved 4D-CT scan with 3 mm slice thickness after injection of intravenous contrast. All p-CT scans were diagnostic CT-scans. The mid-ventilation phase was selected for target and normal tissue delineation.
Target definition
The gross tumor volumes for the primary tumor (GTV-T) and pathological lymph nodes (GTV-N) were delineated on the p-CT scan by a clinical oncologist with the help of a radiologist and a nuclear medicine physician using both lung- and mediastinal-window guided by the visual interpretation of the p-PET/CT scan. Clinical target volumes (CTV-T and CTV-N) were generated by adding a 5 mm isotropic margin to GTV-T and GTV-N and shaping to vessels, bones, and the opposite lung.
Treatment planning, PTV margin and delivery
A treatment plan with four to eight 6 MV beams was created and normalized to give a mean PTV dose equal to 100% of the prescribed dose. Furthermore, the PTV received at least 95% dose while the global maximum was below 107% of the prescribed dose. Dose calculation was done using the AAA algorithm in the Eclipse treatment planning system (Varian Medical Systems). Patients were treated using intensity modulated radiotherapy (IMRT).
Patients treated before April 2013 were set-up using daily bone match on cone-beam CT (CBCT) scans. The remaining patients were set-up using soft tissue match on the primary tumor, accompanied by an adaptive protocol [Citation14]. The PTV margins were based on the set-up strategy: For bone match, the CTV-PTV margin (anterior–posterior, left–right, superior–inferior) was 10, 10 and 13 mm. For tumor match, the CTV-PTV margins were 4, 4, 5 mm and 9, 9, 10 mm for the tumors and the lymph nodes, respectively [Citation14].
Post treatment imaging
All patients were followed with CT scans every three months for the first two years, then every six months the following three years. Thirty patients underwent recurrence PET/CT (rec-PET/CT) scans, when recurrence was suspected. All recurrences were confirmed by a biopsy either from T-site or N-site.
Patient characteristics
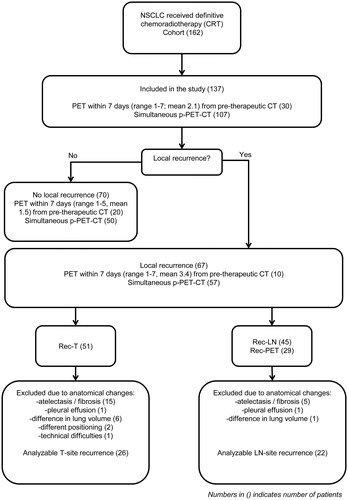
About 162 consecutive patients (pts) with inoperable pathologically proven NSCLC treated in department of oncology, Aarhus University Hospital, receiving definitive radiotherapy, between January 2012 and April 2014 were reviewed. Patients with more than seven days between PET and CT scan were excluded from the study in order to avoid progression between scans at the two modalities. Thus, 137 pts with simultaneous planning-PET-CT (107 pts) or pre-therapeutic-PET (30 pts) within seven days from p-CT (range; 1–7 days, mean; 2.1 days) were included in the further analysis (see ). The majority of patients (127) received chemotherapy with Carboplatin® (AUC 5 every 21st day) or Cisplatin® (70 mg/m2 every 21st day) and Vinorelbine® (60 mg/m2 day 1 and 8). Radiation was given sequentially after 2–3 cycles of induction chemotherapy (23 pts) or as concurrent treatment after first cycle of induction chemotherapy (104 pts).
Figure 1. Selection of patients for analysis of tumor-site recurrence and LN-site recurrence.
Retrospective analysis
Patients with local recurrence as first event were selected for analysis. For all patients with recurrence at T-site, the peak standardized uptake value (SUVpeak) was determined as the average value of SUV in the continuous 1 cm3 with the highest SUV and 50% of SUVpeak (SUVp50) was auto delineated using MIM (MIM Software Inc.).
In patients with p-CT and p-PET obtained at different days, SUVp50 was rigidly transferred to the p-CT based on a tumor match. A rigid registration between the p-CT and the recurrence-CT (rec-CT) was made based on a registration of normal tissue nearby but excluding the tumor, in order to avoid guidance of the registration by the tumor. The rigid registration was validated by visual inspection. Patients with large anatomical changes seen on the recurrence scan were excluded. The tumor recurrence was delineated on the rec-CT guided by the rec-PET if available; otherwise the rec-CT was used.
The overlap fraction (OF) between 50% of SUVpeak (OFSUVp50) on p-CT and the volume of T recurrence (T-rec) was calculated according to Calais et al. [Citation13]:
And similarly for the OFGTV between GTV on p-CT and the volume of T recurrence (T-rec):
In patients with lymph node recurrence, the recurrence was delineated on the rec-CT based on the rec-PET scan. Only patients with rec-PET/CT were included in the analysis. The position of the lymph nodes in the mediastinum as defined according to IASLC lymph node map [Citation15] was scored. For each patient, it was noted if a lymph node station was involved or not.
Statistical analysis
Patients were stratified into two groups, those with or without loco-regional recurrence. The Chi square test was used to compare the distribution of factors between the two groups. Overall survival for the whole group (137 pts) was calculated from the start of radiotherapy using the Kaplan-Meier method. Patients who did not progress were censored at the time of their death or at the last available follow-up.
Results
All 137 included patients received radiotherapy in one daily fraction of 2 Gy (five fractions per week) to a total dose of 60–66 Gy, except two patients; one received only 50 Gy in 25 fractions due to large tumor burden; another patient received only 56 Gy of prescribed 66 Gy according to decline in general condition. Planning target volumes (PTV) ranged from 58 to 1140 cm3 (mean = 417 cm3). Gross tumor volume (GTV) ranged from 1 to 369 cm3 (mean = 85 cm3).
Median follow-up time was 45 months (95%-CI: 42–48). Median progression free survival (PFS) was 16 months (95%-CI: 11–12) and the median overall survival (OS) was 20 months (95%-CI: 15–25) for the whole group see . Clinical characteristics were equally distributed between the two groups with or without loco regional recurrence as presented in . Only tumor histology was significantly related to the rate of loco-regional recurrence (LR), where squamous carcinoma had 60% LR as compared to non-squamous with 42% (p = .04). In the same table, clinical factors were tested for possible influence on overall survival.
Figure 2. Progression free survival (PFS) and overall survival (OS) of patients treated with curative radiotherapy (137 pts).
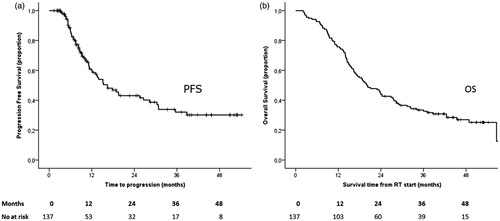
Table 1. Baseline clinical characteristics.
Patients with stage II and IIIA had a significantly better survival of 24 months (95% CI: 16–33) as compared to patients with stage IIIB and IV with a median of 17 months (95% CI: 10–24) (p = .01).
About 67 patients (49%) developed local recurrence as first event, see . 51 (76%) pts had recurrence at the tumor (T)-site. Anatomical changes seen at rec-CT at or nearby the T-site (such as atelectasis and/fibrosis (15), pleural effusion (1), difference in lung volumes (6), difference in position of arms (2) and one with technical difficulties) made the registration between p-CT and rec-CT unreliable for 25 patients, who therefore were excluded, (see Figure S6 for examples of anatomical changes). A reliable registration was obtained in 26 patients with T-site recurrence. All recurrences at the T-site appeared within the PTV area.
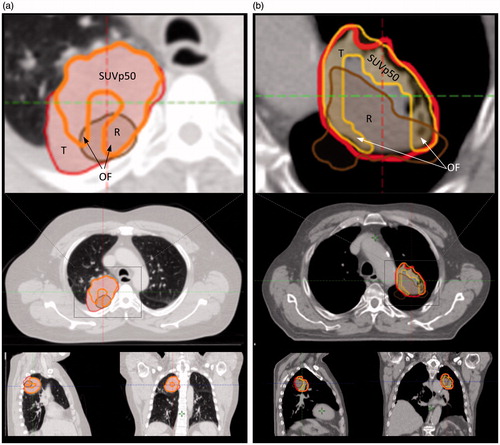
In , examples of SUVp50, GTV and rec-T delineation are shown. The median OFSUVp50 was 52.8% [26; 100%] and the median OFGTV was 80.5% [19.7; 100%]. In eleven patients, OFSUVp50 was higher than OFGTV, and in one patient both OFs were 100%. Three patients had a donut shaped SUVp50, resulting in OFSUVp50 values below 40%, as the recurrence volume in the central part of the GTV was located in the necrotic part of the tumor, see .
Figure 3. Two cases showing overlap between recurrence (rec) tumor (R, brown), SUVp50 (orange) and GTV-tumor (T, red) on planning-CT (p-CT). The p-CT and rec-CT were rigidly registered. The structures are shown on p-CT. (a) p-CT is represented in lung window showing T, SUVp50, R and the overlap fraction (OF) area. (b) p-CT representing a case with a donut shaped SUVp50 area resulting in low OFSUVp50 as tumor (GTV-T) was characterized necrotic in central part. Gross tumor volumes = red lines; recurrence tumor = brown lines, rigid registered on p-CT (left columns).
Forty five patients (67%) had rec-LN. Only patients with rec-PET/CT were included in the analysis of lymph node recurrence to secure identical imaging data for all patients. A rec-PET/CT was available in 22 patients and used to identify LN recurrences (). The anatomical location of involved mediastinal lymph nodes at recurrence and pattern of failure for all 22 patients are shown in Figure S5. Thirteen patients (59%) had recurrence at the same LN station location as before treatment. Ten of these patients had visually overlap of involved LN at rec-PET/CT and p-PET/CT. In three patients, the LN overlap assessment was not reliable due to extreme fibrosis and dislocation of mediastinum. Overlap was observed for 21 LNs in total. Eleven of these LNs had a volume on p-CT less than 4 cm3 and ten LNs were larger than 4 cm3. Thus, no difference was seen in the recurrence pattern of small and larger LNs.
Overlap between treated LN stations and stations with recurrence was predominantly seen in station 4R (55%) and 7 (83%), as observed in p-PET/CT and rec-PET/CT. Considering all LN-site recurrences, they frequently occurred at LN station 2R (32%), 4R (46%), 7 (46%) and right hilum (36%). Out-field recurrences in LN stations were not correlated to the site of the primary tumor, as recurrences in both left and right sided LN stations were seen for the majority of the patients with LN recurrence in stations, which was not seen on p-CT (see Figure S5). Only exception was LN recurrence in station 5 which only occurred in patients with left sided tumors. LN recurrences appeared both inside and outside the PTV area. The LNs, which appeared outside the PTV area, were neither enlarged nor had PET/CT activities in the p-PET/CT and thus, were not included in the primary target delineation.
Twenty nine patients (43%) had recurrences in both T- and LN-sites. Twenty seven (40%) of 67 patients with local recurrences also had distant metastases. Pattern of local recurrences and distant metastasis for all patients are shown in Figure S4.
Discussion
Treatment of NSCLC is associated with a high rate of local failure. In this study, we examined whether the local failure at tumor site coincided with the most PET avid volume in the p-PET/CT. We found that local recurrences at tumor site in NSCLC, after definitive CRT, overlapped with the area with highest FDG-PET activity in the pre-therapeutic scan with a median overlap fraction of 52.8%. The median OFSUVp50 was lower than the OFGTV. However in 11 of 26 patients, OFSUVp50 was higher than OFGTV, indicating that the most PET avid volumes may be a driver for the development of recurrences, but the study is not conclusive as the number of patients applicable for the analysis is low in spite of the rather high number of patients included in the study. This is due to many patients experiencing large anatomical deformations during or after radiotherapy of the thorax, making image registration untrustworthy. The recurrence volume is highly dependent on the frequency of the follow-up scans. In this study, follow-up scans were acquired every three months for the first two years, which ensured early detection of recurrences. In 14 patients, OFGTV was higher than OFSUVp50. This is presumably due to the volume of GTV being larger than the SUVp50 volume which thereby increases the overlap ratio between recurrence and GTV.
The location of the PET avid volumes has been shown to be stable during the first part of the radiotherapy treatment course [Citation16] and patients with persistent FDG uptake after high-dose radiotherapy had worse survival compared to those without FDG uptake [Citation11]. In a prospective study by Calais et al. the initial staging FDG-PET scan was compared to three PET scans done before, during and after treatment [Citation13]. It was found that areas of high FDG-PET uptake on the pre-therapeutic planning PET/CT scan identified tumor sub-volumes with residual FDG activity after RT [Citation11–13,Citation16,Citation17], implying that FDG-based dose escalation could be beneficial. The indications of correlation between T-site recurrence and pretreatment PET avid volumes supports the findings based on FDG uptake post treatment.
Several studies investigate whether dose-escalation with focus on the PET active area could be an improvement strategy in treatment of locally advanced NSCLC. A feasibility study by Moeller et al. [Citation18] showed that dose-escalation to the PET avid area of lung tumors respecting normal tissue constraints was feasible in a series of unselected patients including cases with relatively large tumors. According to this and similar results [Citation19–21] DOLG (Danish Oncology Lung cancer Group) has initiated a randomized phase III study (NCT02354274), where a heterogeneously dose escalation driven by the most PET active areas of the tumor is investigated. RTOG among other has initiated a phase II trial (1106/ACRIN 6697) assessing the efficacy and safety of selective metabolically adaptive radiation dose escalation in locally advanced NSCLC receiving definitive chemoradiotherapy. The ongoing randomized phase II European PET-Boost trial in NSCLC (NCT01024829) studies dose-escalation with integrated boost to entire or part of primary tumor defined from >50% of SUVmax. Preliminary results of this study by van Elmpt W. and colleges showed, that dose escalation using an integrated PET-boost could be achieved at the primary tumor or high FDG uptake areas with respect to normal tissue constraints [Citation21].
A study by Domachevsky et al. [Citation22] showed that PET/CT shortly after definitive radiotherapy is known to identify false positive recurrences, as increased FDG-PET uptake can be seen in radiation pneumonitis. In the current study, all recurrences were verified by biopsy from region of interest or LN-site to eliminate the potential risk of false positive recurrences.
Lymph nodes recurrences appeared both inside and outside the PTV area. This pattern of failure in lymph nodes is consistent with the finding in other studies [Citation23,Citation24]. We found that LN-site recurrences frequently occurred in the station 2R (32%), 4R (46%), 7 (46%) and the right hilum (36%). Additionally, a high rate of recurrence in treated lymph nodes observed on p-PET/CT was found for nodes in station 4R (55%) and 7 (83%). Billiet et al. [Citation25] studied the role of post-operative RT (PORT) in decreasing local relapses. They showed that local relapse in the contralateral mediastinal lymph nodes and station 7 occurred frequently in left-sided primary tumor. In this study, we found that the LN recurrences mostly appeared in the right side of the mediastinum and in station 7 without any correlation to tumor laterality as 55% of the patients with LN-site recurrences had right-sided tumors and one patient (5%) only had N2 disease. The mentioned lymph node recurrence pattern could be explained by the availability of station 4R and 7 for biopsies at the time of recurrence. But as lymph node recurrences in our study were delineated consistently using rec-PET/CT, the availability for biopsies is not the plausible explanation. The drainage paths to lymph nodes show considerable variation [Citation26] and can explain some of these findings. The pattern of LN failure found in the current study is interesting and calls for intensifying pre-therapeutic lymph node mapping and investigating selective radiotherapy of lymph node stations.
In conclusion, this study indicates that the most PET avid volume on planning-PET-CT is a possible driver for recurrence at T-site in agreement with former findings. Further randomized phase III dose escalation studies are needed to consolidate the finding that the SUVp50 area coincides with recurrence at tumor site.
Lymph node recurrences predominantly appeared in station 2R, 4R, 7 and the right hilum. LN-recurrence in station 5 occurred only in patients with left-sided primary tumors. Patients with malignant LNs in station 4R or 7 on planning-CT had a high risk of recurrence in these stations; 4R (55%) and 7 (83%).
M._Kandi_et_al._Supplemental_material.pdf
Download PDF (547.6 KB)Disclosure statement
The authors report no conflicts of interest.
Related Research Data
References
- Price A. Emerging developments of chemoradiotherapy in stage III NSCLC. Nat Rev Clin Oncol. 2012;9:591–598.
- Aupérin A, Le Péchoux C, Rolland E, et al. Meta-analysis of concomitant versus sequential radiochemotherapy in locally advanced non-small-cell lung cancer. J Clin Oncol. 2010;28:2181–2190.
- Furuse K, Fukuoka M, Kawahara M, et al. Phase III study of concurrent versus sequential thoracic radiotherapy in combination with mitomycin, vindesine, and cisplatin in unresectable stage III non-small-cell lung cancer. J Clin Oncol. 1999;17:2692–2699.
- Velazquez ER, Aerts HJ, Oberije C, et al. Prediction of residual metabolic activity after treatment in NSCLC patients. Acta Oncol. 2010;49:1033–1039.
- Machtay M, Paulus R, Moughan J, et al. Defining local-regional control and its importance in locally advanced non-small cell lung carcinoma. J Thorac Oncol. 2012;7:716–722.
- McGarry RC. Integrating stereotactic body radiation therapy in stage II/III non-small cell lung cancer: is local control important? Expert Rev Anticancer Ther. 2014;14:1419–1427.
- Kong FM, Ten Haken RK, Schipper MJ, et al. High-dose radiation improved local tumor control and overall survival in patients with inoperable/unresectable non-small-cell lung cancer: long-term results of a radiation dose escalation study. Int J Radiat Oncol Biol Phys. 2005;63:324–333.
- Belderbos JS, Heemsbergen WD, De Jaeger K, et al. Final results of a Phase I/II dose escalation trial in non-small-cell lung cancer using three-dimensional conformal radiotherapy. Int J Radiat Oncol Biol Phys. 2006;66:126–134.
- Bradley JD, Paulus R, Komaki R, et al. Standard-dose versus high-dose conformal radiotherapy with concurrent and consolidation carboplatin plus paclitaxel with or without cetuximab for patients with stage IIIA or IIIB non-small-cell lung cancer (RTOG 0617): a randomised, two-by-two factorial phase 3 study. Lancet Oncol. 2015;16:187–199.
- Mac Manus MP, Everitt S, Bayne M, et al. The use of fused PET/CT images for patient selection and radical radiotherapy target volume definition in patients with non-small cell lung cancer: results of a prospective study with mature survival data. Radiother Oncol. 2013;106:292–298.
- Aerts HJ, van Baardwijk AA, Petit SF, et al. Identification of residual metabolic-active areas within individual NSCLC tumours using a pre-radiotherapy (18)Fluorodeoxyglucose-PET-CT scan. Radiother Oncol. 2009;91:386–392.
- Aerts HJ, Bussink J, Oyen WJ, et al. Identification of residual metabolic-active areas within NSCLC tumours using a pre-radiotherapy FDG-PET-CT scan: a prospective validation. Lung Cancer. 2012;75:73–76.
- Calais J, Thureau S, Dubray B, et al. Areas of high 18F-FDG uptake on preradiotherapy PET/CT identify preferential sites of local relapse after chemoradiotherapy for non-small cell lung cancer. J Nucl Med. 2015;56:196–203.
- Møller DS, Holt MI, Alber M, et al. Adaptive radiotherapy for advanced lung cancer ensures target coverage and decreases lung dose. Radiother Oncol. 2016;121:32–38.
- El-Sherief AH, Lau CT, Wu CC, et al. International association for the study of lung cancer (IASLC) lymph node map: radiologic review with CT illustration. Radiographics. 2014;34:1680–1691.
- Aerts HJ, Bosmans G, van Baardwijk AA, et al. Stability of 18F-deoxyglucose uptake locations within tumor during radiotherapy for NSCLC: a prospective study. Int J Radiat Oncol Biol Phys. 2008;71:1402–1407.
- Petit SF, Aerts HJ, van Loon JG, et al. Metabolic control probability in tumour subvolumes or how to guide tumour dose redistribution in non-small cell lung cancer (NSCLC): an exploratory clinical study. Radiother Oncol. 2009;91:393–398.
- Moeller DS, Khalil AA, Knap MM, et al. A planning study of radiotherapy dose escalation of PET-active tumour volumes in non-small cell lung cancer patients. Acta Oncol. 2011;50:883–888.
- Nielsen TB, Hansen O, Schytte T, et al. Four-dimensional dose evaluation of inhomogeneous dose distributions planned for non-small cell lung cancer patients with lymph node involvement. Acta Oncol. 2014;53:707–712.
- Feng M, Kong FM, Gross M, et al. Using fluorodeoxyglucose positron emission tomography to assess tumor volume during radiotherapy for non-small-cell lung cancer and its potential impact on adaptive dose escalation and normal tissue sparing. Int J Radiat Oncol Biol Phys. 2009;73:1228–1234.
- van Elmpt W, De Ruysscher D, van der Salm A, et al. The PET-boost randomised phase II dose-escalation trial in non-small cell lung cancer. Radiother Oncol. 2012;104:67–71.
- Domachevsky L, Jacene HA, Sakellis CG, et al. Postradiation changes in tissues: evaluation by imaging studies with emphasis on fluorodeoxyglucose-PET/computed tomography and correlation with histopathologic findings. PET Clin. 2014;9:217–235.
- Moreno-Jiménez M, Aristu J, López-Picazo JM, et al. Dosimetric analysis of the patterns of local failure observed in patients with locally advanced non-small cell lung cancer treated with neoadjuvant chemotherapy and concurrent conformal (3D-CRT) chemoradiation. Radiother Oncol. 2008;88:342–350.
- Schytte T, Nielsen TB, Brink C, et al. Pattern of loco-regional failure after definitive radiotherapy for non-small cell lung cancer. Acta Oncol. 2014;53:336–341.
- Billiet C, De Ruysscher D, Peeters S, et al. Patterns of locoregional relapses in patients with contemporarily staged stage III-N2 NSCLC treated with induction chemotherapy and resection: implications for postoperative radiotherapy target volumes. J Thorac Oncol. 2016;11:1538–1549.
- Topol M, Masłoń A. Some variations in lymphatic drainage of selected bronchopulmonary segments in human lungs. Ann Anat. 2009;191:568–574.