
Abstract
Background: Gleason scores for prostate cancer correlates with an increased recurrence risk after radiotherapy (RT). Furthermore, higher Gleason scores correlates with decreasing apparent diffusion coefficient (ADC) data from diffusion weighted MRI (DWI-MRI). Based on these observations, we present a formalism for dose painting prescriptions of prostate volumes based on ADC images mapped to Gleason score driven dose-responses.
Methods: The Gleason score driven dose-responses were derived from a learning data set consisting of pre-RT biopsy data and post-RT outcomes for 122 patients treated with a homogeneous dose to the prostate. For a test data set of 18 prostate cancer patients with pre-RT ADC images, we mapped the ADC data to the Gleason driven dose-responses by using probability distributions constructed from published Gleason score correlations with ADC data. We used the Gleason driven dose-responses to optimize dose painting prescriptions that maximize the tumor control probability (TCP) with equal average dose as for the learning sets homogeneous treatment dose.
Results: The dose painting prescriptions increased the estimated TCP compared to the homogeneous dose by 0–51% for the learning set and by 4–30% for the test set. The potential for individual TCP gains with dose painting correlated with increasing Gleason score spread and larger prostate volumes. The TCP gains were also found to be larger for patients with a low expected TCP for the homogeneous dose prescription.
Conclusions: We have from retrospective treatment data demonstrated a formalism that yield ADC driven dose painting prescriptions for prostate volumes that potentially can yield significant TCP increases without increasing dose burdens as compared to a homogeneous treatment dose. This motivates further development of the approach to consider more accurate ADC to Gleason mappings, issues with delivery robustness of heterogeneous dose distributions, and patient selection criteria for design of clinical trials.
Introduction
The main objective in radiotherapy (RT) of cancer is to prescribe and deliver doses to the tumor target volume that yield a sufficient tradeoff between achieving a high tumor control probability (TCP) with an acceptable normal tissue complication probability (NTCP). Several studies demonstrate that dose escalation to the prostate volume decrease the post-RT risk for biochemical recurrences (BCR) [Citation1–4]. However, homogeneous dose escalations come with the expense of also increasing the NTCP. To overcome such problems ‘dose painting’ has been proposed [Citation5], a concept that explore the use of functional imaging for dose-response differentiation to yield individually optimized dose prescriptions that increase the TCP to NTCP ratio.
A spatially varying factor that yields important prognostic information for prostate cancer is the Gleason score. It is determined from biopsy samples of prostate cancer tissue, where increasing Gleason scores correlate with an increased BCR risk both after RT and prostatectomy [Citation6–9]. Ghobadi et al. [Citation10] explored the use of Gleason scores determined from prostatectomy specimens as a basis to differentiate dose-responses for individual patients. They found through implementing the observed Gleason scores in the linear-quadratic model, that dose differentiations up to 10 Gy could be achieved for individual prostate volumes without compromising the TCP compared to homogeneous dose treatments. Furthermore, it has been shown that increasing Gleason scores correlate with decreasing apparent diffusion coefficients (ADC) from diffusion weighted MRI (DWI-MRI) [Citation11–17]. The study from Casares-Magaz et al. [Citation18] used ADC images of prostate cancers to estimate individual TCP levels. They translated ADC data into varying cell densities which implemented into the linear-quadratic model yielded significant differentiations in TCP estimations as compared to assuming homogeneous cell densities. However, the approach from Casares-Magaz et al. [Citation18] did not explore the correlation of ADC with Gleason scores, and hence, how Gleason scores would by means of the linear-quadratic model affect the resulting TCP differentiations.
The FLAME trial [Citation19] is an example that tests the use of image driven dose differentiation for prostate cancer. They used multiparametric MRI to determine primary tumor regions which for 35 fractions were treated with a boost dose of 95 Gy and with 77 Gy to the rest of the prostate volumes. The final results of the FLAME trial [Citation19] are yet to be concluded, since long follow-up times are needed to acquire the treatments results of the included patients. In a review, Bentzen and Grégoire [Citation20] stated that dose painting prescriptions ideally should be based on empirically observed dose-responses correlated to pretreatment image data. Such observation driven approaches have been presented by Vogelius et al. and Grönlund et al. [Citation21,Citation22]. In both these studies, pre-RT FDG-PET/CT image data were related to observed post-RT dose-responses, which yielded dose-response driven dose painting prescriptions that indicated significant TCP increases for patients with head and neck cancer as compared to homogeneous dose prescriptions.
In this study, we combine the ideas presented by Ghobadi et al. [Citation10] and Casares-Magaz et al. [Citation18] to design a formalism for Gleason score driven dose painting prescriptions that can be acquired from ADC images correlating with Gleason scores [Citation11–17]. The aim is to present a formalism for dose painting prescriptions of prostate volumes by means of mapping ADC image data to Gleason driven dose-responses determined from retrospectively observed follow-up data.
Material and methods
In this study, dose painting prescriptions on a voxel level (i.e., dose painting by numbers [Citation23]) were optimized by redistributing a conventional RT homogeneous dose so that individual TCP levels were maximized. The optimization process was driven by voxel specific dose-response functions derived from retrospectively observed pre-RT Gleason scores and post-RT outcomes from a learning data set of patients treated with a homogeneous dose to the prostate. To enable the ADC driven dose painting optimization, we translated ADC data to the Gleason driven dose-responses by means of published correlations between Gleason scores and ADC data. As end-point for TCP, we used freedom from BCR at 5 years post-RT.
We used two different sets of patient data, a learning set to derive Gleason score driven dose-response functions, and a test set with ADC images to test the formalism of acquiring image driven dose painting prescriptions. Both these sets of patient data are described below, followed by the derivation of Gleason driven dose response functions and the methodology for mapping ADC values into Gleason scores. Finally, we describe the optimization to achieve the dose painting prescriptions.
Learning set from retrospective treatment data
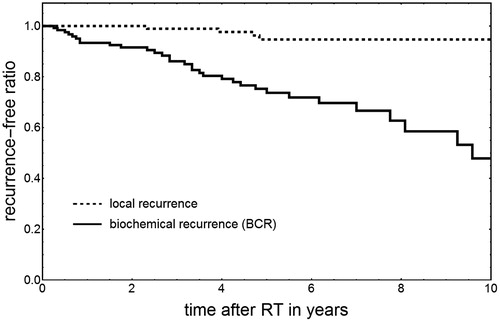
The learning data set consisted of pre-RT Gleason scores and post-RT outcomes from 122 high-risk patients (risk criteria according to NCCN guidelines [Citation24]), treated between 2002 and 2015 at Uppsala University hospital (Uppsala board ethical approval reference number 2009/229). Patients with PSA >60 ug/l were not included to decrease the risk for pre-RT spread to confound the outcome. The patients were treated with dose-escalated RT as described by Johansson et al. [Citation25], where all patients were treated with a proton boost 5 Gy × 4 fractions to the prostate volume (CTVT) only, followed by external X-ray RT 2 Gy × 25 fractions to both the CTVT and lymph node regions. With RBE=1.1 for protons and α/β=1.93 Gy [Citation26] this yield the homogeneous CTVT treatment dose Dh=91.6 Gy EQD2. All patients underwent androgen deprivation therapy. The follow-up time ranged between 6 and 157 months where the time to a BCR varied between 2 and 114 months, and the time to a local recurrence 27–58 months. In total, 32 patients got a BCR and four a verified local recurrence. To determine the TCP of the learning set with the 5 year freedom from a BCR as end-point, we used the Kaplan–Meier product limit estimator and acquired TCPBCR=74% (see ). From these data, we parameterized the TCP of the learning set population (index ‘ls’) with the logistic function [Citation27] as
(1)
where γ50,ls was set to 2.01 according to Dasu et al. [Citation28], and D50,ls set to 80.6 Gy, so that TCPls at the dose D=Dh equals the observed TCPBCR=7%.
Figure 1. Kaplan–Meier plot for the learning set, showing the local recurrence-free and biochemical recurrence-free ratios vs. time after RT.
Test set with ADC images of prostate cancer
To test ADC driven dose painting, we used image data from 18 high-risk prostate cancer patients (same risk criteria as for the learning set [Citation24]) that had underwent diffusion weighted MR-imaging at Umeå University hospital. The used images were acquired both before RT and androgen deprivation therapy, to decrease the risk for hormonal effects on the prostate tissue and hence influence the ADC images. For some patients, the ADC images were acquired with a 1.5 Tesla MRI camera from Siemens, where the ADC image data were resolved with three values of the diffusion weighting parameter (‘b-value’), 0, 160 and 800 s̸mm2, and with voxel size of 1.63 × 1.63 × 3.60 mm3. For the remaining patients a 3.0 Tesla PET/MRI camera from GE Healthcare was used, with two b-values of 200 and 800 s̸mm2 and voxel size of 0.94 × 0.94 × 4.00 mm3. To have equal voxel sizes for all ADC images, we resampled them by trilinear interpolation into sizes of 3.00 × 3.00 × 3.00 mm3. These 18 patients constituted a subset of the patients included in the PARAPLY study (ClinicalTrials.gov Identifier NCT01962324) where patients with more than 15% risk of lymph node metastasis were treated to the prostate, seminal vesicles and pelvic lymph nodes (Umeå board ethical approval reference numbers 2013/154-31 and 2015/75-32).
Derivation of Gleason score driven dose response functions from the learning set
We used the pre-RT biopsy records of the learning set patients to construct virtual prostate volumes with Gleason scores voxelized into a grid of voxels sized 3.00 × 3.00 × 3.00 mm3. For this voxelization, we assumed that the taken biopsy samples were unbiased regarding the volumetric presence of Gleason scores within the prostate. Hence, we used the relative frequencies of Gleason scores for the dose-response derivation without using specified localizations of the Gleason scores. A detailed description is given in the Supplementary material, where we also describe a robustness test of the final dose painting prescriptions regarding possible biases in biopsy sample localization.
To derive dose-response functions driven by voxelized Gleason scores G, we assumed for the homogeneous dose Dh=91.6 Gy a constant voxel specific TCP level b for G≤6 that for G>6 decrease by a linear gradient m giving
(2)
This formulation was motivated by that the new Gleason scoring consensus grades all G≤6 into the same risk category [Citation29,Citation30], and that higher Gleason scores simply correlate to faster recurrence progressions [Citation6,Citation7,Citation9]. The values for b and m were determined from the voxelized Gleason scores of the learning data set, such that the tumor control of the learnings set TCPBCR was reconstructed (see Supplementary material for details).
The assumed voxel specific TCP variation (EquationEquation (2)(2) ) is only valid at the dose Dh. To extend the dose-responses to any dose level (as in our earlier study [Citation22]), we used the logistic sigmoidal function as
(3)
where D and G is voxel specific dose and Gleason score, respectively. Moreover, γ50 was set constant as suggested by Vogelius et al. [Citation21] and in accordance with our previous work [Citation22], and D50(G) was set as a G dependent parameter. To determine γ50 and D50(G) we assumed that tumor voxels comprising a patient’s prostate (CTVT) respond independently of each other, i.e., the TCP for a patient is given by
(4)
and then required two conditions to be fulfilled for the homogeneous dose Dh=91.6 Gy. First, that the patient specific TCP (calculated with EquationEquation (4)
(4) ) averaged over all learning set patients equals the observed TCPBCR=74%. Second, that the tumor control gradient (i.e., the dose derivative of EquationEquation (4)
(4) ) averaged over all learning set patients equals the dose-response gradient of the whole learning set population (given by the dose derivative of EquationEquation (1)
(1) ). These two requirements yielded the determination of γ50 and D50(G) as
(5)
and
(6)
where N is the number of learning set patients, TCPvox(Dh,G) the assumed TCP variation at the homogeneous dose Dh=91.6 Gy (EquationEquation (2)
(2) ), and
the dose-response derivative for the learning set population at Dh=91.6 Gy (acquired by the dose derivative of EquationEquation (1)
(1) ). See the Supplementary material for further details.
Translation of ADC images to Gleason score driven dose-response functions
Decreasing ADC values are found to correlate with increasing Gleason scores G [Citation11–17]. However, while these observations correlate G with ADC, we instead need the mapping of ADC to G. However, a direct one-to-one translation of ADC-to-G would ignore the inherent uncertainties described for the correlations of G with ADC. Hence, based on the uncertainty ranges given by Turkbey et al. [Citation11], we constructed a probability density function (PDF) for each G from 6 to 10 that described the related distribution of ADC. For this construction, we used lognormal distributions as these both restrict to positive ADC, and allow for variable skewness (see Left). For G < 6 explicit data was lacking and hence the distribution for G=6 were duplicated. The required mapping of ADC to G was achieved through renormalizing the constructed PDFs which yielded the conditional probability map P(G|ADC) that fulfills
(7)
for any ADC value. Hence, the thus renormalized map (see Right) gives the Gleason score probability distribution for any given ADC. For very low ADC values, a low-level background was added so that low ADC yielded the probability of 0.95 for G=10 and 0.05 for G≤6. Small regions of high Gleason scores, resulting from ADC image noise, were removed through an image erosion operation with a spherical kernel of radius 0.45 cm. The kernel size was chosen so the overall Gleason score distribution for the whole test set became similar to the observed Gleason score distribution of the learning set. Finally, the voxel specific ADC driven dose-response functions is expressed as the (geometric) average over the corresponding distribution of G as
(8)
where we inherently assumed the TCP for voxels to be composed of independent sub compartments of different G.
Figure 2. (Left) The lognormal probability distributions over ADC for different G constructed as linear fits of the upper and lower quartile range data given by Turkbey et al. [Citation11]. (Right) The final renormalized conditional probability map used to translate ADC values to probabilities of G. Any specific ADC value on the horizontal axis gives a probability distribution of G along the vertical axis, with increasing probabilities indicated by increasing whiteness.
![Figure 2. (Left) The lognormal probability distributions over ADC for different G constructed as linear fits of the upper and lower quartile range data given by Turkbey et al. [Citation11]. (Right) The final renormalized conditional probability map used to translate ADC values to probabilities of G. Any specific ADC value on the horizontal axis gives a probability distribution of G along the vertical axis, with increasing probabilities indicated by increasing whiteness.](/cms/asset/6b7acc17-e0ee-4430-a2e8-e336789b9ad2/ionc_a_1415457_f0002_c.jpg)
Dose painting optimization
To acquire dose painting prescriptions on a voxel basis we maximized the TCP product for individual patients (with EquationEquation (4)(4) ). However, to avoid excessively high doses, we constrained the average dose over each CTVT to equal the learning sets homogeneous treatment dose Dh=91.6 Gy. For the learning set patients, we did not have ADC images and hence dose optimized with the derived Gleason driven dose-response functions (from EquationEquation (3)
(3) ). Moreover, for the test set patients we used the ADC driven dose response functions (acquired with EquationEquation (8)
(8) ) for dose optimization. The optimization was performed with a Lagrange optimization procedure as described by Ebert and Hoban [Citation31], which we implemented into Mathematica® version 10.0 (Wolfram Research, Champaign, IL, USA, 2014).
Results
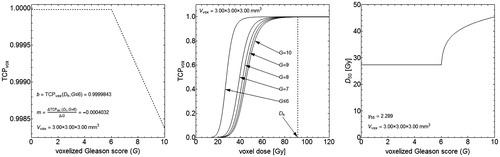
We derived the Gleason driven dose-response functions from the voxelized (3 × 3 × 3 mm3) Gleason scores G of the learning set and the assumed linear TCP variation for different G at the treatment dose Dh=91.6 Gy (given by EquationEquation (2)(2) and shown in Left). For this TCP variation, the value of b for G≤6 and the linear gradient m for G>6 were determined so that the TCP averaged over all learning set patients equaled the observed TCPBCR=74% yielding b = 0.9999843 and m= −0.0004032 ( Left). Furthermore, the derived dose-response functions demonstrated an increasing radio-resistance with increasing G ( Middle), which was a result from the D50 parameter that depended on varying G (given by EquationEquation (6)
(6) and shown in Right). The constant γ50 parameter for the dose-response functions (given by EquationEquation (5)
(5) and shown in Right) equaled 2.289.
Figure 3. Response data derived for a voxel size of 3 × 3×3 mm3 with the endpoint of 5 year freedom from biochemical recurrence. (Left) The voxel specific TCP variation at Dh=91.6 Gy as a function of G with the values for b and m explicitly shown. (Middle) The voxel specific TCP responses as functions of dose for different G. The TCP variation shown in the left panel corresponds with the dose-responses at the dotted line at Dh=91.6 Gy, where the multiplication of many numbers close to unity yields the final TCP per patient (as in CitationEquation (4)). (Right) D50 as a function of G (determined from CitationEquation (6)) with the value for γ50 also shown (determined from CitationEquation (5)).
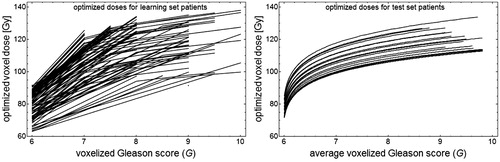
With the homogeneous dose prescription Dh, the calculated TCP per patient of the learning set ranged between 8 and 99% with the average 74%, and for the test set between 36 and 92% with the average 69%. Furthermore, by using the derived dose-response functions for dose optimization we acquired voxel specific dose levels that for both the patients of the learning and the test set increased with increasing values of G ().
Figure 4. (Left) Optimized dose painting prescriptions vs. voxelized G where each line represents the result for a learning set patient. (Right) Optimized dose painting prescriptions vs. the average value of voxelized G translated from ADC images of each test set patient represented by a line. Both cases are based on the constraint of equal average dose as for a homogeneous CTVT dose of Dh=91.6 Gy.
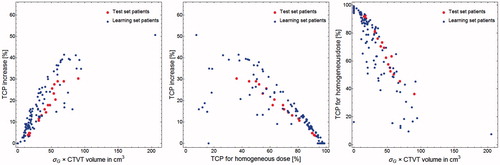
The optimized dose painting prescriptions yielded TCP increases vs. the homogeneous dose prescription with Dh that varied between 0 and 51% for the learning set patients and between 4 and 30% for the test set patients ( Left). The average TCP increase for the learning set was 13% for the learning set, and 17% for the test set. It was also found that the potential for individual TCP increases correlates well with the product of the CTVT volumes by the Gleason score spread ( Left). The patients with the worst prognosis with low expected TCP for the homogeneous dose prescription had a higher potential for TCP increases with the dose painting prescriptions ( Middle). Also, the product of the CTVT volumes by the Gleason score spread correlates with a decreasing TCP prediction for the homogeneous dose prescription with Dh ( Right).
Figure 5. (Left) The potential for TCP increases per patient resulting from the optimized dose painting prescriptions vs. the standard deviation of voxelized G multiplied by the prostate volumes (CTVT). (Middle) The potential for TCP increases per patient by the dose painting prescriptions vs. the TCP for the homogeneous CTVT dose Dh=91.6 Gy. (Right) The TCP per patient with a homogeneous dose prescription of Dh=91.6 Gy vs. the standard deviation of voxelized G multiplied by the CTVT volumes.
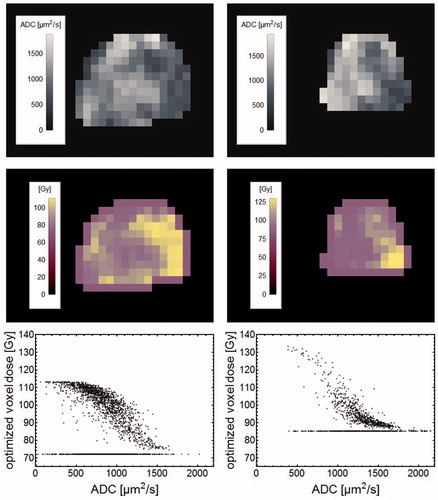
For the dose painting prescriptions of the test set patients, it was found that regions with lower ADC values acquired higher doses and vice versa. This is demonstrated (in ) for centrally located prostate sections of the two tests set patients with the lowest and highest TCP increases, 4 and 30%.
Figure 6. The left column show data for the test set patient with the highest TCP increase (30%), while the right column show data for the patient with the lowest TCP increase (4%). For respective patient, uppermost panels show ADC images of a central section through the prostate with the corresponding dose painting prescriptions shown in the middle row. The lowermost row shows optimized voxel doses vs. ADC for the CTVT voxels. ADC voxels with the minimum dose represent solitary voxels treated as noise through the erosion operation.
Discussion
Our study is based on the assumption that Gleason scores can form a basis for dose painting prescriptions of prostate volumes, which is substantiated with observations that higher Gleason scores increases the post-RT risk for a BCR [Citation6,Citation9], and that higher doses decrease tumor cell survival. We used the 5 year freedom from BCR as tumor control endpoint; however, it is likely that a few patients of the learning set had some pre-RT micro spread that would result in a BCR independent of the dose given to the prostate. This is not taken into consideration in the dose-response derivation, which else would reduce the dose sensitivity with a less inclined gradient m (see EquationEquation (2)(2) and ). Furthermore, (as shown in ) the TCP levels for voxelized Gleason scores at the dose Dh are close to unity, which is a result of the small voxel volume. The TCP values for voxels comprising a target volume needs be multiplied (as in EquationEquation (4)
(4) ), which hence as expected results in a lower TCP for a whole target volume. We chose to use a voxel size of 3 × 3×3 mm3, since this size often is used in dose grids for dose calculations in treatment planning systems.
Our dose-response derivation was based on the logistic dose-response function. This function is parameterized with the γ50 and D50(G) parameters (determined by EquationEquations (5–6)) that not bring mechanistic interpretations about the dose-response of cell survival. By instead implementing, e.g., a Poisson statistics based dose-response function as in Ghobadi et al. and Casares-Magaz et al. [Citation10,Citation18], mechanistic interpretations linking to the linear-quadratic model with respect to Gleason dependent dose-responses would be possible. However, we pragmatically chose the same non-mechanistic dose-response function as in our earlier study [Citation22] and did not further explore any particular mechanisms for Gleason dependent dose-responses.
The dose-response functions were derived from G values voxelized with the biopsy data of the learning set patients. Potential biases regarding the biopsy sample locations, such as avoidance of the central region to protect the less cancerous urethra, could for the prostate volumes result in a voxel distribution biased toward higher G values. We tested this potential bias in voxelization of G values (described in the Supplementary material) by replacing high G values with zero samples. From this test we found that the remaining high G values represented a worse voxel specific TCP prediction since the dose-response assumption (given by EquationEquation (2)(2) ) still needed to reconstruct the observed TCPBCR of the learning set. However, for both routes to voxelize G values we found the optimized dose painting prescriptions to be very similar due to the average dose constraint for dose optimization. Hence, dose-response uncertainties resulting from potential voxelization biases of G values will have minimal impact on the resulting dose painting prescriptions, but rather translate into uncertainties regarding the prediction of absolute TCP values.
The ADC images of the test set were acquired with different MRI scanners as compared to the scanner used by Turkbey et al. [Citation11], and may hence not be not fully comparable with the ADC data presented by Turkbey et al. [Citation11]. This potential bias will lead to similar differences in TCP predictions as biases in sampling of G, but with small impact on the resulting dose painting prescriptions. This is consistent with our earlier study for head & neck cancers [Citation22], were we found the resulting dose painting prescriptions to be robust by either using absolute or relative FDG-PET standardized uptake values.
The ADC to G translation is based on data from Turkbey et al. [Citation11]. Their analysis was designed to investigate how specific G correlate with ADC data, rather than how ADC data relate to different G. We renormalized their results to instead get the mapping of ADC values to probabilities for different G. Potential renormalization uncertainties could be avoided if studies were performed that directly scored ADC-to-Gleason distributions instead of Gleason-to-ADC distributions. Furthermore, we found that small noisy regions with low ADC resulted in the presence of small high G regions. In the work by Ghobadi et al. [Citation10], Gleason score regions smaller than 0.5 cm3 were set to constitute nonmalignant regions, since such small regions likely are not detectable from MR-imaging. Hence, similar to Ghobadi et al. [Citation10], we transformed small high Gleason score regions (resulting from noise of low ADC regions) into the surrounding region of lower Gleason scores by means of an erosion kernel. This erosion operation also resulted that a set of solitary voxels with arbitrary ADC data were optimized to the minimum dose prescription per patient (shown in ).
The potential TCP increases for the test set resulted in a slightly lower trend compared to the learning set (shown in ). This is explained by that the ADC driven dose-response functions represent geometric averages over probabilities of G (EquationEquation (8)(8) ). For voxels with low ADC values, low Gleason scores are still probable and vice versa for high ADC values. Hence, the TCP optimization for the test set gives a slight reduction in the dose-response differentiation compared to the learning set, which also yielded smoother dose variations (as shown in ).
Our results demonstrate the potential for significant TCP increases based on Gleason score driven dose painting prescriptions (). The patients estimated with poor prognosis demonstrate a higher potential for TCP increases. Furthermore, the TCP increases correlates with increasing prostate volume and Gleason score heterogeneity, which can be used as a prognostic factor for selection of patients to be treated with dose painting. However, clinical trials are needed to confirm the feasibility of Gleason score driven painting approaches by means of ADC imaging. For such trials, consideration is needed both for which minimum and maximum dose levels that can be given safely. In the presented formalism, these levels varied between 63–90 and 100–137 Gy, respectively, for different patients (). These dose levels are determined for an assumed ideal dose delivery with no delivery dependent dose correlations between neighboring voxels. The optimization of dose painting prescriptions does not include any lower or upper dose constraints, but such constraints could simply be included. However, our resulting dose levels seems to be in agreement with the study from Azzeroni et al. [Citation32] that found through biological optimization based on Poisson dose-response modeling, dose levels up to 120 Gy for the most malignant subvolumes in prostates. Lastly, the range of heterogeneous dose levels that can be given is also limited by the physical realizability to deliver such dose levels, although we leave such issues to future studies.
Conclusions
Based on retrospective data of prostate cancer patients treated with RT, we have demonstrated a working formalism for dose painting prescriptions of prostate volumes that potentially can yield significant TCP increases without extra dose burdens. The formalism is driven by Gleason scores that we probabilistically map from ADC images, which further argues for the inclusion of MRI within the preparatory workflow for RT. The potential for individual TCP increases correlated both to increasing prostate volumes and Gleason score heterogeneities, which may guide the patient selection for clinical trials of dose painting for prostate cancer.
Eric_Gronlund_et_al._Supplementary_material.zip
Download Zip (1.8 MB)Acknowledgments
We are grateful to Associate Professor Alexandru Dasu at the Skandion clinic in Uppsala, and Associate Professor Jan Weis at Uppsala University for helpful discussions.
Disclosure statement
We declare no conflict of interests.
Additional information
Funding
Related Research Data
References
- Peeters STH. Dose-response in radiotherapy for localized prostate cancer: results of the Dutch multicenter randomized phase III trial comparing 68 Gy of radiotherapy with 78 Gy. J Clin Oncol. 2006;24:1990–1996.
- Pollack A, Zagars GK, Starkschall G, et al. Prostate cancer radiation dose response: results of the MD Anderson phase III randomized trial. Int J Radiat Oncol Biol Phys. 2002;53:1097–1105.
- Zietman A, DeSilvio M, Slater J, et al. Comparison of conventional-dose vs high-dose conformal radiation therapy in clinically localized adenocarcinoma of the prostate: a randomized controlled trial. JAMA. 2005;294:1233–1239.
- Dearnaley DP, Sydes MR, Graham JD, et al. Escalated-dose versus standard-dose conformal radiotherapy in prostate cancer: first results from the MRC RT01 randomised controlled trial. Lancet Oncol. 2007;8:475–487.
- Ling CC, Humm J, Larson S, et al. Towards multidimensional radiotherapy (MD-CRT): biological imaging and biological conformality. Int J Radiat Oncol Biol Phys. 2000;47:551–560.
- Magi-Galluzzi C, Montironi R, Epstein JI. Contemporary Gleason grading and novel grade groups in clinical practice. Curr Opin Urol. 2016;26:488–492.
- Loeb S, Folkvaljon Y, Robinson D, et al. Evaluation of the 2015 Gleason grade groups in a nationwide population-based cohort. Eur Urol. 2016;69:1135–1141.
- Han M, Partin AW, Zahurak M, et al. Biochemical (prostate specific antigen) recurrence probability following radical prostatectomy for clinically localized prostate cancer. J Urol. 2003;169:517–523.
- Epstein JI, Zelefsky MJ, Sjoberg DD, et al. A contemporary prostate cancer grading system: a validated alternative to the Gleason score. Eur Urol. 2016;69:428–435.
- Ghobadi G, de Jong J, Hollmann BG, et al. Histopathology-derived modeling of prostate cancer tumor control probability: implications for the dose to the tumor and the gland. Radiother Oncol. 2016;119:97–103.
- Turkbey B, Shah VP, Pang Y, et al. Is apparent diffusion coefficient associated with clinical risk scores for prostate cancers that are visible on 3-T MR images? Radiology. 2011;258:488–495.
- Tamada T, Sone T, Jo Y, et al. Apparent diffusion coefficient values in peripheral and transition zones of the prostate: comparison between normal and malignant prostatic tissues and correlation with histologic grade. J Magn Reson Imaging. 2008;28:720–726.
- Shigemura K, Yamanaka N, Yamashita M. Can diffusion-weighted magnetic resonance imaging predict a high Gleason score of prostate cancer? Korean J Urol. 2013;54:234.
- deSouza NM, Riches SF, VanAs NJ, et al. Diffusion-weighted magnetic resonance imaging: a potential non-invasive marker of tumour aggressiveness in localized prostate cancer. Clin Radiol. 2008;63:774–782.
- Bittencourt LK, Barentsz JO, de Miranda LCD, et al. Prostate MRI: diffusion-weighted imaging at 1.5T correlates better with prostatectomy Gleason grades than TRUS-guided biopsies in peripheral zone tumours. Eur Radiol. 2012;22:468–475.
- Mazaheri Y, Hricak H, Fine SW, et al. Prostate tumor volume measurement with combined T2-weighted imaging and diffusion-weighted MR: correlation with pathologic tumor volume 1. Radiology. 2009;252:449–457.
- Boesen L, Chabanova E, Løgager V, et al. Apparent diffusion coefficient ratio correlates significantly with prostate cancer Gleason score at final pathology: ADC ratio correlates with Gleason score. J Magn Reson Imaging. 2015;42:446–453.
- Casares-Magaz O, van der Heide UA, Rørvik J, et al. A tumour control probability model for radiotherapy of prostate cancer using magnetic resonance imaging-based apparent diffusion coefficient maps. Radiother Oncol. 2016;119:111–116.
- Lips IM, van der Heide UA, Haustermans K, et al. Single blind randomized phase III trial to investigate the benefit of a focal lesion ablative microboost in prostate cancer (FLAME-trial): study protocol for a randomized controlled trial. Trials. 2011;12:255.
- Bentzen SM, Gregoire V. Molecular imaging?based dose painting: a novel paradigm for radiation therapy prescription. Semin Radiat Oncol. 2011;21:101–110.
- Vogelius IR, Håkansson K, Due AK, et al. Failure-probability driven dose painting. Med Phys. 2013;40:081717.
- Grönlund E, Johansson S, Montelius A, et al. Dose painting by numbers based on retrospectively determined recurrence probabilities. Radiother Oncol. 2017;122:236–241.
- Bentzen SM. Theragnostic imaging for radiation oncology: dose-painting by numbers. Lancet Oncol. 2005;6:112–117.
- Mohler J, Bahnson RR, Boston B, et al. Prostate cancer. J Natl Compr Canc Netw. 2010;8:162–200.
- Johansson S, Åström L, Sandin F, et al. Hypofractionated proton boost combined with external beam radiotherapy for treatment of localized prostate cancer. Prostate Cancer. 2012;2012:1–14.
- Vogelius IR, Bentzen SM. Meta-analysis of the alpha/beta ratio for prostate cancer in the presence of an overall time factor: bad news, good news, or no news? Int J Radiat Oncol Biol Phys. 2013;85:89–94.
- Bentzen SM, Tucker SL. Quantifying the position and steepness of radiation dose-response curves. Int J Radiat Biol. 1997;71:531–542.
- Dasu A, Toma-Dasu I. Will intrafraction repair have negative consequences on extreme hypofractionation in prostate radiation therapy? Br J Radiol. 2015;88:20150588.
- Epstein JI, Allsbrook WC, Jr, Amin MB, et al. The 2005 International Society of Urological Pathology (ISUP) consensus conference on Gleason grading of prostatic carcinoma. Am J Surg Pathol. 2005;29:1228–1242.
- Epstein JI, Egevad L, Amin MB, et al. The 2014 International Society of Urological Pathology (ISUP) consensus conference on Gleason grading of prostatic carcinoma: definition of grading patterns and proposal for a new grading system. Am J Surg Pathol. 2016;40:244–252.
- Ebert MA, Hoban PW. Some characteristics of tumour control probability for heterogeneous tumours. Phys Med Biol. 1996;41:2125.
- Azzeroni R, Maggio A, Fiorino C, et al. Biological optimization of simultaneous boost on intra-prostatic lesions (DILs): sensitivity to TCP parameters. Phys Med. 2013;29:592–598.