
Abstract
Introduction: Evaluation of patient characteristics inducing toxicity in breast radiotherapy, using simultaneous modeling of multiple endpoints.
Methods and Materials: In 269 early-stage breast cancer patients treated with whole-breast irradiation (WBI) after breast-conserving surgery, toxicity was scored, based on five dichotomized endpoints. Five logistic regression models were fitted, one for each endpoint and the effect sizes of all variables were estimated using maximum likelihood (MLE). The MLEs are improved with James–Stein estimates (JSEs). The method combines all the MLEs, obtained for the same variable but from different endpoints. Misclassification errors were computed using MLE- and JSE-based prediction models. For associations, p-values from the sum of squares of MLEs were compared with p-values from the Standardized Total Average Toxicity (STAT) Score.
Results: With JSEs, 19 highest ranked variables were predictive of the five different endpoints. Important variables increasing radiation-induced toxicity were chemotherapy, age, SATB2 rs2881208 SNP and nodal irradiation. Treatment position (prone position) was most protective and ranked eighth. Overall, the misclassification errors were 45% and 34% for the MLE- and JSE-based models, respectively. p-Values from the sum of squares of MLEs and p-values from STAT score led to very similar conclusions, except for the variables nodal irradiation and treatment position, for which STAT p-values suggested an association with radiosensitivity, whereas p-values from the sum of squares indicated no association. Breast volume was ranked as the most significant variable in both strategies.
Discussion: The James–Stein estimator was used for selecting variables that are predictive for multiple toxicity endpoints. With this estimator, 19 variables were predictive for all toxicities of which four were significantly associated with overall radiosensitivity. JSEs led to almost 25% reduction in the misclassification error rate compared to conventional MLEs. Finally, patient characteristics that are associated with radiosensitivity were identified without explicitly quantifying radiosensitivity.
Introduction
One out of eight women develops breast cancer during her lifetime. Worldwide, the incidence is rising and is expected to increase in the next decade [Citation1]. Fortunately, the number of breast cancer survivors is also increasing due to better awareness, earlier detection and more successful treatment modalities. In Belgium, the five-year relative survival rate of female breast cancer patients is now about 90% (www.kankerregister.org). More than 80% of patients with early-stage (non-metastasized) breast cancer receive radiation treatment in the adjuvant setting after surgery. Eventually, radiotherapy may be combined with systemic therapies like hormone therapy, chemotherapy or targeted therapy. Late radiotoxicity effects have been well documented [Citation2]. Skin fibrosis and pigmentation changes, telangiectasia and cosmetic alterations have been described [Citation3,Citation4]. Some of these side effects are attributed to outdated techniques and larger target volumes in older publications, but even with contemporary intensity-modulated radiotherapy (IMRT) techniques, toxicity is seen in a significant number of patients [Citation5,Citation6]. About 25% of patients diagnosed with breast cancer are younger than 50 years of age. Given the high incidence of breast cancer, the favorable survival rates, and the often young age at diagnosis, late side effects are important to consider when prescribing an adjuvant treatment. Inter-individual differences in the prevalence and severity of radiation-related side effects are large. It has been shown that radiotherapy-related factors like total dose, dose per fraction, irradiated volume and dose homogeneity are predictive for late skin toxicity and cosmesis [Citation7]. Patient and surgery-related factors like body mass index (BMI), breast volume, smoking, hypertension, baseline cosmesis and post-operative infection also play a role in developing toxicity after breast irradiation [Citation3,Citation8,Citation9]. Inter-patient differences in radiation sensitivity are also assumed to be explained by underlying genetic factors [Citation3]. Identifying predisposing factors can contribute to the prevention of severe late toxicities by tailoring treatments to the individual patient. Predictive models are also important when informing a patient about her chance of toxicity.
Inter-individual differences in toxicity outcomes are partly related to radiosensitivity, but also partly endpoint specific [Citation10–12]. Therefore, it is vital to consider multiple endpoints in prediction models. This paper aimed to present a new approach for modeling overall radiosensitivity and predicting multiple toxicity endpoints and apply this approach to a 2-year toxicity data of 269 irradiated breast cancer patients. In our study cohort, five toxicity endpoints were measured with two goals in mind.
Firstly, prediction models were developed for all endpoints simultaneously, improving the predictions of a given endpoint by borrowing information from other endpoints.
Secondly, predisposing factors associated with radiosensitivity were identified without explicitly defining/quantifying radiosensitivity. Radiosensitivity is never directly observed, only multiple surrogate endpoints are measured. A technique currently used to model associations of patient characteristics with radiosensitivity is the Standardized Total Average Toxicity (STAT) score [Citation10]. The STAT score summarizes several endpoints into a single value to mimic radiosensitivity. However, the STAT score is an arbitrary function (standardized average) of multiple endpoints with no clear clinical meaning. Radiosensitivity is a latent outcome, and it is only inferred through measurements of various types of radiotoxicity. Quantifying radiosensitivity from measured toxicities might be beyond the bounds of possibility. Our goal was to avoid the challenging task of quantifying radiosensitivity while identifying factors associated with it.
Material and methods
Patients
Two hundred and sixty-nine early-stage breast cancer patients treated between 2009 and 2014 at Ghent University Hospital with whole-breast irradiation (WBI) after breast-conserving surgery were included in this analysis. All patients gave informed consent and agreed to prospective data collection including digital photographs and a blood sample for genotyping. Patients participated in one of the clinical trials approved by the local Ethics Board and registered on www.clinicaltrials.gov (NCT00887523, NCT01973634). Only patients with two-year follow-up data were included.
Radiation treatment
All patients received WBI of 40.05Gy in 15 fractions; also, 32 patients were treated to the periclavicular and axillary lymph node regions following the same fractionation scheme. The latter patients were treated in supine position, while patients receiving WBI without lymph node irradiation (LNI), were either treated supine or prone. A sequential boost of four times 2.5Gy was added, for 206 patients.
Assessment of toxicity
The grade of fibrosis and edema was scored by the responsible radiation oncologist at baseline (before the start of radiotherapy) and at every follow-up visit using the LENT–SOMA (late effect of normal tissue–subjective, objective, medical management, and analytical evaluation) toxicity scale [Citation13]. Pigmentation change was scored at the same time points on a three-point scale: none, transient or permanent. Since most patients experience fibrosis of the surgical scar, only fibrosis outside the tumorbed was considered. Before and two years after treatment, digital photographs of the thorax were taken in standard conditions as described earlier [Citation14]. Retraction was scored on the photographs, also per the LENT–SOMA scale. The BCCT.core (breast cancer conservation treatment.cosmetic results) software of the INESC Porto Breast Research Group [Citation15], was used to assess retraction. Photographs were taken with the arms at the level of the hips and above the head. Based on measurements of asymmetry, the software provides a score from 1 (excellent cosmetic outcome) to 4 (poor cosmetic outcome) in comparison with the non-treated breast. To assess toxicity related to radiotherapy, the difference Δ, between the baseline score and the score at two years was used. Patients with a Δ0 experienced no radiation-related toxicity. Patients with Δ1, Δ2 or Δ3, experienced an increase in toxicity of 1, 2 or 3 grades, respectively. Telangiectasia was not included for endpoint analysis, because of too few events.
Genotyping
Genotyping was performed for seven single nucleotide polymorphisms (SNPs), located in six genes. The focus was on validating previously reported relationships with late skin toxicity. The relation between rs2682585 polymorphism in the XRCC1 gene [Citation16] and the rs1800629 polymorphism in the TNF gene [Citation17], and radiation-induced toxicity was analysed. In the genome-wide association study [Citation18], four more polymorphisms were identified (SATB2: rs2881208, CCDC129: rs882460, SLFN14: rs2840044 and CCRN4L: rs13116075). These were also included. In addition, the rs321601 polymorphism near the variation mentioned above in SLFN14 was genotyped. Genomic DNA was obtained from blood using the Puregene genomic DNA purification kit (Gentra Systems, Minneapolis, MN, USA). Genotyping was performed using restriction fragment length polymorphism (RFLP) analyses, high-resolution melting (HRM) curve analyses and direct sequencing. Primer sequences and restriction enzymes are available in the Supplementary Tables S1 and S2. For reproducibility control, 15% of all samples were duplicated. The concordance rate between duplicate samples was 100%. All genotype distributions were in Hardy–Weinberg equilibrium (p < .05). Only one data point for one polymorphism was missing. Only the dominant model coding was looked at for all SNPs. The recessive and the additive model coding (other possible SNPs model coding) led to categories with too few patients and unreliable statistical conclusions.
Data
The endpoints were dichotomized as follows: patients with Δ0 (experiencing no radiation-related toxicity) were classified as 0 (controls) and patients with any grade of toxicity (Δ1, Δ2 or Δ3) as 1 (cases). Dichotomizing between mild (grouping Δ0 and Δ1) versus severe (grouping Δ2 and Δ3) would have resulted in a disproportionately small group of severe toxicity (<5% of cases). For that reason, we classified Δ0 as control versus Δ1, Δ2 or Δ3 as cases.
Variables investigated are listed in , for the categorical and continuous variables. Missing variable values were imputed by multiple imputations, before estimating the effect sizes of interest.
Table 1. Variables and endpoints investigated.
Statistical analysis
In this section, we discuss the models, how the effect sizes are estimated and describe an alternative approach that leads to better predictions of individual endpoints. Moreover, a statistical test is introduced for the identification of risk factors that are significantly associated to radiosensitivity, without quantifying radiosensitivity.
With five binary endpoints, we fitted five multivariate logistic regression models one for each endpoint, to assess the impact of the variables on the endpoints. The standard procedure for estimating parameters of a logistic regression model is based on the maximum likelihood estimators (MLEs). For prediction, individual MLEs of a given variable can be further improved by using a combination of other MLEs for the same variable but from different endpoints. This seems controversial at first, and it is known as Stein’s paradox [Citation19]. When there are at least three parameters analysed simultaneously, this approach results in a lower mean squared error (MSE), as has been demonstrated by James and Stein [Citation20]. This estimator will be called the James–Stein estimator (JSE). JSE compared to MLE, may also lead to better predictions when used in a prediction rule [Citation21]. Five effect sizes (MLEs) were estimated per variable, one for each of the five endpoints. Therefore, the James–Stein estimator is directly applicable and can be constructed from these MLEs (see Supplementary Appendix for details). In constructing the JSEs, the sum of squares of the MLEs for the ith variable is computed. In particular, where
is the MLE of the effect size of variable i, for the jth endpoint and J is the total number of endpoints (J = 5). The JSE of the ith variable, for the jth endpoint, is constructed using Si, as
. The parameter
, which is called the shrinkage parameter, drives the procedure. It is assumed that the average effect size across endpoints is zero for all variables, since it is likely that most variables have no effect on the endpoint. Therefore, the JSE shrinks the MLE towards zero, when Si is approximately equal to J − 2. When Si is much larger than J− 2, there is almost no shrinkage, meaning the MLEs cannot benefit from the other endpoints. Finally, when Si is smaller than J − 2, the shrinkage parameter λi becomes negative. To avoid negativity, the parameter is transformed to λi+ (the positive part of λi) which takes the value zero when λi is negative. With λi+ equal to zero, the effect size of variable i is zero across all endpoints. This is a form of variable selection (only variables with non-zero effect sizes stay in the model) and may improve predictions.
To evaluate the predictive value of MLEs versus JSEs, given a specific medical history, we ran one-hundred repeats of five-folds cross-validated misclassification error rates, based on MLEs and JSEs in a prediction rule, separately.
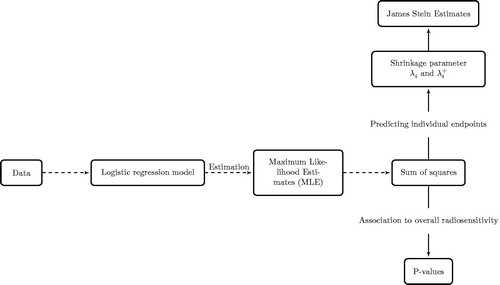
The sum of squares, Si, can also be used as a test statistic (when endpoints are independent, which is the case). The statistic, Si, has a chi-squared distribution with J = 5, degrees of freedom. With five endpoints, and at a 5% significance level, the critical value is 11.07. Sum of squares greater than 11.07 are significantly different from zero and their corresponding p-values can be calculated. Based on these p-values, variables associated with radiosensitivity can be found without explicitly quantifying radiosensitivity. The entire modeling process is summarized in a flow diagram in .
Figure 1. Flow diagram showing the modeling steps. From the data, the model is fitted, estimation of model parameters is by maximizing the likelihood for each endpoint. Sum of squares are computed from which association of variables to radiosensitivity can be investigated with p-values. On the other hand, for predicting individual endpoints, the sum of squares can be transformed to shrinkage parameters, and James–Stein estimates (JSE) are computed. JSE led to better predictions when used in the prediction rule compared to maximum likelihood estimates.
In calculating the STAT score, on the other hand, the sum of the five endpoints for each patient, its mean and variance across patients are computed. The sum of toxicity scores for each patient is then subtracted from the mean and divided by the standard deviation (standardization). The STAT score computed this way is the quantity that represents radiosensitivity. A multiple linear regression model with the STAT score as the response variable is fitted, from which p-values are used to represent the association of radiosensitivity and patient characteristics.
Results
shows the MLEs and their corresponding JSEs for the five endpoints. Ranking of the variables is based on the shrinkage parameter λi (and its positive counterpart λi+), which measures how far the MLEs of the ith variable are from zero. Breast volume is the highest ranked variable. gives a visual comparison between the MLEs and JSEs. Here, the dashed line represents the distance of MLEs from zero, i.e., the sum of squares (scaled to fit on the plot) of effect sizes across all five endpoints. The variables were ranked by their sum of squares, which measures how close the effect sizes are to zero. The MLEs and their respective JSEs are also displayed for every endpoint. Based on the JSEs, only 19 highest ranked variables stay in the prediction model. In descending order, most important variables increasing radiation-induced toxicity were breast volume, chemotherapy, age, SATB2 rs2881208 SNP and nodal irradiation. The most protective variable was treatment position (prone position), which came at the eighth rank. Sums of squares smaller than J − 2 were observed for the clinical variables, diabetes, boost and tumor size (). Which means the effect sizes of these variables are close to zero; consequently, their shrinkage parameters (λi+) were zero and their MLEs were shrunken to zero for all endpoints ( and ). This indicates that these variables were not predictive of any of the endpoints and therefore omitted from the prediction model. Boxplots () show the misclassification error rates of the MLE and the JSE when used in the prediction rule. For all the different endpoints, misclassification error rates with JSEs are lower than those obtained via MLEs. Overall, the misclassification error of the MLE was 45% and that of the JSE was 34%, which is nearly 25% lower, suggesting that JSE is better.
Figure 2. Maximum likelihood estimates, MLEs, (•) and their corresponding James Stein estimates JSE (⋄). Each set of MLEs and JSEs are labeled with the variable name. The blue dash line is a scaled version of the variance around zero, of each variable. On top of the plot are the ranks of the variables. Line segments are used to connect the MLEs to illustrate their scatter.
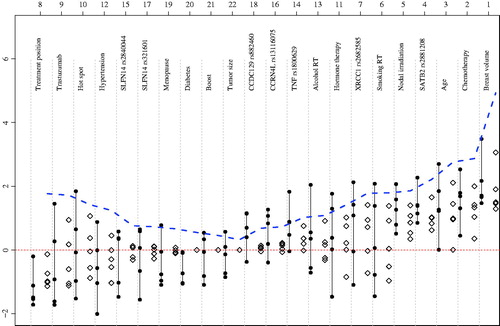
Figure 3. One-hundred repetition of five-folds cross validated misclassification error rates of maximum likelihood estimates (MLEs) and James–Stein estimates (JSEs). Smaller misclassification errors are observed for the JSE compared to the MLE. Overall, the misclassification error of the MLE is 45% and that for the JSE 34%.
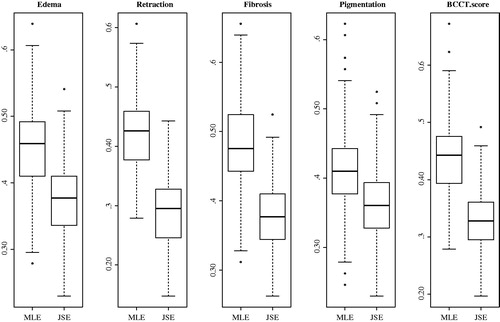
Table 2. Maximum likelihood estimates (MLEs) of each variable and their James Stein estimates (JSEs).
Regarding association, p-values are presented for the sum of squares and from the model with the STAT score as endpoint (). Results of p-values from the sum of squares versus STAT p-values show discrepancies for the variables nodal irradiation and treatment position. For both variables, STAT p-value suggests an association, whereas none can be concluded based on the sum of squares. For all other variables, results were quite similar. Breast volume was ranked as the most important variable in both techniques.
Fifteen variables with a p-value greater than 5% and a non-zero λi+, are nevertheless retained, because inclusion of these variables may lead to better prediction. It must be noted that two of these 15 are only significant for STAT score analysis.
Discussion
Overall, radiosensitivity can be defined as an unknown combination of several toxicity endpoints. We aimed at: (1) searching variables associated with overall radiosensitivity without explicitly quantifying it and (2) predictive for the individual endpoints. We exploited James and Stein’s approach [Citation20], which maximizes the use of the data. That is, it uses information from other endpoints for estimating the effect size of a single endpoint. The sums of squares of the MLEs was used as a test statistic to test associations of the unknown radiosensitivity and patient characteristics.
The variables diabetes, boost irradiation and tumor size were shrunken to zero and considered non-predictive, hence not included in the prediction model. Modeling with the JSE has the advantage of maintaining the information on individual endpoints, from which patients’ risk profiles can be computed. Clinicians can rank patients by their risk of toxicities, and their treatment is then tailored (e.g., adapting the doses). Partial breast irradiation has shown to reduce toxicity, but some studies show a higher recurrence risk. In the clinic, patient toxicity risk profiles computed from JSEs can be used to open discussions with patients, e.g., do you prefer whole-breast irradiation with a high risk of toxicity or partial breast irradiation, which is probably safe in low-risk tumors, but the long-term outcome is unknown?
The misclassification error rate quantifies the percentage of wrong predictions, i.e., if the model predicts a patient with ‘toxicity’ as ‘no toxicity’ and vice versa. The JSE led to smaller misclassification errors, as presented in . There is always a bias-variance trade-off when parameters of a model are estimated. The MLE is unbiased asymptotically, but may end up with a large variance, and hence a higher rate of misclassification. Unlike the MLE, the JSE introduces bias which may reduce its variance and may lead to a low misclassification error. With the JSE, only 19 variables (the variables with ranks 1–19 in ) were needed for prediction, thus included in the model. In predicting different endpoints, the JSE guaranteed 66% correct classification overall. The MLE is making use of twenty-two variables resulted in only 55% correct classifications, which comes very close to coin flipping. Referring to each endpoint, JSE again outperformed MLE, with lower misclassification errors for every endpoint.
The p-values from the sum of squares are informative for hypothesis testing/association studies. Based on these p-values, variables associated to radiosensitivity can be found without explicitly quantifying radiosensitivity. However, the STAT score quantifies radiosensitivity (an unknown entity) and goes on to investigate variables associated with it. Using a significance level of 5%, only the first four variables from were significant. Larger breast volume, chemotherapy, older age and the SATB2 rs2881208 SNP were associated with a higher chance of developing any toxicity. These associations have been reported before. The correlation between breast volume and late toxicity has been seen in different publications [Citation3,Citation22–25]. Since no correlation was found between breast volume and hot spots in this dataset, the effect cannot only be attributed to dose inhomogeneity, as already reported by Goldsmith et al. [Citation22]. A possible explanation may be the increased presence of more adipose tissue in large breasts. Adipocytes are known to secrete adipokines involved in inflammation like leptin, IL-6, IL-8 or TNFα [Citation26]. Large breast size is often seen in combination with obesity. An increased number of macrophages and an inflammatory signature has been shown in breast adipose tissue of obese women compared to normal-weight women [Citation27,Citation28]. There is also an association between hypertrophic adipocytes, as often seen in obesity, and the production of pro-inflammatory adipokines [Citation26]. This chronic inflammatory state could predispose to increased toxicity after breast irradiation. In this dataset, there was a very strong correlation between BMI and breast volume. If BMI was included in the model, it was shrunk to zero, and the overall prediction performance of the model dropped. Without breast volume in the model, BMI became a predictive variable, but weaker than breast volume. For this reason, BMI was left out of the model. There seems to be a strong association between chemotherapy and toxicity, even if not given concomitantly with radiation as was the case in our study. This confirms literature data [Citation3,Citation29,Citation30]. There is emerging evidence that the synergistic effect of radiotherapy and chemotherapy is explained by an effect on the immune system. Recent investigations show that the innate immune system is involved in the tumor response after radiation treatment [Citation31].
Some chemotherapeutic agents typically used in breast cancer, like anthracyclines, taxanes and cyclophosphamides are also capable of influencing the immune response [Citation32]. An increased risk of late toxicity with older age has been reported in the boost-no boost trial [Citation33], and in other trials [Citation3,Citation29,Citation34,Citation35]. With increasing age, the glandular tissue is replaced by adipose and stromal tissue, which might lead to a higher susceptibility to radiation-related side effects as described above. Another explanation could be the reduced DNA repair capacity at an older age. The last significant variable in the model, based on the sum of squares p-value, was the rs2881208 polymorphism near SATB2. In the genome-wide association study [Citation18], this SNP was significantly associated with increased toxicity for all endpoints and the STAT score. Besides these four variables, the STAT score also detects a significant association with toxicity for nodal irradiation and treatment position, even though the p-values of these variables from the sums of squares were insignificant. Effect sizes with consistent signs across endpoints end up having a significant STAT score p-value, no matter how small these effect sizes are. When the nodes are irradiated, the treated volume increases and dose inhomogeneity is more likely to occur. These confounders may lead to significant STAT scores. Therefore, the increase in late toxicity, as seen in other studies [Citation30,Citation35], is logical. Patients treated in a prone position are less likely to develop any of the reported toxicities, which agrees with a randomized trial comparing prone and supine breast radiotherapy [Citation14]. Due to the shape of the breast in prone position, it is much easier to obtain homogeneous dose distributions than in supine position. Thirteen other variables were predictive, while their p-values were insignificant. Most of these variables were selected based on previously described associations with late toxicity after breast irradiation. The effect sizes in our cohort were often small, and the direction of the association was not always consistent with literature data. Several reasons can be found. A major limitation of our study is the small sample size. A second explanation might be the way the endpoints were dichotomized. Due to the very low number of serious adverse events, i.e., grade 2 or 3 toxicity, the groups were allocated based on no toxicity at all (controls) and any grade of toxicity (cases). Since grade 1 side effects are not unusual at two years, this dichotomization may have biased the results. We only looked at cosmetic outcomes. Given the limited follow-up of two years, we could not evaluate data on other, more relevant, endpoints like heart toxicity, lung toxicity and secondary malignancies. However, we aimed at pioneering research in the direction of modeling overall radiosensitivity from multiple endpoints. The association of variables with overall radiosensitivity we have modeled will improve if data on other endpoints become available.
Conclusion
JSE is used for selecting variables that are predictive for multiple toxicity endpoints. With this estimator, 19 variables were predictive for all toxicities, of which only four were significantly associated with overall radiosensitivity. JSEs led to almost 25% reduction in the misclassification error compared to MLEs. With the sum of squares of MLEs, patient characteristics that are associated with radiosensitivity were identified without explicitly quantifying radiosensitivity.
Chamberlain_Mbah_et_al._Supplementary_material.zip
Download Zip (119.4 KB)Disclosure statement
The authors report no conflicts of interest.
Additional information
Funding
Related Research Data
References
- Ferlay J, Soerjomataram I, Dikshit R, et al. Cancer incidence and mortality worldwide: sources, methods and major patterns in GLOBOCAN 2012. Int J Cancer. 2015;136:E359–E386.
- Clarke M, Collins R, Darby S, et al. Effects of radiotherapy and of differences in the extent of surgery for early breast cancer on local recurrence and 15-year survival: an overview of the randomised trials. Lancet. 2005;366:2087–2106.
- Barnett GC, Wilkinson JS, Moody AM, et al. The Cambridge breast intensity-modulated radiotherapy trial: patient- and treatment-related factors that influence late toxicity. Clin Oncol (R Coll Radiol). 2011;23:662–673.
- Turesson I, Nyman J, Holmberg E, et al. Prognostic factors for acute and late skin reactions in radiotherapy patients. Int J Radiat Oncol Biol Phys. 1996;36:1065–1075.
- Mukesh MB, Barnett GC, Wilkinson JS, et al. Randomized controlled trial of intensity-modulated radiotherapy for early breast cancer: 5-year results confirm superior overall cosmesis. J Clin Oncol. 2013;31:4488–4495.
- Barnett GC, Wilkinson JS, Moody AM, et al. Randomized controlled trial of forward-planned intensity modulated radiotherapy for early breast cancer: interim results at 2 years. Int J Radiat Oncol Biol Phys. 2012;82:715–723.
- Milano MT, Constine LS, Okunieff P. Normal tissue tolerance dose metrics for radiation therapy of major organs. Semin Radiat Oncol. 2007;17:131–140.
- Andreassen CN, Alsner J, Overgaard M, et al. Prediction of normal tissue radiosensitivity from polymorphisms in candidate genes. Radiother Oncol. 2003;69:127–135.
- Azria D, Ozsahin M, Kramar A, et al. Single nucleotide polymorphisms, apoptosis, and the development of severe late adverse effects after radiotherapy. Clin Cancer Res. 2008;14:6284–6288.
- Barnett GC, West CM, Coles CE, et al. Standardized total average toxicity score: a scale- and grade-independent measure of late radiotherapy toxicity to facilitate pooling of data from different studies. Int J Radiat Oncol Biol Phys. 2012;82:1065–1074.
- Herskind C, Talbot CJ, Kerns SL, et al. Radiogenomics: a systems biology approach to understanding genetic risk factors for radiotherapy toxicity? Cancer Lett. 2016;382:95–109.
- Kerns SL, West CM, Andreassen CN, et al. Radiogenomics: the search for genetic predictors of radiotherapy response. Future Oncol. 2014;10:2391–2406.
- LENT SOMA tables. Radiother Oncol. 1995;35:17–60.
- Veldeman L, Schiettecatte K, De Sutter C, et al. The 2-year cosmetic outcome of a randomized trial comparing prone and supine whole-breast irradiation in large-breasted women. Int J Radiat Oncol Biol Phys. 2016;95:1210–1217.
- Cardoso JS, Cardoso MJ. Towards an intelligent medical system for the aesthetic evaluation of breast cancer conservative treatment. Artif Intell Med. 2007;40:115–126.
- Seibold P, Behrens S, Schmezer P, et al. XRCC1 polymorphism associated with late toxicity after radiation therapy in breast cancer patients. Int J Radiat Oncol Biol Phys. 2015;92:1084–1092.
- Talbot CJ, Tanteles GA, Barnett GC, et al. A replicated association between polymorphisms near TNFalpha and risk for adverse reactions to radiotherapy. Br J Cancer. 2012;107:748–753.
- Barnett GC, Thompson D, Fachal L, et al. A genome wide association study (GWAS) providing evidence of an association between common genetic variants and late radiotherapy toxicity. Radiother Oncol. 2014;111:178–185.
- Efron B, Morris CN. Stein's paradox in statistics. New York, NY: Macmillan Learning; 1977.
- James W, Stein C, editors. Estimation with quadratic loss. Proceedings of the fourth Berkeley symposium on mathematical statistics and probability. University of California Press; 1961.
- Jennrich RI, Oman SD. How much does Stein estimation help in multiple linear regression? Technometrics. 1986;28:113–121.
- Goldsmith C, Haviland J, Tsang Y, et al. Large breast size as a risk factor for late adverse effects of breast radiotherapy: is residual dose inhomogeneity, despite 3D treatment planning and delivery, the main explanation? Radiother Oncol. 2011;100:236–240.
- Hille-Betz U, Vaske B, Bremer M, et al. Late radiation side effects, cosmetic outcomes and pain in breast cancer patients after breast-conserving surgery and three-dimensional conformal radiotherapy: risk-modifying factors. Strahlenther Onkol. 2016;192:8–16.
- Gray JR, McCormick B, Cox L, et al. Primary breast irradiation in large-breasted or heavy women: analysis of cosmetic outcome. Int J Radiat Oncol Biol Phys. 1991;21:347–354.
- Tsouskas LI, Fentiman IS. Breast compliance: a new method for evaluation of cosmetic outcome after conservative treatment of early breast cancer. Breast Cancer Res Tr. 1990;15:185–190.
- Skurk T, Alberti-Huber C, Herder C, et al. Relationship between adipocyte size and adipokine expression and secretion. J Clin Endocrinol Metab. 2007;92:1023–1033.
- Sun X, Casbas-Hernandez P, Bigelow C, et al. Normal breast tissue of obese women is enriched for macrophage markers and macrophage-associated gene expression. Breast Cancer Res Treat. 2012;131:1003–1012.
- Morris PG, Hudis CA, Giri D, et al. Inflammation and increased aromatase expression occur in the breast tissue of obese women with breast cancer. Cancer Prev Res (Phila). 2011;4:1021–1029.
- Cardoso MJ, Cardoso J, Santos AC, et al. Factors determining esthetic outcome after breast cancer conservative treatment. Breast J. 2007;13:140–146.
- Johansen J, Overgaard J, Overgaard M. Effect of adjuvant systemic treatment on cosmetic outcome and late normal-tissue reactions after breast conservation. Acta Oncol. 2007;46:525–533.
- De Wolf K, Vermaelen K, De Meerleer G, et al. The potential of radiotherapy to enhance the efficacy of renal cell carcinoma therapy. Oncoimmunology. 2015;4:e1042198.
- Galluzzi L, Senovilla L, Zitvogel L, et al. The secret ally: immunostimulation by anticancer drugs. Nat Rev Drug Discov. 2012;11:215–233.
- Bartelink H, Maingon P, Poortmans P, et al. Whole-breast irradiation with or without a boost for patients treated with breast-conserving surgery for early breast cancer: 20-year follow-up of a randomised phase 3 trial. Lancet Oncol. 2015;16:47–56.
- Lilla C, Ambrosone CB, Kropp S, et al. Predictive factors for late normal tissue complications following radiotherapy for breast cancer. Breast Cancer Res Treat. 2007;106:143–150.
- Taylor ME, Perez CA, Halverson KJ, et al. Factors influencing cosmetic results after conservation therapy for breast cancer. Int J Radiat Oncol Biol Phys. 1995;31:753–764.