
Abstract
Aim: To compare 18F-sodium fluoride positron emission tomography/computed tomography (NaF PET/CT) and 99mTc-labelled diphosphonate bone scan (BS) for the monitoring of bone metastases in patients with prostate cancer undergoing anti-cancer treatment.
Material and methods: Data from 64 patients with prostate cancer were included. The patients received androgen-deprivation therapy (ADT), next-generation hormonal therapy (NGH) or chemotherapy. The patients had a baseline scan and 1–3 subsequent scans during six months of treatment. Images were evaluated by experienced nuclear medicine physicians and classified for progressive disease (PD) or non-PD according to the Prostate Cancer Working Group 2 (PCWG-2) criteria. The patients were also classified as having PD/non-PD according to the clinical and prostate-specific antigen (PSA) responses.
Results: There was no difference between NaF PET/CT and BS in the detection of PD and non-PD during treatment (McNemar’s test, p = .18). The agreement between BS and NaF PET/CT for PD/non-PD was moderate (Cohen’s kappa 0.53, 95% confidence interval 0.26–0.79). Crude agreement between BS and NaF PET/CT for the assessment of PD/non-PD was 86% (89% for ADT, n = 28; 88% for NGH, n = 16, and 80% for chemotherapy, n = 20). In most discordant cases, BS found PD when NaF PET/CT did not, or BS detected PD on an earlier scan than NaF PET/CT. Biochemical progression (27%) occurred more frequently than progression on functional imaging (BS, 22% and NaF PET/CT, 14%). Clinical progression was rare (11%), and almost exclusively seen in patients receiving chemotherapy.
Conclusion: There was no difference between NaF PET/CT and BS in the detection of PD and non-PD; however, BS seemingly detects PD by the PCWG-2 criteria earlier than NaF-PET, which might be explained by the fact that NaF-PET is more sensitive at the baseline scan.
Introduction
Bone metastases are common in advanced prostate cancer and may cause severe morbidity [Citation1,Citation2]. With the average costs of cancer therapies having doubled in recent years [Citation3–5], monitoring of bone metastases is important in patient management to avoid the continuation of ineffective and costly treatments.
A planar whole-body bone scan (BS) remains the recommended and most widely used imaging modality for the detection and monitoring of bone metastases in prostate cancer [Citation6,Citation7]. Sonpavde et al. showed that progression on BS according to the Prostate Cancer Working Group 2 (PCWG-2) criteria was associated with impaired overall survival [Citation8]. Inter-observer variations in the reading of BS have been a subject of concern [Citation8]; however, we have demonstrated a high level of consistency among trained readers in staging and monitoring the treatment of bone metastases from prostate cancer [Citation9,Citation10].
Newer technologies, such as positron emission tomography/computed tomography (PET/CT) with the use of 18F-fluoride (NaF) have scarcely been investigated for the monitoring of bone metastases and are not included in the current clinical guidelines [Citation7,Citation11–13]. The present literature on the treatment monitoring of bone metastases in patients with prostate cancer is small, and the study populations are heterogeneous. Furthermore, these studies have investigated the sensitivity of the detection of response with NaF PET/CT and the correlation with biochemical responses by prostate specific antigen (PSA) [Citation14–16]. To the best of our knowledge, no studies have compared the abilities of BS and NaF PET/CT in monitoring the response to treatment in bone metastases.
The purpose of the study was to investigate the agreement between BS and NaF PET/CT in the response evaluation of bone metastases in patients with prostate cancer undergoing various anti-cancer treatments. Furthermore, the study investigated the relationship between imaging, biochemical, and clinical responses.
Material and methods
Study design
This was a prospective, comparative study of NaF PET/CT and planar, whole-body BS for the evaluation of treatment responses to different prostate cancer treatments. NaF PET/CT and BS were performed before or no later than 14 days from the initiation of treatment (baseline images). Follow-up scans using both imaging modalities were performed 1–3 times during the following 26 weeks, depending on the clinical trial settings and the stage of disease (see below). PSA levels were measured at least at every follow-up. The clinical response was evaluated from baseline to last follow-up.
Patients
The study included patients from two prospective studies. The first study ran from February 2014 to December 2015: consecutive patients with newly diagnosed, high-risk prostate cancer participated in a diagnostic test accuracy (DTA) study of planar BS, single-photon emission computed tomography/CT (SPECT/CT), and NaF PET/CT for the diagnosis of bone metastases (DTA study) [Citation17] and for treatment monitoring. Follow-up scans by all methods were therefore repeated after six months (a few patients also had scans at 1 and 3 months). Patients were recruited at two institutions, Aalborg University Hospital and Regional Hospital West Jutland Herning and Holstebro. The key eligibility criteria were 1) histologically confirmed adenocarcinoma of the prostate, 2) PSA blood levels ≥50 ng/mL, 3) eligible for androgen deprivation therapy (ADT), 4) no other current or prior cancers (five years), and 5) no prior or current androgen deprivation therapy (ADT) or other anti-cancer treatment for prostate cancer. The second study ran from October 2014 to December 2015 and included consecutive, eligible patients with 1) histologically confirmed prostate cancer, 2) bone metastases on BS at inclusion, 3) clinical life expectancy of ≥6 months, and 4) indication for anti-cancer therapy either primary ADT, next-generation hormonal therapy (NGH) (abiraterone or enzalutamide), or first- or second-line chemotherapy (docetaxel or cabazitaxel). Patients with prior cancers within five years were excluded. Patients were recruited at Aalborg University Hospital.
Imaging acquisition
Bone scans and NaF PET/CT were conducted in accordance with current institutional recommendations, which are in line with European guidelines [Citation18,Citation19]. Every BS was performed on Symbia dual-head gamma cameras with multi-purpose, low-energy, high-resolution collimators (Symbia T16, Siemens Medical Solutions, Erlangen, Germany in Aalborg and Symbia T2 and T16 in Herning). Scans were performed two-three hours after the administration of 750–1000 MBq 99mTc-labelled diphosphonate in Aalborg and 10 MBq/kg (i.e., 750 MBq for a 75 kg patient) 99mTc-labelled diphosphonate in Herning. The scan speed was 10 cm/min in Herning and 24 cm/min with 30% alpha blending in Aalborg. NaF PET/CT scans were performed on a VCT discovery True 64 PET/CT (GE Healthcare) in Aalborg and a Biograph mCT 64, 4R (Siemens Medical Solutions) in Herning. All scans were performed 30 minutes after the intravenous administration of approximately 200 MBq NaF in 3D mode from vertex to mid-thigh, encompassing 7–9 bed positions (150 s per bed position for GE VCT discovery True and 120–180 s per bed position according to BMI for Siemens Biograph). Images were reconstructed by iterative construction, using low-dose CT images for attenuation correction and anatomical co-registration. The CT parameters were 70–200mA smart mA, 120 kV for GE VCT Discovery True and 30 mAs, 120 kV for Siemens Biograph. Both protocols had a slice thickness of 0.625 mm.
Image analysis
Bone scans were evaluated as a consensus evaluation by two specialists in nuclear medicine with more than 10 years of experience in the evaluation of BS. Likewise, NaF PET/CT scans were evaluated by two other experienced nuclear medicine physicians with 5 and 10 years of experience in the evaluation of NaF PET/CT images. The readers were blinded to all clinical and biochemical information as well as other the imaging results. First, the readers were asked to assess the baseline images for the presence (M1) or absence (M0) of bone metastases. If bone metastases were present, the readers reported the number of these lesions in the following intervals: 1, 2–4, 5–9, 10–20, or >20 lesions. This classification was a slightly revised version of the extent-of-disease classification proposed by Soloway et al., a classification which has shown association of the number of bone metastases with overall survival [Citation20]. Then, the readers assessed the images for responses using the modified PCWG-2 criteria. The PCWG-2 distinguishes between progressive disease (PD) and non-PD, where PD is defined as the appearance of two or more new lesions, which should be confirmed on a subsequent scan. The baseline scan was compared with the first follow-up scan in side-by-side reading. In the case of PD, the second follow-up (if available) was used to confirm the presence of progression. In cases of non-PD, the baseline and the second follow-up scan were evaluated side-by-side, and the third follow-up scan (if available) was used to confirm progression. This means that any subsequent scan was used to confirm PD or evaluated side by side with baseline to identify PD.
While the same time as using the PCWG-2 criteria, the readers were asked to rate the response by overall visual assessment (standard clinical assessment) as they would in their daily clinical routine: (1) regression, (2) stable disease, or (3) progression.
Biochemical response evaluation
Changes in PSA levels were classified as PD or non-PD. Non-PD was constituted by (1) response (≥50% decrease in PSA level) and (2) stable disease (<50% decrease or <25% increase in PSA). Progressive disease was identified by (a) so-called drifters (an initial response, i.e., ≥50% decrease in PSA followed by progression, i.e., ≥25% increase from the nadir and (b) patients showing progression (≥25% increase in PSA, confirmed by a second measurement) [Citation21,Citation22].
Clinical response evaluation
Clinical response evaluation was performed retrospectively based on the patients’ medical files. The responsible doctors (a urologist when the patient was receiving ADT and NGH and an oncologist when the patient was receiving chemotherapy) reviewed the patients’ medical files and determined the subjective clinical response. The response was classified using a three-point scale: regression, stable disease, or progression. The classification was largely based on performance status, reported pain, and general health. Subsequently, patients were classified as PD (progression) or non-PD (regression and stable disease).
Statistics
The study was exploratory in nature; there was no sample size calculation, and the statistical tests were post-hoc analyses. The proportions of PD vs. non-PD for BS and NaF PET/CT, biochemical and clinical response assessments were compared using McNemar’s test with p < .05 considered statistically significant. Data are presented on a patient-by-patient basis and presented with 95% confidence intervals (95% CI). Crude agreement (the proportion of agreeing image evaluations) and unweighted Cohen’s kappa were used to assess agreement and were reported with 95% confidence intervals (CI). The extent of agreement of kappa values was interpreted according to the terminology by Landis and Koch [Citation16]; kappa 0.00–0.20: slight, 0.21–0.40: fair, 0.41–0.60: moderate, 0.61–0.80: substantial, and 0.81–1.00: almost perfect agreement. All statistical analysis was performed using StataIC version 13, StataCorp LCC, TX, USA.
Approvals
Patients in this study were recruited from two separate studies. Both studies were approved by the Regional Research Ethics committee (numbers N 20130068 and N 20140057) and the Danish Data Protection Agency. The studies were performed in accordance with the Helsinki II declaration with subsequent amendments. The patients received oral and written information about the study and provided written informed consent.
Results
Patients
Sixty-four patients, 23 from the DTA study and 41 from the second study, were included in the present study (). The patients had advanced prostate cancer with median PSA >100 ng/mL, predominantly Gleason 9, and most patients had bone metastases at study entry. The median interval between BS and NaF PET/CT was 8 days (interquartile range 3–17 days). The presence of bone metastases could not be confirmed by the blinded expert readers in four patients by BS and in three of these by NaF PET/CT; all four were from the second study.
Table 1. Patient demographics and baseline characteristics according to treatment.
Among the 28 patients receiving ADT, 18 had follow-up scans at 26 weeks of treatment, and 6 patients at 12 and 26 weeks; furthermore, in 4 patients, the scans were repeated at 4, 12 and 26 weeks. Patients receiving NGH (n = 16) had BS and NaF PET/CT at 12 and 26 weeks. Lastly, patients receiving chemotherapy (n = 20) repeated BS and NaF PET/CT after three series of chemotherapy (approximately week 10), and if they received six series of chemotherapy the scans were repeated at week 20 (13 of 20 patients).
Response evaluation
The proportions of patients showing progression according to PCWG-2 on BS and NaF PET/CT were 22% and 14%, respectively (McNemar’s test, p = .18). In the individual treatment groups, PD was found on BS in 21% for ADT, 19% for NGH, and 25% for chemotherapy versus 11%, 6%, and 25% with NaF PET/CT. The small number of patients in each subgroup did not allow for subgroup analysis. A few patients were classified as PD without a confirmatory scan; this include three ADT patients with the first post-treatment scan at 26 weeks, and one patient with progression after three cycles of chemotherapy who was lost to follow up. Due to the late appearance of radiological progression, PD was accepted without confirmation. All other patients with progression at the first post-treatment scan had at least one additional subsequent scan.
The crude agreement for classifying PD versus non-PD between BS and NaF PET/CT by PCWG-2 criteria during treatment (entry to exit) was 86% (). The agreement was moderate (Cohen’s kappa 0.53, 95% CI: 0.26–0.79). There was a trend that crude agreement declined in patients receiving NGH and chemotherapy compared to patients receiving ADT (). No formal statistical subgroup analysis was performed.
Figure 1. Bar chart showing crude agreement between bone scan (BS) and 18F-sodium fluoride (NaF) PET/CT for the assessment of progressive disease vs. non-progressive disease according the Prostate Cancer Working Group criteria, in total and by treatment. In the total patient group, agreement between the bone scan and NaF PET/CT was slightly higher when looking only at whether there was progression at any time-point during the study period (grey bars) compared with the situation where time of detection of progressive disease was taken into consideration (white bars). For patients receiving androgen-deprivation therapy (ADT), these showed a slight difference, but in the groups receiving either next-generation hormonal therapy (NGH) or chemotherapy, this difference in agreement was even more pronounced. Error bars represent 95% confidence intervals. Twenty-eight patients received androgen deprivation therapy (ADT), 16 patients received next-generating hormones (NGH), and 20 patients received chemotherapy.
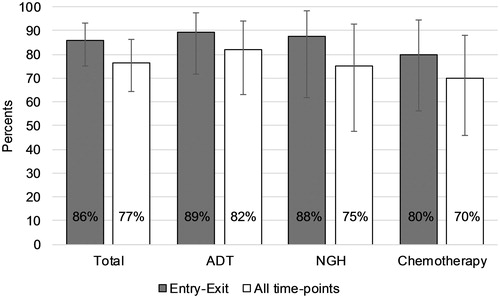
When all individual scan pairs were taken into consideration, the crude agreement among BS and NaF PET/CT for classifying PD/non-PD was 77%. Agreement seemed to decrease from patients receiving ADT to NGH and chemotherapy ().
BS and NaF PET/CT showed conflicting results on disease progression from baseline to the last follow-up or at intermediate scans in 13 patients. In seven of these patients, BS detected PD when NaF PET/CT did not, and in three patients, BS detected PD at an earlier scan than observed with PET/CT.
Comparison of functional imaging, biochemical, and clinical responses
The proportion of patients showing PD on functional imaging or biochemical, and clinical progression are presented by treatment in . In the total study group, biochemical PD was found in more patients (27%) than both BS (22%) and NaF PET/CT (14%), though the differences did not reach statistical significance (p = .65 and p = .10, respectively, McNemar’s test). Clinical progression was found in fewer patients than imaging-based progression and was observed almost exclusively in patients receiving chemotherapy. However, this was not statistically significant (p = .12 and p = .75, respectively by McNemar’s test).
Table 2. Distribution of patients showing progression by BS, NaF PET/CT, PSA, and clinical response assessment.
Baseline image evaluation
At baseline, BS and/or NaF PET/CT confirmed the presence of bone metastases in 58 patients and agreed on the presence or absence of bone metastases in a total of 59/64 patients (92%, 95% CI: 83–97%). In the remaining five patients, bone lesions consistent with bone metastases were detected on NaF PET/CT but not on BS (four from the DTA study and one from the second study).
There was agreement of the extent of disease by BS and NaF PET/CT in 44/64 patients (69%). NaF PET/CT found a higher number of bone lesions in 19/64 patients (30%) (). The proportion of patients with more than 20 lesions on BS and/or NaF PET/CT was 41% for ADT, 63% for NGH, and 89% for chemotherapy.
Table 3. Number of bone metastases at baseline on BS vs. NaF PET/CT in intervals modified from Soloway et al. [Citation20].
Visual assessment
Exact McNemar’s test showed no statistically significant difference in the proportion of patients showing progression, stable disease, or regression on BS vs. NaF PET/CT (p = .14). The crude agreement on disease progression during the study was 69%, and Cohen’s kappa showed moderate agreement (0.50, 95% CI: 0.41–0.54). Cohen’s kappa is by definition affected by the number of categories; therefore, the visual assessment was reclassified into two categories, PD and non-PD, with regression and stable disease combined. This did not notably change the kappa values, which remained moderate (0.42, 95% CI: 0.13–0.70).
Discussion
This is the first study comparing BS and NaF PET/CT in monitoring responses in patients with advanced prostate cancer and bone metastases. We directly compared bone responses to anti-cancer treatment with BS and NaF PET/CT in a prospective exploratory setting and found no statically significant difference in the proportion of PD/non-PD during treatment. Cohen’s kappa showed moderate agreement between BS and NaF PET/CT for the response assessment by the PCWG-2 criteria. The crude agreement between BS and NaF PET/CT was highest for patients receiving ADT but declined in patients receiving NGH and chemotherapy.
The PCWG-2 criteria, which include radiological assessment of bone metastasis by BS, are widely used in clinical trials of prostate cancer [Citation23]. The progression of BS assessed with the PCWG-2 criteria has been associated with impaired overall survival [Citation8], and the classification of PD vs. non-PD using PCWG-2 is reproducible among observers [Citation10]. Thus, the recommendations of BS with the PCWG criteria [Citation24] in clinical guidelines [Citation6,Citation7] are well documented. NaF PET/CT is increasingly used in prostate and non-prostate cancer imaging [Citation25,Citation26]. In contrast, the recommendations for the use of NaF PET/CT for treatment monitoring are modest and vaguely supported by clinical data [Citation19,Citation25].
Several papers have reported improved detection rates of malignancy-suspected lesions by NaF PET/CT versus BS [Citation19,Citation27]. Our data confirmed these findings by showing a number of patients classified with bone metastases at baseline by NaF PET/CT but not BS. Properly designed diagnostic test accuracy studies have confirmed that the sensitivity and specificity of NaF PET/CT may be superior to BS [Citation28–30]. Whether these improved diagnostic characteristics lead to improvements in patient management remains unclear. Several large cohort studies have reported changes in patient management with NaF PET/CT vs. standard imaging, but due to a lack of randomized controlled trials, it remains unclear whether the change was in favor of improved patient outcome [Citation25,Citation26].
The current study found no significant differences in the classification of PD vs. non-PD by BS and NaF PET/CT. However, the crude agreements and kappa values were not quite satisfactory. The results indicated that NaF PET/CT detected more lesions at baseline but detected less patients with subsequent PD than BS. This inconsistency might be caused by the appearance of bone lesions on follow-up BS that were already visible on the baseline NaF PET/CT. We acknowledge that the size of the study as well as the heterogeneous study population may be limitations for the power of the statistical analyses.
Biochemical progression was found in a larger proportion of patients in comparison to BS and NaF PET/CT. This is in line with previous studies showing that the progression of PSA often precedes radiographic progression [Citation31,Citation32]. In a mixed population of castration-sensitive and castration-resistant patients with prostate cancer with and without known bone metastases who received a variety of treatments, Apolo et al. demonstrated that changes in standardized uptake values (SUV) on NaF PET/CT correlated with changes in PSA [Citation14]. Two minor studies in patients receiving the alpha-emitting radionuclide radium-223 showed changes in SUV after treatment. In most patients, this change was accompanied by changes in PSA [Citation15,Citation16]. These data are thus in line with our data, as some patients showed imaging progression before biochemical progression and vice versa. Nome et al. [Citation33] investigated the concordance between changes in PSA, bone markers and BS in patients with prostate cancer receiving radium-223. They showed a mixed response on BS, with new lesions appearing simultaneously with reduced tracer uptake in existing lesions. However, BS changes were accompanied by increases in PSA at six months. The concordance between BS and PSA responses has been reported in several trials with NGH and/or chemotherapy [Citation34–36].
A flare reaction may be seen on BS early during anti-cancer treatment. The phenomenon has been solidly documented with BS, occurring in approximately 20% of the patients [Citation36,Citation37]. A notable proportion of patients with an early flare may not be classified as PD on subsequent scans [Citation37]. The potential impact of the flare has been incorporated into the PCWG criteria with the ‘2 + 2’ rule. The vast majority of patients in this study with a flare or apparent progression at the first scan after the baseline scan had one or more subsequent scans, which allowed firm classification of disease progression. A few patients were classified as PD without a confirmatory scan; we found this appropriate given the scan mostly occurred 6 months after the baseline scan, at a time where any flare is known to have vanished [Citation16,Citation36,Citation37].
An issue however would arise if the flare appeared differently, in intensity and/or time, on BS and NaF PET/CT. Flare reactions have been described with NaF PET/CT, though shown in small trials with inconsistent results [Citation16,Citation38,Citation39], but no studies have compared flare simultaneously by BS and NaF PET/CT. The pathophysiology behind the visualization of bone lesions by BS and NaF PET/CT are slightly different [Citation19]. Still, both methods are indirect methods showing reactive bone reactions, they do not directly visualize tumor tissue. The fact that the methods are not identical in terms of the mode of action may question if results from NaF PET/CT can be directly adapted to a reporting system like PCGW, which was generated from BS data. This is of particular interest with PET tracers with direct visualization of tumor tissue, like 18F/11C-choline and 18F/68Ga-prostate-specific membrane antigen PET/CT.
Images were also read by subjective visual assessment. Like the PCWG criteria, there was no significant difference in the proportion of PD vs non-PD between BS and NaF PET/CT when visually read. The crude agreement between BS and NaF PET/CT was lower for the subjective visual read compared with the use of the PCWG criteria. This was not explained by the higher number of disease categories since the agreement actually declined when combining the three categories into a dichotomous response. Similar to the findings with PCWG criteria, agreement decreased from ADT to NGH and chemotherapy.
In conclusion, there was no significant difference in the proportion of patients showing PD by BS and NaF PET/CT. However, kappa analysis showed only moderate agreement, and the crude agreement tended to decrease from ADT over NGH to chemotherapy. The results emphasize that the two imaging methods may not be readily exchangeable in the monitoring of the treatment effect in prostate cancer. Even though quantitative NaF data have emerged to show important prognostic information during anti-cancer treatment [Citation40,Citation41], large comparative trials are required to provide more detailed information about the predictive role of disease classification by NaF PET/CT as well as other PET tracers versus BS.
Acknowledgments
All procedures performed in the studies involving human participants were in accordance with the ethical standards of the institutional and/or national research committee and with the 1964 Helsinki declaration and its later amendments or comparable ethical standards. The study was approved by the Regional Research Ethics committee (N-20130068 and N-20140057) and the Danish Data Protection Agency.
Informed consent was obtained from all individual participants included in the study.
Disclosure statement
LJP has received a research grant from The Obel Family Foundation and has received an honorarium for speaking at a symposium from Janssen and financial support for attending symposia/congresses from Bayer. The other authors declare that they have no conflict of interest.
Additional information
Funding
References
- Siegel RL, Miller KD, Jemal A. Cancer statistics, 2016. CA Cancer J Clin. 2016;66:7–30.
- Ferlay J, Steliarova-Foucher E, Lortet-Tieulent J, et al. Cancer incidence and mortality patterns in Europe: estimates for 40 countries in 2012. Eur J Cancer. 2013;49:1374–1403.
- Pilon D, Queener M, Lefebvre P, et al. Cost per median overall survival month associated with abiraterone acetate and enzalutamide for treatment of patients with metastatic castration-resistant prostate cancer. J Med Econ. 2016;19:777–784.
- Sanyal C, Aprikian AG, Cury FL, et al. Management of localized and advanced prostate cancer in Canada: a lifetime cost and quality-adjusted life-year analysis. Cancer. 2016;122:1085–1096.
- Savage P, Mahmoud S. Development and economic trends in cancer therapeutic drugs: a 5-year update 2010–2014. Br J Cancer. 2015;112:1037–1041.
- Heidenreich A, Bastian PJ, Bellmunt J, et al. EAU guidelines on prostate cancer. part 1: screening, diagnosis, and local treatment with curative intent-update 2013. Eur Urol. 2014;65:124–137.
- Mohler JL, Armstrong AJ, Bahnson RR, et al. Prostate cancer, version 1.2016. J Natl Compr Canc Netw. 2016;14:19–30.
- Sonpavde G, Pond GR, Armstrong AJ, et al. Radiographic progression by Prostate Cancer Working Group (PCWG)-2 criteria as an intermediate endpoint for drug development in metastatic castration-resistant prostate cancer. BJU Int. 2014;114:E25–E31.
- Zacho HD, Manresa JA, Mortensen JC, et al. Observer agreement and accuracy in the evaluation of bone scans in newly diagnosed prostate cancer. Nucl Med Commun. 2015;36:445–451.
- Fonager RF, Zacho HD, Albertsen S, et al. Observer agreement of treatment responses on planar bone scintigraphy in prostate cancer patients: importance of the lesion assessment method. Nucl Med Commun. 2017;38:215–221.
- Cornford P, Bellmunt J, Bolla M, et al. EAU-ESTRO-SIOG guidelines on prostate cancer. Part II: treatment of relapsing, metastatic, and castration-resistant prostate cancer. Eur Urol. 2017;71:630–642.
- Mottet N, Bellmunt J, Bolla M, et al. EAU-ESTRO-SIOG guidelines on prostate cancer. Part 1: screening, diagnosis, and local treatment with curative intent. Eur Urol. 2017;71:618–629.
- Thompson I, Thrasher JB, Aus G, et al. Guideline for the management of clinically localized prostate cancer: 2007 update. J Urol. 2007;177:2106–2131.
- Apolo AB, Lindenberg L, Shih JH, et al. Prospective study evaluating Na18F PET/CT in predicting clinical outcomes and survival in advanced prostate cancer. J Nucl Med. 2016;57:886–892.
- Cook G Jr, Parker C, Chua S, et al. 18F-fluoride PET: changes in uptake as a method to assess response in bone metastases from castrate-resistant prostate cancer patients treated with 223Ra-chloride (Alpharadin). EJNMMI Res. 2011;1:4.
- Kairemo K, Joensuu T. Radium-223-dichloride in castration resistant metastatic prostate cancer-preliminary results of the response evaluation using F-18-Fluoride PET/CT. Diagnostics (Basel). 2015;5:413–427.
- Fonager RF, Zacho HD, Langkilde NC, et al. (18)F-fluoride positron emission tomography/computed tomography and bone scintigraphy for diagnosis of bone metastases in newly diagnosed, high-risk prostate cancer patients: study protocol for a multicentre, diagnostic test accuracy study. BMC Cancer. 2016;16:10.
- Van den Wyngaert T, Strobel K, Kampen WU, et al. The EANM practice guidelines for bone scintigraphy. Eur J Nucl Med Mol Imaging. 2016;43:1723–1738.
- Beheshti M, Mottaghy FM, Payche F, et al. (18)F-NaF PET/CT: EANM procedure guidelines for bone imaging. Eur J Nucl Med Mol Imaging. 2015;42:1767–1777.
- Soloway MS, Hardeman SW, Hickey D, et al. Stratification of patients with metastatic prostate cancer based on extent of disease on initial bone scan. Cancer. 1988;61:195–202.
- Bubley GJ, Carducci M, Dahut W, et al. Eligibility and response guidelines for phase II clinical trials in androgen-independent prostate cancer: recommendations from the Prostate-Specific Antigen Working Group. J Clin Oncol. 1999;17:3461–3467.
- Scher HI, Halabi S, Tannock I, et al. Design and end points of clinical trials for patients with progressive prostate cancer and castrate levels of testosterone: recommendations of the Prostate Cancer Clinical Trials Working Group. J Clin Oncol. 2008;26:1148–1159.
- Morris MJ, Autio KA, Basch EM, et al. Monitoring the clinical outcomes in advanced prostate cancer: what imaging modalities and other markers are reliable? Semin Oncol. 2013;40:375–392.
- Scher HI, Morris MJ, Stadler WM, et al. Trial design and objectives for castration-resistant prostate cancer: updated recommendations from the Prostate Cancer Clinical Trials Working Group 3. J Clin Oncol. 2016;34:1402–1418.
- Hillner BE, Siegel BA, Hanna L, et al. Impact of 18F-fluoride PET in patients with known prostate cancer: initial results from the National Oncologic PET Registry. J Nucl Med. 2014;55:574–581.
- Hillner BE, Siegel BA, Hanna L, et al. Impact of (18)F-Fluoride PET on intended management of patients with cancers other than prostate cancer: results from the National Oncologic PET Registry. J Nucl Med. 2014;55:1054–1061.
- Even-Sapir E, Metser U, Mishani E, et al. The detection of bone metastases in patients with high-risk prostate cancer: 99mTc-MDP Planar bone scintigraphy, single- and multi-field-of-view SPECT, 18F-fluoride PET, and 18F-fluoride PET/CT. J Nucl Med. 2006;47:287–297.
- Fonager RF, Zacho HD, Langkilde NC, et al. Diagnostic test accuracy study of (18)F-sodium fluoride PET/CT, (99m)Tc-labelled diphosphonate SPECT/CT, and planar bone scintigraphy for diagnosis of bone metastases in newly diagnosed, high-risk prostate cancer. Am J Nucl Med Mol Imaging. 2017;7:218–227.
- Lofgren J, Mortensen J, Rasmussen SH, et al. A Prospective Study Comparing (99m)Tc-Hydroxyethylene-Diphosphonate Planar Bone Scintigraphy and Whole-Body SPECT/CT with (18)F-Fluoride PET/CT and (18)F-Fluoride PET/MRI for Diagnosing Bone Metastases. J Nucl Med. 2017;58:1778–1785.
- Minamimoto R, Loening A, Jamali M, et al. Prospective Comparison of 99mTc-MDP Scintigraphy, Combined 18F-NaF and 18F-FDG PET/CT, and Whole-Body MRI in Patients with Breast and Prostate Cancer. J Nucl Med. 2015;56:1862–1868.
- Beer TM, Armstrong AJ, Rathkopf DE, et al. Enzalutamide in metastatic prostate cancer before chemotherapy. N Engl J Med. 2014;371:424–433.
- Ryan CJ, Smith MR, de Bono JS, et al. Abiraterone in metastatic prostate cancer without previous chemotherapy. N Engl J Med. 2013;368:138–148.
- Nome R, Hernes E, Bogsrud TV, et al. Changes in prostate-specific antigen, markers of bone metabolism and bone scans after treatment with radium-223. Scand J Urol. 2015;49:211–217.
- Anand A, Morris MJ, Larson SM, et al. Automated Bone Scan Index as a quantitative imaging biomarker in metastatic castration-resistant prostate cancer patients being treated with enzalutamide. EJNMMI Res. 2016;6:23.
- Mitsui Y, Shiina H, Yamamoto Y, et al. Prediction of survival benefit using an automated bone scan index in patients with castration-resistant prostate cancer. BJU Int. 2012;110:E628–E634.
- Ryan CJ, Shah S, Efstathiou E, et al. Phase II study of abiraterone acetate in chemotherapy-naive metastatic castration-resistant prostate cancer displaying bone flare discordant with serologic response. Clin Cancer Res. 2011;17:4854–4861.
- Morris MJ, Molina A, Small EJ, et al. Radiographic progression-free survival as a response biomarker in metastatic castration-resistant prostate cancer: COU-AA-302 results. J Clin Oncol. 2015;33:1356–1363.
- Cook GJ, Fogelman I. Detection of bone metastases in cancer patients by 18F-fluoride and 18F-fluorodeoxyglucose positron emission tomography. Q J Nucl Med 2001;45:47–52.
- Weisman A, Harmon S, Perk T, et al. WE-FG-202-05: quantification of bone flare on [F-18] NaF PET/CT in metastatic prostate cancer. Med Phys. 2016;43:3827–3827.
- Harmon SA, Perk T, Lin C, et al. Quantitative assessment of early [(18)F]sodium fluoride positron emission tomography/computed tomography response to treatment in men with metastatic prostate cancer to bone. J Clin Oncol. 2017;35:2829–2837.
- Lindgren Belal S, Sadik M, Kaboteh R, et al. 3D skeletal uptake of (18)F sodium fluoride in PET/CT images is associated with overall survival in patients with prostate cancer. EJNMMI Res. 2017;7:15.