
Abstract
Background: The cost of cancer and outcomes of cancer care have been discussed a lot since cancer represents 3–6% of total healthcare costs and cost estimations have indicated growing costs. There are studies considering the cost of all cancers, but studies focusing on the cost of disease and outcomes in most common cancer sites are limited. The objective of this study was to analyze the development of the costs and outcomes in Finland between 2009 and 2014 per cancer site.
Methods: The National cost, episode and outcomes data were obtained from the National register databases based on International Statistical Classification of Diseases (ICD)-10 diagnosis codes. Cost data included both the direct and indirect costs. Two hospitals were used to validate the costs of care. The outcome measures included relative survival rate, mortality, sick leave days per patient and number of new disability pensions.
Findings: The outcomes of cancer care in most common cancer sites have improved in Finland between 2009–2014. The real costs per new cancer patient decreased in seven out of ten most common cancer sites. The significance of different cost components differ significantly between the different cancer sites. The share of medication costs of the total cost of all cancers increased, but decreased for the five most common cancer sites.
Interpretation: The changes in the cost components indicate that the length of stay has shortened in special care and treatment methods have developed towards outpatient care. This partially explains the decrease of costs. Also, at the same time outcomes improved, which indicates that decrease in costs did not come at the expense of treatment quality. As the survival rates increase, the relevance of mortality measures decreases and the relevance of other, patient-relevant outcome measures increases. In the future, the outcomes and costs of health care systems should be assessed routinely for the most common patient groups.
Introduction
Cancer causes a significant economic burden for many countries. For example, in 2009 in Europe cancer treatment costs were 51 billion euros, representing 3–6% of total healthcare costs in European countries [Citation1]. With an aging population, the number of new cancer patients is increasing and this is expected to continue in the future [Citation2–4]. In addition, new and expensive medicines are being introduced in cancer care. Hence, there is increasing concern over whether we will be able to provide affordable cancer care to all in the future [Citation5].
There are several studies on the cost of cancer, covering most high-income countries (e.g., [Citation1,Citation6–11]). There are also some studies that present predictions on the development of cancer costs in the future [Citation6,Citation7]. However, as identified by Tangka et al. [Citation9] and Torkki et al. [Citation12] the cost components driving cancer costs have developed quite differently in the past. There is a growing trend towards outpatient care, which has decreased inpatient care costs significantly. At the same time, medication costs have increased but the indirect costs related to lost productivity have decreased slightly.
Number of new patients registered is the most significant cost driver. The number of patients is increasing due to the aging of population in developed countries, but there are significant differences in the number of new cancer patients amongst the different cancer sites: number of prostate, breast, skin, colon and rectum cancer patients are on the rise but the number of stomach cancer patients is decreasing [Citation13]. Incidence of lung cancer is decreasing in men and slightly increasing in women, however, the number of new cases is increasing in both sexes.
The cost of cancer varies significantly between countries, but it also varies significantly between cancer sites [Citation1,Citation14]. For example, the treatment costs of breast cancer is estimated to be on average in the range of 20,000–60,000 EUR per patient depending on the stage of cancer at the time of diagnosis in Norway and Canada [Citation15,Citation16] and 60,000–135,000 USD in the US [Citation17]. For prostate cancer the average cost of treatment per patient is in the range of 8000–18,000 EUR for some European countries and the US [Citation18]. In England, colorectal cancer had the highest treatment costs per incidence and lung cancer is the lowest occurring cancers among the most common cancer sites [Citation19].
Thus, when evaluating future trends in cancer cost the diverging development in the number of new patients and the differences in cost per patient amongst different cancer sites, as well as the different trends in cost drivers should be taken into account.
The aim of this study is to evaluate the cost of cancer in different cancer types in Finland and analyze the changes in the cost drivers between 2009 and 2014. The results are compared against changes in treatment and outcome measures during the same period.
Methods
Cancer was defined in this study using the WHO International Classification of Diseases, 10th revision (ICD-10) codes C00–97 [Citation20]. Data were collected based on this definition. This study focuses on the costs of 10 cancer sites that cause the most costs in Finland: breast cancer (C50), prostate cancer (C61), colorectal cancer (C18-21), lung cancer (C33-34), leukemia (C91-95), Non-Hodgkin (C82-86, C96), brain cancer (C71), pancreatic cancer (C25), ovarian cancer (C56) and stomach cancer (C16).
Cost framework
The cost framework followed the one used in Torkki et al. [Citation12]. We evaluated the costs of common cancer sites on a population level, including treatment and indirect costs. Costs were estimated for two years: 2009 and 2014. All costs are expressed in 2014 prices, adjusted using the consumer price index [Citation21]. All treatment costs are reported as gross costs; that is, including both the public expenditure and the patients co-payment or deductible.
Treatment costs include the costs of primary and secondary care, as well as the cost of cancer screening. However, the costs of prevention or health promotion were not included, due to lack of data. Indirect costs include both sick leave (exceeding 10 working days) and disability pensions defined as the amount of benefits paid to patients in the form of compensations or pensions. This approach was used in order to quantify the amount of public funds used to pay for the social benefits, rather than to estimate the value of lost productivity to the employers or society as a whole. Mortality was not included in the indirect costs, as lost productivity due to mortality is questionable when there exists unemployment and other limitations as described by Brown et al. [Citation22].
The cost of care was obtained by multiplying the number of inpatient episodes and outpatient visits by respective unit costs. The unit costs of the inpatient episodes and outpatient visits for each specialty, as well as for primary care in 2011, were based on the National price list documented in a publication by the National Institute for Health and Welfare [Citation23]. These costs include all costs of production such as doctors salaries, nursing, medication administered in the hospital, materials, facilities and equipment costs. We used patient-level activity-based costing (ABC) data from the largest university hospital and central hospital in Finland to calculate the percentage changes in the unit costs of care between 2009 and 2014. These estimates were applied to the National price list data from 2011 to correct the unit costs for 2009 and 2014.
The costs of outpatient medication not administered in the hospital is reimbursed by the National Social Insurance Institution (SII) and the data on reimbursements was obtained from SII registries based on SII reimbursement codes. The codes are either disease-specific (most medicines) or medicine-specific (new and expensive medicines). To estimate the total medication cost that combines both hospital and outpatient medication, the share of medication cost in the inpatient episodes and outpatient visits was estimated from the patient-level activity-based costing (ABC) from the two hospitals. However, only the medication costs of the five most common cancer sites are recorded separately in the hospitals ABC system.
The traveling costs of the patients were estimated from the number of visits and inpatient episodes, while the average distances traveled were based on the location model analysis of Venesmaa’s research [Citation24]. The cost per kilometer was defined using the compensation level approved by the Finnish Tax Administration [Citation25].
The total cost per patient for each cancer site was estimated by dividing the annual total costs by number of new cancer patients, since we did not have the patient-level costs. Also the cost of disability pensions was divided by the number of new cancer patients even though it is a long term cost, because prevalence data was not available separately for working-age patients. Therefore, the indirect cost per patient are overestimated especially in cancers in which the patients are relatively young and survival rates are quite high, such as for leukemia.
The data used in the study are from National registries (National Institute for Health and Welfare, National Social Insurance Institution and Cancer Registry). The more detailed description of the data sources and how the cost components were estimated from the data is presented in Torkki et al.’s study [Citation12].
Outcomes framework
We estimated the effectiveness of cancer care using relative survival rate, age-adjusted mortality, the number of disability pensions and the number of sick leave days as outcome measures. Relative survival rates indicate the proportion of patients who stay alive for a certain interval (such as one or five years) after cancer diagnosis, compared to the proportion of people of the same age in the same area who stay alive during the same interval. The relative survival ratio can be interpreted as an estimation of expected survival probability in a situation in which the patient’s cancer is the only possible cause of death. The reason for also using age-adjusted mortality was the possibility of improved screening and diagnostics. Earlier diagnosis may increase the short-term survival rates, even if the long-term outcome would be similar. Using both survival and mortality rates, decreases uncertainty over the interpretation of results. The relative survival rates, age-adjusted mortality of the cancer patients and the annual number of new cancer patients were obtained from the Finnish Cancer Registry.
The number of new disability pensions per year and the sick leave data obtained from the SII included both number of sick leave episodes and days. These data complement the survival and mortality rates, being proxy measures for functionality. The cost per new cancer patient was used as the cost measure.
Results
The total cost of the 10 cancer sites causing the most costs was approximately 610 M€ in 2014 accounting for two thirds percent of cost of all cancers (). Breast cancer had the greatest share of costs for both 2009 and 2014 shaping one fifth of the total cost of cancer. The order of the cancer sites was similar in both years although there were differences in the growth of costs by cancer site. Interestingly, the share of the cost of the top ten cancer sites from total cancer costs decreased from 2009 (71%) to 2014 (66%).
Table 1. The actual costs of cancer by ten most cost causing cancer sites.
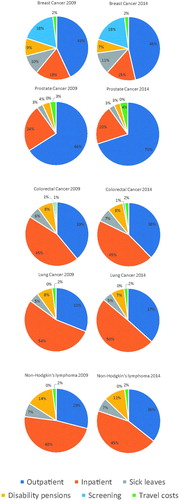
The cost distribution varies significantly by cancer site (). The share of treatment costs was lowest (62%) in breast cancer and highest in prostate cancer (92%) in 2014. Costs of screening are significant only in breast cancer. The share of inpatient costs and disability pensions decreased and the share of outpatient costs increased in all cancer sites except for colorectal cancer between 2009 and 2014.
Figure 1. The cost distribution of five most cost-causing cancer sites in 2009 and 2014.
The share of medication costs (hospital- and patient-administered) varies between cancer sites, but is on average almost 30% of total costs (). The share of medication costs of all cancer costs increased from 2009 to 2014. However, in the most common cancer sites, the share of medication costs slightly decreased, except for lung cancer treatments. In all cancers both the costs of self-administered, outpatient medication and the costs of hospital-administered inpatient and outpatient medication increased on an average of 6% annually. In the five most common cancers the cost of self-administered medication decreased and the costs of hospital-administered medication increased.
Figure 2. Share of medication costs of all cancer costs in the five most common cancer sites in years 2009 and 2014.
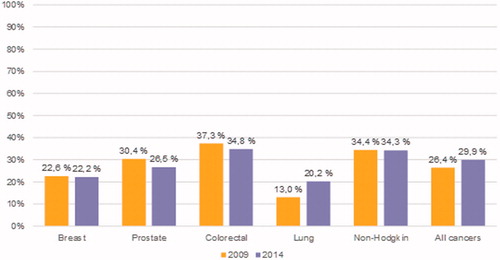
The annual number of new patients increased most rapidly in leukemia () and decreased in ovarian cancer. The real cost per new cancer patient decreased on average of 1% per year and the decrease was most rapid in leukemia and Non-Hodgkin’s lymphoma. The real cost per new patient increased in pancreatic, ovarian and brain cancer. Age-adjusted mortality decreased in all cancer sites except for colorectal, brain and pancreatic cancer.
Table 2. Number of new patients, real costs per new patient (in 2014 prices) and mortality by cancer site in 2009 and 2014.
The change in sick leave days per working-age patient varied depending on the cancer site, but on average there was not a great significant change (). The disability pensions decreased in all cancer sites besides pancreas and the decrease was on average of 2% per year.
Table 3. The sick leaves and disability pensions related to common cancers in Finland between 2009 and 2014.
Discussion
There are studies considering the cost of all cancers, but studies focusing the cost of cancer sites are limited. Most of the earlier studies have assessed the treatment costs [Citation14–19] but not the other costs and they are cross-sectional. We found that costs other than treatment costs are substantial and they vary depending on the cancer site. In addition, the cost trends differ in different cancer sites. Future research should take these into account.
The outcomes of cancer care in most common cancer sites have improved in Finland between 2009–2014. The survival rates in Finland have been among the best European countries in earlier studies [Citation26–29]. Mortality and disability pensions have been decreasing, but there are differences in sick leave applications depending on the cancer site. As the survival rates increase, the relevance of mortality measures decreases and the relevance of other outcome measures increases. Thus, in the future, the routine collection of outcomes should include more patient-relevant measures including health status and functionality [Citation30].
The real costs per new cancer patient decreased in seven out of ten most common cancer sites. The changes in the cost distributions indicate that the length of stay has shortened in special care and treatment methods have developed towards outpatient care. This partially explains the decrease of costs. In addition, the cost of disability pensions has been decreasing.
The share of medication costs increased in all cancers in total, but decreased in five most common cancer sites. This indicates more rapid growth of medication costs in more uncommon cancer sites. In most common cancer sites, the cost of established medication has decreased and the share of new more expensive medications seems not to be significant, at least not yet. The data did not allow for the allocation of medication costs to other cancers than the five most common ones. However, in the future it is important to be able to examine medication costs for each cancer site, as the medication costs are increasing in total and the new, expensive immunological medications are emerging.
In an earlier study of cancer cost in Finland by Mäklin et al. in 2006 [Citation8] estimated that ‘new expensive treatments’ will cause the costs to rise significantly by 2.6–8.5% per year. An earlier study by Torkki et al. [Citation12] found that the growth of total costs were only 1.7% per year. This study indicates that one of the major reasons for cancer cost decrease is standardization which occurs in high volume operations. The treatment protocols in the most common cancer sites are standardized leading to shorter length of stays. At the same time, the most commonly used medications costs go down as they are losing the patents.
Many Western Healthcare systems have the pressure to stabilize the budget for health services since the costs has been growing more rapidly than the Gross National Product (GNP). Although our study reported lower growth of costs than expected, the cost of cancer increased by 3. 8% in ten years compared to the growth of GNP. Aging countries may also have limited opportunities in growth of GNP in the next decades. This means that the new care protocols including medications have to be affordable and the National budgets may constraint the use of very expensive treatment to limited specific patient groups. Based on our studies, the cost of cancer may slightly increase in the future due to the increased number of cancer patients but the cost per patient may continue decreasing.
In the future, the outcomes and costs of health care systems should be assessed routinely using the most common patient groups [Citation30]. Combining total costs of disease to patient-relevant outcomes gives better understanding of the healthcare system than the methods that have traditionally being used to evaluate it.
Disclosure statement
No potential conflict of interest was reported by the authors.
Additional information
Funding
References
- Luengo-Fernandez R, Leal J, Gray A, et al. Economic burden of cancer across the European Union: a population-based cost analysis. Lancet Oncol. 2013;14:1165–1174.
- Ferlay J, Shin HR, Bray F, et al. Estimates of worldwide burden of cancer in 2008: GLOBOCAN 2008. Int J Cancer. 2010;127:2893–2917.
- Møller H, Fairley L, Coupland V, et al. The future burden of cancer in England: incidence and numbers of new patients in 2020. Br J Cancer. 2007;96:1484–1488.
- Jönsson B, Wilking N. The burden and cost of cancer. Ann Oncol. 2007;18:8–22.
- Sullivan R, Peppercorn J, Sikora K, et al. Delivering affordable cancer care in high-income countries. Lancet Oncol. 2011;12:933–980.
- Mariotto AB, Yabroff KR, Shao Y, et al. Projections of the cost of cancer care in the United States: 2010–2020. J Natl Cancer Inst. 2011;103:117–128.
- Institutet för Hälso-och Sjukvårdsekonomi (Institute of Health and Health Economics; IHE).Kostnader för cancer I Sverige idag och år 2040 [Institute of Health and Health Economics (IHE). Cancer costs in Sweden today and year 2040]. IHE Rapport 2016:1. Available from: http://res.cloudinary.com/cancerfonden/image/upload/v1459776752/documents/ihe-rapport-2016.pdf
- Mäklin S, Rissanen P. Syöpien aiheuttamat kustannukset: Hoito- ja tuottavuuskustannusten kehitys vuosina 1996–2004 ja ennuste niiden muutoksista vuoteen 2015. [Costs caused by cancers: Development of cost of care and productivity in 1996–2004 and forecast of their changes by 2015] Suomen Syöpäyhdistyksen Julkaisuja [Publications of the Finnish Cancer Society]. 2006. [in Finnish].
- Tangka FK, Trogdon JG, Richardson LC, et al. Cancer treatment cost in the United States: has the burden shifted over time? Cancer. 2010;116:3477–3484.
- Bradley CJ, Yabroff KR, Dahman B, et al. Productivity costs of cancer mortality in the United States: 2000–2020. J Natl Cancer Inst. 2008;100:1763–1770.
- Warren JL, Yabroff KR, Meekins A, et al. Evaluation of trends in the cost of initial cancer treatment. J Natl Cancer Inst. 2008;100:888–897.
- Torkki P, Leskelä R, Linna M, et al. Cancer costs and outcomes in the Finnish population 2004–2014. Acta Oncologica. 2018; 57:297–303.
- Finnish Cancer Registry. 2016 [Internet]. Cancers in 2030. Available from: https://www.cancersociety.fi/publications/reports/cancer-in-finland-2016/cancers-in-2030/
- Yabroff KR, Lamont E, Mariotto A, et al. Cost of care for elderly cancer patients in the United States. J Natl Cancer Inst. 2008;100:630–641.
- Mittmann N, Porter JM, Rangrei J, et al. Health system costs for stage-specific breast cancer: a population-based approach. Curr Oncol. 2017;21:281–293.
- Mogen TA, Bjørnelv GMW, Aas E. Expected 10-year treatment cost of breast cancer detected within and outside a public screening program in Norway. Eur J Health Econ. 2016;17:745–754.
- Blumen H, Fitch K, Polkus V. Comparison of treatment costs for breast cancer, by tumor stage and type of service. Am Health Drug Benefits. 2016;9:23–32.
- Roehrborn CG, Black LK. The economic burden of prostate cancer. BJU Int. 2011;108:806–813.
- Laudicella M, Walsh B, Burns E, et al. Cost of care for cancer patients in England: evidence from population-based patient-level data. Br J Cancer. 2016; 114:1286–1292.
- World Health Organisation. International Classification of Diseases, 10th revision (ICD-10). Malta; 2011.
- Statistics Finland [Internet]. 2017. Available from: http://www.stat.fi/index_en.html
- Brown ML, Lipscomb J, Snyder C. The burden of illness of cancer: economic cost and quality of life. Annu Rev Public Health. 2001;22:91–113.
- National Institute for Health and Welfare. Health expenditure and financing 2014 [Internet]. Available from: http://www.julkari.fi/handle/10024/130783
- Venesmaa J. Organizing a maternity care service network [Licenciate thesis]. Espoo: Aalto University; 2011.
- Finnish Tax Administration [Internet]. Available from: https://www.vero.fi/en-US
- Allemani C, Weir HK, Carreira H, et al. Global surveillance of cancer survival 1995–2009: analysis of individual data for 25 676 887 patients from 279 population-based registries in 67 countries (CONCORD-2). Lancet. 2015; 385:977–1010.
- De Angelis R, Sant M, Coleman MP, et al. Cancer survival in Europe 1999–2007 by country and age: results of EUROCARE-5—a population-based study. Lancet Oncol. 2014;15:23–34.
- Sankaranarayanan R, Swaminathan R, Brenner H, et al. Cancer survival in Africa, Asia, and Central America: a population-based study. Lancet Oncol. 2010;11:165–173.
- Coleman MP, Forman D, Bryant H, et al. Cancer survival in Australia, Canada, Denmark, Norway, Sweden, and the UK, 1995-2007 (the International Cancer Benchmarking Partnership): an analysis of population-based cancer registry data. Lancet. 2011;377:127–138.
- Porter ME. What is value in health care? N Engl J Med. 2010; 363:2477–2481.