
Abstract
Background: Radiomics is a promising methodology for quantitative analysis and description of radiological images using advanced mathematics and statistics. Tumor delineation, which is still often done manually, is an essential step in radiomics, however, inter-observer variability is a well-known uncertainty in radiation oncology. This study investigated the impact of inter-observer variability (IOV) in manual tumor delineation on the reliability of radiomic features (RF).
Methods: Three different tumor types (head and neck squamous cell carcinoma (HNSCC), malignant pleural mesothelioma (MPM) and non-small cell lung cancer (NSCLC)) were included. For each site, eleven individual tumors were contoured on CT scans by three experienced radiation oncologists. Dice coefficients (DC) were calculated for quantification of delineation variability. RF were calculated with an in-house developed software implementation, which comprises 1404 features: shape (n = 18), histogram (n = 17), texture (n = 137) and wavelet (n = 1232). The IOV of RF was studied using the intraclass correlation coefficient (ICC). An ICC >0.8 indicates a good reproducibility. For the stable RF, an average linkage hierarchical clustering was performed to identify classes of uncorrelated features.
Results: Median DC was high for NSCLC (0.86, range 0.57–0.90) and HNSCC (0.72, 0.21–0.89), whereas it was low for MPM (0.26, 0–0.9) indicating substantial IOV. Stability rate of RF correlated with DC and depended on tumor site, showing a high stability in NSCLC (90% of total parameters), acceptable stability in HNSCC (59% of total parameters) and low stability in MPM (36% of total parameters). Shape features showed the weakest stability across all tumor types. Hierarchical clustering revealed 14 groups of correlated and stable features for NSCLC and 6 groups for both HNSCC and MPM.
Conclusion: Inter-observer delineation variability has a relevant influence on radiomics analysis and is strongly influenced by tumor type. This leads to a reduced number of suitable imaging features.
Introduction
Heterogeneity, not only between tumors but also within a tumor, is a well-known cancer-related phenomenon and was hypothesized to be one of the major causes for the varying effectiveness of anticancer treatment [Citation1,Citation2]. In the era of personalized medicine there is a need to adapt the treatment according to tumor phenotype. It is, therefore, important to extract and assess the characteristics of a tumor. Biopsy and subsequent molecular analyses provide highly relevant information but do not fully characterize the spatial and temporal heterogeneity of tumors.
This explains the potential of imaging-derived biomarkers. Radiomics is a method to describe and quantify shape, intensity and texture of a tumor by extracting and analyzing hundreds of quantitative features from radiological images [Citation3]. In order to generate clinically relevant imaging biomarker, the extracted features for radiomics analysis need to be robust. However, variations in the radiomics workflow can induce feature variability [Citation4–6]. One important step in the radiomics workflow is the delineation of the tumor, which is currently still a manual process. Inter-observer variability in the delineation process is a well-known uncertainty in radiation oncology [Citation7–10]. Such differences in delineation of the tumor could potentially lead to unstable results in the radiomics analysis. Few studies have already addressed this issue, but all the studies were limited to one single cancer type and all have analyzed PET images [Citation11–13].
We, therefore, aimed to assess the impact of inter-observer variability in manual tumor delineation on the stability of radiomic features in three different cancer types, for which we expected large differences in the inter-observer variability. Along with stability of radiomic features in the respective cancer type, we aimed to compare the robustness in different tumor sites.
Material and methods
Studied cohorts of patients and tumor delineation
Three different tumor types were included: head and neck squamous cell carcinoma (HNSCC), non-small cell lung cancers (NSCLC) and malignant pleural mesothelioma (MPM). For each type eleven tumors were analyzed. Patients, respectively tumors, were randomly selected and do not belong to another trial. Despite the small cohorts of patients, the high acceptance level in ICC allowed to keep the type I and type II errors at the 0.05 and 0.20 levels, respectively [Citation14]. In NSCLC, four tumors were stage I/II, the other seven stage III. In the group of HNSCC all eleven tumors were stage III/IV, four of them were located in the supraglottic larynx, four in the oropharynx, two in the hypopharynx and one in the oral cavity. In MPM, all eleven tumors were T3. The study was approved by the local ethics commission.
For each site, the gross tumor volume of the primary cancer of eleven patients was contoured independently by three radiation oncologists on pretreatment planning CT scans. In HNSCC but not NSCLC or MPM, planning CT images were acquired after application of intravenous contrast. Contouring of NSCLC and HNSCC was performed in Eclipse (Varian Medical Systems ®, Palo Alto, CA). MPM were contoured in MIM (MIM Software Inc. ®, Cleveland, OH). NSCLC and MPM were contoured in the lung and mediastinal window. HNSCC were contoured in abdomen window. The observers contoured the HNSCC and NSCLC tumors according to the institutional protocols for routine radiotherapy practice; on account of the complexity of MPM a dedicated contouring protocol for the purpose of this study was created. According to this protocol pleural thickening was included as well as lung nodules, infiltrated pericard and mediastinal extensions. Obvious pleural effusion and atelectasis were excluded. For HNSCC and MPM, diagnostic PET/CTs were available and were used to assist in the contouring process.
Delineation variability
To study the inter-observer variability in tumor delineation, median Dice coefficient (DC) was calculated over all possible pairs of observers. The variability was studied per tumor entity. The DC ranges between 0 and 1 and indicates spatial overlap. A value of 0 indicates no overlap, whereas a value of 1 indicates identical contours [Citation15].
Radiomics analysis and image pre-processing
An in-house developed radiomics software implementation written in Python programing language (version 2.7.6) was used. It analyzes the 3D image by extracting the following features:
shape (n = 18)
intensity distribution (n = 17)
texture (n = 137): the Gray Level Co-occurrence Matrix (n = 52), the Neighborhood Gray Tone Difference Matrix (n = 5), the Gray Level Run Length Matrix (n = 32), the Gray Level Size Zone Matrix (n = 16), the Gray Level Distance Zone Matrix (n = 16) and the Neighboring Gray Level Dependence Matrix (n = 16)
wavelet transform (n = 1232)
In total, 1404 features were extracted per patient/image (see Supplementary Tables 1–4). The definitions of analyzed intensity and texture features are described by Zwanenburg et al. [Citation16], whereas the details on implementation of the shape features and the wavelet transform can be found in work by Bogowicz et al. [Citation17,Citation18]. For intensity, texture and wavelet analysis images were resized to cubic voxels of 3 mm for NSCLC, 2 mm for HNSCC and 3.3 mm for MPM using linear interpolation. These voxel sizes correspond to the lowest image resolution (sagittal) within the specific tumor entity. Additionally, Hounsfield units range of −20 to 180 HU was applied to limit the analysis to soft tissue only in HNSCC. In NSCLC and MPM Hounsfield units range of −300 to 200 HU was applied to limit the analysis to lung tissue. To quantify the texture, images were resampled to equally spaced bins of 5 HU.
There are two methods for texture features definition in the Gray Level Co-occurence Matrix (GLCM) and the Gray Level Run Length Matrix (GLRLM). These matrices require a specification of the direction for computation. To assure that the final texture features are rotational invariant the matrices are calculated in all 26 directions in 3D. Afterwards, matrices are either averaged before the texture features are computed (merged mGLCM and mGLRLM) or texture features are computed on each of 26 matrices and averaged at the end (averaged aGLCM and aGLRLM). Both methods were used for texture computation to investigate whether one of them is characterized by a superior inter-observer stability.
Stability analysis of radiomic features
The inter-observer variability of radiomic features was studied using the two-way mixed single measures intraclass correlation coefficient (ICC(3,1)). The ICC is a statistical indicator that gives information about the consistency of feature measurements [Citation19]. A value of 0 indicates no reliability whereas a value of 1 means that the measurements are highly stable. An ICC >0.8 is accepted to indicate a good reproducibility. This threshold was chosen based on a guideline where an ICC > 0.75 is indicative of a good reliability [Citation20]. We selected a slightly stricter threshold to better match with previous published work, which have often chosen either 0.8 or 0.9 and to control for type I and type II errors in light of relatively small sample sizes, as already stated above. For the stable radiomic features, an average linkage hierarchical clustering was performed to identify classes of uncorrelated features with a cutoff value of 0.5. The statistical analysis was performed in R (version 3.2.3).
Results
The DC differed according to tumor type. The median DC was high for NSCLC (median: 0.86, range: 0.57–0.90) and HNSCC (0.72, 0.21–0.89), whereas it was low for MPM (0.26, 0–0.9) ().
Figure 1. Dice coefficient and percentage of stable radiomic features. NSCLC: non-small cell lung cancer; HNSCC: head and neck squamous cell carcinoma; MPM: malignant pleural mesothelioma. Median Dice coefficient was high for NSCLC and HNSCC, whereas it was very low for MPM. The stability rate of radiomic features correlated with the median Dice coefficient.
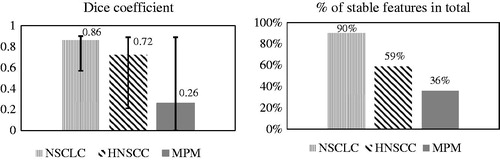
The inter-observer stability rate was analyzed according to tumor entity and the group of radiomic features (shape, intensity, texture and wavelet). Stability rate differed between cancer entities (). For NSCLC 90% and for HNSCC 59% of all extracted radiomic features were stable (ICC >0.8) in contrast to only 36% for MPM. DC highly correlated to the stability of radiomic features.
A similar correlation was observed for each feature subgroup (). For texture features there was an almost linear increase in stability rate with increasing DC.
Figure 2. Dice coefficient and percentage of stable radiomic features according to feature subgroups. NSCLC: non-small cell lung cancer; HNSCC: head and neck squamous cell cancer; MPM: malignant pleural mesothelioma. A feature is considered to be stable with an intra-class correlation coefficient >0.8.
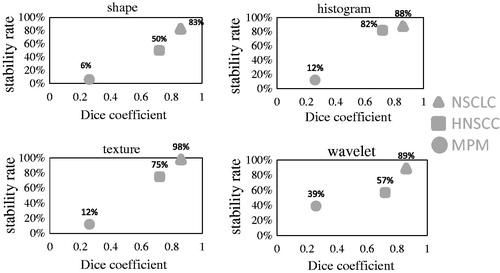
The feature group, which was characterized by the highest stability rate, differed between the tumor entities. In NSCLC, the highest rate of stable parameters was found for texture features (98%), followed by wavelet features (89%). In HNSCC the highest proportion of stable features was observed for intensity features (82%). For MPM images, wavelet features showed the highest percentage of stable features (39%). A subgroup of features, consisting of an intersection of features stable in MPM and HN (n = 342), was also stable in NSCLC. In the shape features, only volume was stable across all three tumor sites. We have additionally observed that image filtering increased the number of stable features. For example 15 intensity or texture features were stable in non-transformed images, whereas in LLL wavelet transform 66 features were stable. The full list of stable features per tumor site is presented in the Supplementary material (Supplementary Tables 1–4).
The stability rate of texture features in GLCM and GLRLM calculated with two different methods (merging and averaging) was investigated (). The stability rates were similar between the methods. However, for both matrices and all tumor sites, the method of averaging texture features at the end resulted in a slightly higher percentage of stable features.
Table 1. Percentage of stable parameters (ICC >0.8) according to calculation method.
Among the stable features, many are correlated and thus provide redundant information for the outcome modeling. One way to obtain groups of non-correlated parameters is to create feature groups by hierarchical clustering. Hierarchical clustering revealed 14 groups of correlated and stable features for NSCLC and 6 groups for both HNSCC and MPM. For comparison, without the preselection in the robustness analysis 21 groups were found for NSCLC and 19 groups for both HNSCC and MPM.
Discussion
This study assessed the influence of inter-observer variability in tumor delineation on stability of radiomic features in three tumor entities: non-small cell lung cancer (NSCLC), head and neck squamous cell carcinoma (HNSCC) and malignant pleural mesothelioma (MPM). As expected, the DC differed substantially between the three tumor sites, demonstrating the importance of reproducible delineation of the target area. The percentage of stable radiomic features in total as well as for each radiomic feature subgroup was highly correlated with DC, indicating that the results of a radiomics analysis are substantially influenced by the inter-observer delineation variability. The inter-observer variability reduced the number of imaging features available for radiomics analysis. In NSCLC, 90% of features were stable, compared to 59% in HNSCC and only 36% in the MPM. Additionally, we observed that the method of texture features averaging in GLCM and GLRLM is less prone to the inter-observer variability than the merging.
This is to our knowledge the first study evaluating the impact of delineation variability on stability of radiomics features extracted from CT images. A direct and detailed comparison to other stability studies is therefore limited. There are two evaluations on stability of radiomic features in NSCLC. In general, our results compare well to the results of Leijenaar et al. [Citation11]. They investigated the impact of inter-observer variability on the stability of multiple PET-derived features in NSCLC and reported a high stability with 91% of assessed features being stable. Our results are also in line with the findings of Van Velden et al., who compared results of radiomics analysis in NSCLC delineated manually on CT scans and semi-automatically on PET images additionally to the impact of two different reconstruction methods for the PET scans [Citation12]. Overall, 63 out of 105 radiomic features appeared to be stable independent of the delineation or reconstruction method in NSCLC PET/CT scans. For MPM and HNSCC, there are no other studies analyzing the influence of inter-observer delineation variability on stability of radiomic features.
Inter-observer variability of manual tumor delineation by radiation oncologists varied according to tumor type. High conformity was achieved for NSCLC (median DC 0.86), followed by HNSCC (median DC 0.72). With a median DC of 0.26 we found a substantial variability in contours for MPM. These tumors are well-known for their irregular pattern of spread and skip-lesion appearance, often in contact to the mediastinum, leading to difficulties in defining the tumor volume. On the other hand, the delineation of NSCLC and HNSCC is comparably sharp, owing to texture differences to normal lung tissue and non-enhancing soft tissue, respectively. Variability in definition of GTV in NSCLC and HNSCC has been studied previously. Several investigations demonstrated substantial differences in GTV contouring, making inter-observer variability in contouring one of the main uncertainties in radiotherapy planning [Citation10,Citation21–25].
For NSCLC, literature describes a larger variability in contouring than we have found in our study [Citation10,Citation21,Citation22]. Possible reasons therefore could be the inclusion of lymph node delineation, which was not performed in our study, and the absence of accompanying atelectasis in our study, which is a well-known difficulty in tumor delineation.
For HNSCC, there is also a larger inter-observer variability in contouring of GTV in the literature described than we found. Riegel. et al evaluated the GTV contours on CT scans from 16 different head and neck cancer patients by four physicians. The contour overlap ranged from 7% to 60% [Citation24]. One reason for the larger variability could be the inclusion of several different primary sites (nasopharynx, oropharynx, larynx, cervical esophagus, maxillary sinus, orbita, optic nerve, nasal vestibule). Our study comprised only the four most common HNSCC tumor sites (supraglottic larynx, oropharynx, hypopharynx and oral cavity tumors), which give rise to tumors with similar morphological features, owing partially to identical risk factors. For MPM, we did not find any comparative studies to address the question of inter-observer delineation variability.
Only in HNSCC planning CT images were acquired after application of intravenous contrast. Contrast medium enhances the tumor tissue potentially leading to altered results in radiomics analysis.
There is evidence that using contouring protocols or guidelines is able to reduce inter-observer variation in target volume delineation [Citation26,Citation27]. Moreover, the use of automatic image delineation may also lead to a reduction of contouring variability and therefore its introduction to contouring process should be considered [Citation28].
One limitation of this study is its single-center setting. Contouring of GTV was performed to the best of the respective observer’s knowledge according to institutional protocols. Within the same institution, there might be a higher overlap of contours possibly leading to overestimation of stable radiomic features in comparison to a multi-institutional trial. In consequence, our results need to be validated against multi-center observers. The introduction of a clear protocol could be advantageous in achieving a high overlap between the contours even in a multi-center setting.
In conclusion, this study showed that differences in tumor delineation lead to relevant influences on results of a radiomics analysis. The number of available features for a radiomics analysis was linearly decreasing with increasing differences in delineation. However, even for a tumor site such as MPM with large interobserver delineation differences, we could still find some stable features, which would be suitable for a radiomics analysis. The percentage to which the number of used features for a radiomics analysis has to be reduced in future could be shown for the three investigated tumor entities in our institution. It has to be investigated in other tumor sites. Based on our results we recommend that every institution should perform their own inter-observer analysis for the respective tumor type before correlating radiomics to a clinical endpoint. If every group publishes the stable features we could in future define a subset of reliable features that are stable irrespective of observers. The most accurate method to determine this subset of features would be a multicenter study.
Matea_Pavic_et_al._Supplementary_data.pdf
Download PDF (94.6 KB)Disclosure statement
No potential conflict of interest was reported by the author(s).
Additional information
Funding
Related Research Data
References
- Rich JN. Cancer stem cells: understanding tumor hierarchy and heterogeneity. Medicine. 2016;95(1 Suppl 1):S2–S7.
- Rachiglio AM, Esposito Abate R, Sacco A, et al. Limits and potential of targeted sequencing analysis of liquid biopsy in patients with lung and colon carcinoma. Oncotarget. 2016;7:66595–66605.
- Lambin P, Rios-Velazquez E, Leijenaar R, et al. Radiomics: extracting more information from medical images using advanced feature analysis. Eur J Cancer. 2012;48:441–446.
- Yip SS, Aerts HJ. Applications and limitations of radiomics. PhysMedBiol. 2016;61:R150–R166.
- Larue RTHM, Defraene G, Ruysscher DD, et al. Quantitative radiomics studies for tissue characterization: a review of technology and methodological procedures. Brit J Radiol. 2017;90:20160665.
- Hatt M, Tixier F, Pierce L, et al. Characterization of PET/CT images using texture analysis: the past, the present… any future? Eur J Nucl Med Mol Imaging. 2017;44:151–1657.
- Brouwer CL, Steenbakkers RJ, van den Heuvel E, et al. 3D Variation in delineation of head and neck organs at risk. Radiat Oncol. 2012;7:328.
- Rasch C, Eisbruch A, Remeijer P, et al. Irradiation of paranasal sinus tumors, a delineation and dose comparison study. Int J Radiat Oncol Biol. 2002;52:120–1279.
- Senan S, van Sörnsen de Koste J, Samson M, et al. Evaluation of a target contouring protocol for 3D conformal radiotherapy in non-small cell lung cancer. Radiother Oncol. 1999;53:247–25510.
- Van de Steene J, Linthout N, de Mey J, et al. Definition of gross tumor volume in lung cancer: inter-observer variability. Radiother Oncol. 2002;62:37–4911.
- Leijenaar RT, Carvalho S, Velazquez ER, et al. Stability of FDG-PET radiomics features: an integrated analysis of test-retest and inter-observer variability. Acta Oncol. 2013;52:1391–1397.
- van Velden FH, Kramer GM, Frings V, et al. Repeatability of radiomic features in non-small-cell lung cancer [(18)F]FDG-PET/CT studies: impact of reconstruction and delineation. Mol Imaging Biol. 2016;18:788–795.
- Hatt M, Tixier F, Cheze L, Rest C, et al. Robustness of intratumour F-FDG PET uptake heterogeneity quantification fot therapy response prediction in oesophageal carcinoma: robustness of FDG PET tumour heterogeneity quantification. Eur J Nucl Med Mol Imaging. 2013;40:1662–1671.
- Walter SD, Eliasziw M, Donner A. Sampe size and optimal designs for reliability studies. Stat Med. 1998;17:101–110.
- Dice LR. Measures of the amount of ecologic association between species. Ecology. 1945;26:297–302.
- Alex Zwanenburg SL, Vallières M, Löck S. Image biomarker standartisation initiative [PDF]. Version 1.5. 17th November 2017. Available from: https://arxiv.org/abs/1612.07003
- Bogowicz M, Leijenaar RTH, Tanadini-Lang S, et al. Post-radiochemotherapy PET radiomics in head and neck cancer – the influence of radiomics implementation on the reproducibility of local control tumor models. Radiother Oncol. 2017;125:385–391.
- Bogowicz M, Riesterer O, Stark LS, et al. Comparison of PET and CT radiomics for prediction of local tumor control in head and neck squamous cell carcinoma. Acta Oncol. 2017;56:1531–153619.
- Shrout PE, Fleiss JL. Intraclass correlations: uses in assessing rater reliability. Psychol Bull. 1979;86:420–820.
- Koo TK, Li MY. A guideline of selecting and reporting intraclass correlation coefficients for reliability research. J Chiropr Med. 2016;15:155–163.
- Giraud P, Elles S, Helfre S, et al. Conformal radiotherapy for lung cancer: different delineation of the gross tumor volume (GTV) by radiologists and radiation oncologists. Radiother Oncol. 2002;62:27–3622.
- Vorwerk H, Beckmann G, Bremer M, et al. The delineation of target volumes for radiotherapy of lung cancer patients. Radiother Oncol. 2009;91:455–460.
- Peulen H, Belderbos J, Guckenberger M, et al. Target delineation variability and corresponding margins of peripheral early stage NSCLC treated with stereotactic body radiotherapy. Radiother Oncol. 2015;114:361–624.
- Riegel AC, Berson AM, Destian S, et al. Variability of gross tumor volume delineation in head-and-neck cancer using CT and PET/CT fusion. Int J Radiat Oncol Biol. 2006;65:726–732.
- Hong TS, Tome WA, Chappell RJ, et al. Variations in target delineation for head and neck IMRT: an international multi-institutional study. Int J Radiat Oncol Biol. 2004;60:S157–S15826.
- Mitchell DM, Perry L, Smith S, et al. Assessing the effect of a contouring protocol on postprostatectomy radiotherapy clinical target volumes and interphysician variation. Int J Radiat Oncol Biol. 2009;75:990–327.
- Fuller CD, Nijkamp J, Duppen JC, et al. Prospective randomized double-blind pilot study of site-specific consensus atlas implementation for rectal cancer target volume delineation in the cooperative group setting. Int J Radiat Oncol Biol. 2011;79:481–928.
- Parmar C, Rios Velazquez E, Leijenaar R, et al. Robust radiomics feature quantification using semiautomatic volumetric segmentation. PLoS One. 2014;9:e102107.