
Abstract
Background: There are currently no methods to estimate cell density in the prostate. This study aimed to develop predictive models to estimate prostate cell density from multiparametric magnetic resonance imaging (mpMRI) data at a voxel level using machine learning techniques.
Material and methods: In vivo mpMRI data were collected from 30 patients before radical prostatectomy. Sequences included T2-weighted imaging, diffusion-weighted imaging and dynamic contrast-enhanced imaging. Ground truth cell density maps were computed from histology and co-registered with mpMRI. Feature extraction and selection were performed on mpMRI data. Final models were fitted using three regression algorithms including multivariate adaptive regression spline (MARS), polynomial regression (PR) and generalised additive model (GAM). Model parameters were optimised using leave-one-out cross-validation on the training data and model performance was evaluated on test data using root mean square error (RMSE) measurements.
Results: Predictive models to estimate voxel-wise prostate cell density were successfully trained and tested using the three algorithms. The best model (GAM) achieved a RMSE of 1.06 (± 0.06) × 103 cells/mm2 and a relative deviation of 13.3 ± 0.8%.
Conclusion: Prostate cell density can be quantitatively estimated non-invasively from mpMRI data using high-quality co-registered data at a voxel level. These cell density predictions could be used for tissue classification, treatment response evaluation and personalised radiotherapy.
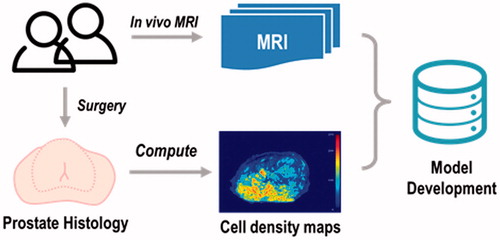
Graphical Abstract
Introduction
Accurate estimations of cell density in solid tumours can facilitate tissue classification [Citation1], optimal treatment option selection [Citation2] and treatment response prediction [Citation3]. Cell density estimation in several cancer types has been previously reported. Lyng et al. investigated the use of ADC maps from DWI in measuring the cell density in melanoma [Citation4] to predict chemotherapy efficacy. The result suggested that the methods could be applicable in some but not all lesions [Citation4]. Similarly, Gauvain et al. investigated the relationship of diffusion tensor imaging (DTI) and cell density in brain tumours for tissue classification and hence tumour grading [Citation5]. Pichardo et al. developed a method to measure bone marrow cell density using MRI (multi-echo spoiled gradient-recalled imaging, MSGRI) and MR spectroscopy [Citation6] for predicting bone marrow toxicity following whole body irradiation. Atuegwu et al. combined DWI data with a mathematical model to determine breast cancer cell density to predict treatment outcomes. The prediction achieved a Pearson correlation at 0.70 (p < .05) [Citation7]. Despite these studies, there are currently no methods for quantitative estimation of cell density in prostate cancer.
Studies over the last two decades have shown that multiparametric magnetic resonance imaging (mpMRI) is a versatile non-invasive tool in detecting and characterising PCa [Citation8]. Standard clinical reporting is based on the Prostate Imaging-Reporting and Data System Version 2 (PI-RADS v2) [Citation9], and requires mpMRI sequences including T2-weighted (T2w) imaging, diffusion-weighted imaging (DWI) and dynamic contrast-enhanced MRI (DCE-MRI). Each sequence provides different information about the tissue under examination. T2w images provide anatomical structure information [Citation10]. DWI assesses water diffusion and the relative magnitude of diffusion can be quantitatively measured by the apparent diffusion coefficient (ADC). DCE-MRI can be used to investigate the perfusion and permeability of blood vessels. Quantitative pharmacokinetic maps describing the vascular characteristics of tissue can be derived from DCE-MRI data [Citation11]. While the focus of most mpMRI studies has been on PCa detection, correlation between mpMRI data and cellularity has also been investigated. A negative correlation between ADC values and cell density has been reported in PCa [Citation12–14]. Similarly, negative correlations between ADC values and cell density were found in melanoma, paediatric brain and cerebellar tumours, and renal tumours [Citation4,Citation5,Citation15–17], while positive correlations have been found in gliomas and bone marrow [Citation18,Citation19]. This indicates that there exists an intrinsic but variable relationship between ADC values and cell density across a wide range of tissue types.
The aim of this study was to develop predictive models to estimate prostate cell density at a voxel level from mpMRI data. Performance of three regression methods was investigated. This is the first study to develop voxel-wise predictive models for prostate cell density.
Material and methods
Thirty patients scheduled for radical prostatectomy were recruited for analysis at the Peter MacCallum Cancer Centre (Melbourne, Australia) in this Human Research Ethics Committees (HREC) approved the study. Patient demographics are shown in Supplementary Material A.
Imaging and histological data acquisition
In vivo mpMRI were acquired for each patient on a 3T Siemens Trio Tim machine (Siemens Medical Solutions, Erlangen, Germany) prior to radical prostatectomy. Sequences included T2w, DWI and DCE-MRI, in accordance with PI-RADS and the European Society of Urogenital Radiology (ESUR) guidelines [Citation20]. A radiation oncologist (SW) delineated the prostate contours on in vivo 2D T2w images, which was used to define the voxels for subsequent model development. ADC was computed from DWI and four pharmacokinetic maps were computed from DCE-MRI including volume transfer constant (Ktrans), interstitium-to-plasma rate constant (kep), extracellular extravascular volume fraction (Ve) and initial area under the uptake curve (IAUC).
Ex vivo MRI of the excised prostate specimen was acquired using a customised sectioning box (with the specimen embedded in agarose gel) which had cutting slots at 5 mm increments. Axial T2w images were obtained in line with these slots using an initial coronal T1 image for image orientation. For both in vivo and ex vivo MRI acquisitions, 3D T2w images with isotropic voxels were also obtained and used to co-register the data using deformable registration (as described in ‘Image registration’ section). After image acquisition, the prostate specimen was sectioned and processed to give haematoxylin and eosin (H&E) histology slides, tumours were delineated and reported with a Gleason Score by an experienced uropathologist (CM). Slides were scanned at 20 times magnification using an Aperio XT scanner (Leica Biosystems, Buffalo Grove, IL, USA), providing high-resolution digital pathology images (approximately 0.01 × 0.01 mm). Cell density maps were computed from these images using a tile-based approach based on our previous work [Citation2]. Examples of mpMRI data and acquisition parameters can be found in Supplementary Materials B and C.
Image registration
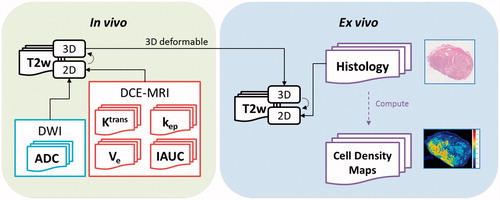
Registration of the histology and in vivo mpMRI data was achieved using the framework developed by Reynolds et al. [Citation21]. For in vivo imaging data, ADC maps and DCE-MRI pharmacokinetic maps were co-registered with in vivo mpMRI T2w images using rigid registration methods. For ex vivo data, the histology and cell density maps were rigidly co-registered with ex vivo 2D T2w images. Finally, 3D deformable registration methods were applied between in vivo and ex vivo 3D T2w images (). After image registration, all data were resampled into ex vivo 2D T2w image space (0.22 × 0.22 × 0.5 mm) and resized to an in-plane resolution of 1.0 × 1.0 mm (linear interpolation) to minimise random noise.
Figure 1. A diagram showing the registration process. Registrations are indicated by solid arrows. The arc arrows between 2D and 3D T2w images indicate ‘inherently co-registered’.
Model development
To maximise the discriminative power of the model, additional features were computed from the mpMRI data. The motivation was to capture as much information as possible from the front end, based on typical radiomics procedures. In this study, Haralick’s textural features (HTFs) [Citation22] were computed for T2w images and parametric maps (ADC, Ktrans, kep, Ve, IAUC). HTFs consist of 26 features based on the grey-level co-occurrence matrix (GLCM) which provides a quantitative measure of local heterogeneity. HTFs were defined to describe the spatial relationship of neighbouring voxels. For a given voxel, HTF maps were computed using a 5 mm × 5 mm moving window centred on the voxel.
It is a known issue that HTFs can correlate with each other (collinearity), resulting in model instability. The severity of this issue was first investigated by computing the Pearson correlation coefficient between all imaging features. Following that, feature selection was applied using the method proposed by Lin et al. [Citation23] using variance inflation factor (VIF). For a set of features, the VIF measures how well a feature can be fitted with the remaining features. Its minimum value is 1.0 which indicates no multicollinearity and a VIF greater than 5.0 indicates problematic multicollinearity exists. A VIF threshold of 4.0 was used in this study. At the end of this step, an uncorrelated subset of the imaging features was identified, which was used for model training.
For model training, voxels were treated as independent samples in this study. For an arbitrary sample , the corresponding data is expressed as a feature-response pair:
(1)
where is the feature vector, which includes mpMRI data and HTF subsets after feature selection, representing K features in total:
(2)
and is the response (i.e., cell density computed from high resolution histology scans). Due to the unknown relationship between cell density and mpMRI data, three regression methods with increasing complexities were investigated, which included the multivariate adaptive regression spline (MARS) [Citation24], polynomial regression (PR) [Citation25] and the general additive model (GAM) [Citation26]. Two parameters, degree of polynomial (DOP) from PR and degree of freedom (DOF) from GAM, were optimised during the training process. Root mean square error (RMSE) was used as the metric to measure the model performance:
(3)
where is the number of samples,
being the predicted response for sample
and
being the true response. RMSE had the same unit as
(cells/mm2).
One patient was excluded due to the lack of DCE-MRI data. The remaining 29 patients were partitioned into two groups, a training group (n = 20) and a test group (n = 9). The training group was used for parameter optimisation and model training, while the test group was held out to assess the performance of the models. Models were trained using the training data (n = 20) and model selection was based on their performance on the test data (n = 9) using RMSE. To estimate the relative deviations from ground truth cell density, a second RMSE was computed with cell density normalised to [0, 1] prior to model fitting. This provided a percentage rather than an absolute cell density value. The best model should have the smallest RMSE. Details of feature extraction, regression algorithms and the LOOCV can be found in Supplementary Material B.
Distance-to-agreement tests
Distance-to-agreement (DTA) measures were used to evaluate the influence from image registration uncertainties (up to 3.3 mm). First, a deformation field F was simulated with a maximum deformation at 3.3 mm. The deformation field F was then applied on the prediction map P to generate a deformed prediction map P’. DTA measures were taken between P and P’ using three different distance thresholds (r = 1, 2 and 3 mm) and the pass rate was recorded, respectively. This process was repeated 10 times to reduce the random effect from the deformation field generation.
Statistical analysis
Association between HTFs and cell density and collinearity within HTFs was assessed by Pearson correlation coefficients. During model training, leave-one-out cross-validation (LOOCV) was applied to the training data to optimise parameters. During model testing, bootstrapping was applied on the test data (100 subsets, 3000 samples each) to estimate the uncertainty in model performance. The Student’s paired t-test was used to compare mean performance of three regression methods on the test group. A significance level of 0.05 was used. R Stat software (v3.2.3) for Windows was used on an Intel Core (Santa Clara, California, USA) i7-4712HQ 2.30 GHz PC.
Results
Correlation analysis
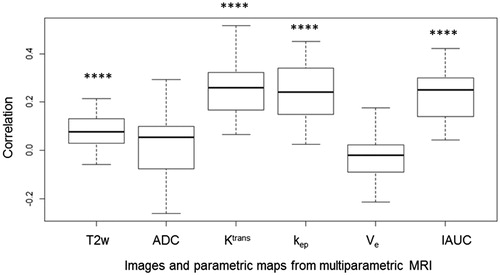
Correlation between cell density values and signal intensity from mpMRI data were analysed using 29 patients with results shown in . Significant correlations were found between cell density and Ktrans, kep and IAUC, with correlation coefficients of 0.25, 0.24 and 0.23 (p < .05) respectively. The correlation of T2w with cell density was lower (0.08) but remained significant (p < .05). Neither the correlation between cell density and ADC (p = .94) nor between cell density and Ve (p = .61) were significant.
Figure 2. Boxplots of voxel-wise correlation of multiparametric MRI data with cell density.
Collinearity and feature selection
Five of the original six mpMRI features (T2w, ADC, Ktrans, kep, Ve) were chosen by feature selection. IAUC was excluded due to its strong collinearity with Ktrans. The inclusion of Ktrans and IAUC at the same time resulted in high variance inflation factor (VIF) (5.52 for Ktrans and 4.66 for IAUC), while exclusion of IAUC resolved the issue (1.62 for Ktrans). For HTFs, 17 were selected (T2w-HTFs, n = 8; ADC-HTFs, n = 6; Ktrans-HTFs, n = 3; ). Thus, 22 features (5 from mpMRI and 17 from HTFs) were selected for training regression models.
Table 1. Selected Haralick’s texture features using the forward stepwise feature selection.
Model training and performance
Models including MARS, PR and GAM were trained using optimised parameters. GAM achieved the best performance (RMSE 1.06 ± 0.06 × 10³ cells/mm2; relative deviation 13.3 ± 0.8%) compared to PR and MARS (). Although the differences were small, they remained significant for MARS versus GAM (p < .05), MARS versus PR (p < .05) and PR versus GAM (p < .05). Visualisation of the predicted cell density from an example patient is shown in .
Figure 3. Visualisations of a ground truth cell density map and its predictions using three regression methods (MARS, PR and GAM). (MARS: multivariate adaptive regression spline; PR: polynomial regression; GAM: generalised additive model).
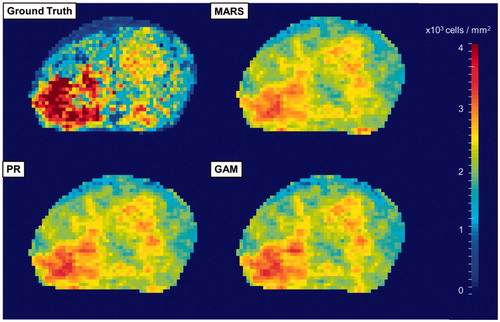
Table 2. Performance of three regression methods measured by root mean squared error and relative deviance.
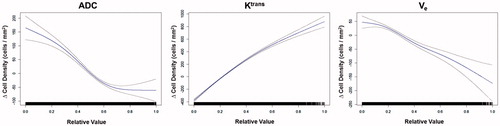
The contribution of each mpMRI parameters was analysed using GAM (). Each subplot in shows the effect on cell density by changing the value of a specific feature assuming the remaining features remain unchanged. Signal intensity in T2w images and Ktrans values had an overall positive relationship with cell density. In comparison, an increase of ADC and Ve values showed a negative impact on the change in cell density.
Figure 4. Contribution of ADC, Ktrans and Ve evaluated by the GAM model with standard error in dashed lines. GAM: generalised additive model.
DTA measurement
At a threshold of 1 mm, the DTA pass rate had an average of 0.737 and this number increased to 0.983 and 0.991 when the threshold was 2 and 3 mm, respectively (Supplementary Material D). There was a significant change in DTA pass rate at different thresholds, with p values all below .0001 for all three combinations (i.e., between 1 and 2 mm, 2 and 3 mm, 1 and 3 mm). However, no significant difference was found between regression methods, with a p value of .94 between MARS and PR, 0.80 between MARS and GAM and 0.86 between PR and GAM.
Discussion
In this study, we investigated the development of predictive models to estimate cell density at a voxel level. Predictive models using three regression methods (MARS, PR and GAM) were developed. GAM was found to be the best model, with an RMSE of 1.06 ± 0.06 × 10³ cells/mm2 (relative deviation 13.3 ± 0.8%). It should be noted that ‘cell density’ here refers to both normal prostate cells and cancerous cells. The purpose was not to identify cancer-specific cell density, however, Reynolds et al. found that cell density in general can be used as a measure for tumour distribution as cell density in tumours was found to be significantly higher than that in normal tissues (p < .05) [Citation2]. Therefore, cell density could be used to define tumour volumes using a probabilistic model, but that was not the purpose of this work.
The predicted cell density can provide clinically valuable information for tissue classification, treatment response evaluation and personalised treatment optimisation. In our group, we intend to use this model for radiotherapy treatment optimisation. This will be achieved using a form of focal therapy proposed by our group termed ‘bio-focused therapy’ (BiRT) [Citation27], where the actual dose delivered to the tumour region is dependent on its biological characteristics (i.e., cell density, tumour aggressiveness and the presence of hypoxia) which are relevant to radiotherapy response. The BiRT approach reduces the radiation doses to non-tumour regions to minimise toxicity, whilst boost focal therapy approaches maintain the dose to healthy tissues and escalate the dose to the tumour (e.g., the FLAME and HEIGHT trial [Citation28]). Similarly, recently published dose painting studies [Citation29,Citation30] rely on using ADC maps from DWI for calculating the non-uniform dose distribution, while the BiRT approach utilises the whole mpMRI sequences (T2w MRI, DWI and DCE-MRI).
In contrast to previous studies where negative correlations between cell density and ADC were found in the prostate [Citation12–14], our study found no significant correlation between cell density and ADC alone (p = .94) at a voxel level. This could be due to the fact that previous studies used a region of interest (ROI) based approach instead of a voxel-wise approach. Borren et al. showed that at the voxel level ADC maps had high heterogeneity which can cause a high variation in the correlation coefficients between cell density and ADC, and a subsequent lack of significant association [Citation31]. Similarly, Groenendaal et al. reported that thresholding the ADC map at the voxel level did not satisfactorily delineate the tumour location (AUC 0.58–0.61) [Citation32]. In ROI-based approaches, the impact of heterogeneity can be effectively reduced as ADC values are averaged in each ROI prior to analysis. Despite the absence of significant correlations at the voxel level, when ADC was used in the multiparametric setting, a negative association with cell density using GAM was demonstrated (). This re-emphasises the importance of using ADC in the multiparametric MRI context instead of using it alone [Citation31]. In addition to heterogeneity, the underlying biophysical link between ADC values and tissue microstructures was demonstrated recently. Langer et al. [Citation14] reported that ADC was positively correlated with the percentage area of luminal space (p < .001). This was validated by Chatterjee et al. [Citation33] who showed a stronger correlation between ADC and lumen volume (0.688, p < .001) than that between ADC and nuclear count (−0.598, p < .001) using a ROI-based approach. These findings agreed with the measured diffusivity of epithelium (0.54 ± 0.05 µm2/ms), which was lower than that of stroma (0.91 ± 0.17 µm2/ms) and lumen/ductal spaces (2.20 ± 0.04 µm2/ms) [Citation34]. Thus, there is not a clear direct causal relationship between cell density and ADC. This is in contrast to the traditional interpretation that permeability decreases in high cell density regions which causes lower ADC values.
Likewise, high heterogeneity in the tumour microstructure may influence the correlation between cell density and other imaging features, such as Ve. Tumour microstructures (epithelium, stroma and luminal spaces) could present varying extracellular extravascular volume (which is quantified by Ve) without significantly changing the cell density. Hence, this may explain why in our results no significant correlation between cell density and Ve alone was found at the voxel level (p = .61). Using a ROI-based analysis, similar to the ADC analyses, may have resolved this issue and may explain why Langer et al. found an inversely proportional relationship between Ve and the percentage area of nuclei (p = .05) when using a ROI-based approach [Citation14]. In our study, we aimed to achieve voxel-level prediction for use with biological optimisation of treatment planning, and hence ROI-based approaches were not investigated as part of our study.
All three regression models achieved comparable performance measured by RMSE and relative deviation. A scatterplot showing the ground truth and predicted cell density is shown in Supplementary Material C. Model performance could be influenced by two factors. The first is the limitation of the methodology for ground truth cell density computation. There was a systematic bias due to the features in histology images [Citation2]. For example, elongated or physically distorted nuclei could be falsely counted as two or more nuclei as the algorithm assumed radial symmetry. Thus, the computed cell density should be viewed as a relative measurement of real cell density, as should the predicted cell density. The second factor lies in the registration error between in vivo mpMRI data and histology. The uncertainty in the registration was limited by the resolution of the mpMRI data and was estimated to be up to 3.3 mm [Citation21], which could have impacted the performance of the regression models. To further quantify the impact of this uncertainty, we have performed an additional distance-to-agreement test on the prediction maps. The pass rate was 0.737 with threshold at 1 mm, which increased to 0.983 and 0.991 for 2 and 3 mm thresholds, respectively (Supplementary Material D).
The proposed methodology is designed to be integrated with clinical diagnostic imaging procedures as a proof-of-concept. Hence, this study is based on pre-existing protocols used in our centre. Quarterly quality assurance tests were carried out according to recommendations by the MRI manufacturer (Siemens Medical Solutions, Erlangen, Germany) and quality assurance tests, according to the ACR guidelines [Citation35] were shown to be within tolerance. We have considered other DWI techniques including the Stretched Exponential model, the Kurtosis model and the intra-voxel incoherent motion model, but did not incorporate them as their diagnostic value remains to be validated [Citation36].
There are limitations in this study. First, the models were trained using data from both the peripheral zone (PZ) and the transition zone (TZ). Future work will consider the relative merit of developing zone-specific models [Citation37] (which will require precise segmentation of imaging and ground truth data). Second, each voxel was treated as an independent sample while a spatial correlation can be present in the data. Hence spatial methods such as spatial autoregressive models could be used to account for the neighbourhood information and will be incorporated for future investigation to improve model performance. Finally, the mpMRI scans were acquired using the current clinical protocol at our centre. Additional advanced methods for noise reduction and artefact cancellation will be subject to investigation in future work.
In conclusion, predictive models for quantitative prostate cell density from mpMRI at a voxel level were developed in this study. Our results show that using high-quality co-registered data and advanced regression algorithms, prostate cell density can be quantitatively estimated non-invasively using imaging data on a voxel-wise basis. The best model (GAM) yielded a RMSE of 1.06 ± 0.06 × 10³cells/mm2 with a relative deviation from ground truth cell density of 13.3 ± 0.8%. This is the first study which attempts to predict prostate cell density at a voxel level from mpMRI data.
Yu_Sun_et_al._Supplementary_materials.docx
Download MS Word (1.3 MB)Acknowledgments
The authors would like to thank Courtney Savill and Lauren Caspersz for their contribution in specimen preparation and MRI acquisition.
Disclosure statement
No potential conflict of interest was reported by the authors.
Additional information
Funding
Related Research Data
References
- Duchesne G. Localised prostate cancer – current treatment options. Aust Fam Physician. 2011;40:768–771.
- Reynolds HM, Williams S, Zhang AM, et al. Cell density in prostate histopathology images as a measure of tumor distribution. Proc SPIE. 2014;9041:90410S.
- Lee KC, Sud S, Meyer CR, et al. An imaging biomarker of early treatment response in prostate cancer that has metastasized to the bone. Cancer Res. 2007;67:3524–3528.
- Lyng H, Haraldseth O, Rofstad EK. Measurement of cell density and necrotic fraction in human melanoma xenografts by diffusion weighted magnetic resonance imaging. Magn Reson Med. 2000;43:828–836.
- Gauvain KM, Mckinstry RC, Mukherjee P, et al. Evaluating pediatric brain tumor cellularity with diffusion-tensor imaging. 2001;177:449–454.
- Pichardo JC, Milner RJ, Bolch WE. MRI measurement of bone marrow cellularity for radiation dosimetry. J Nucl Med. 2011;52:1482–1490.
- Atuegwu NC, Arlinghaus LR, Li X, et al. Integration of diffusion-weighted MRI data and a simple mathematical model to predict breast tumor cellularity during neoadjuvant chemotherapy. Magn Reson Med. 2011;66:1689–1696.
- Lemaître G, Martí R, Freixenet J, et al. Computer-aided detection and diagnosis for prostate cancer based on mono and multi-parametric MRI: a review. Comput Biol Med. 2015;60:8–31.
- ACR American College of Radiology. PI-RADS v2 Prostate Imaging and Reporting and Data System: Version 2. Reston (VA): ACR American College of Radiology; 2015.
- Barentsz JO, Richenberg J, Clements R, et al. ESUR prostate MR guidelines 2012. Eur Radiol. 2012;22:746–757.
- Tofts PS, Brix G, Buckley DL, et al. Estimating kinetic parameters from dynamic contrast-enhanced T1- weighted MRI of a diffusable tracer: standardized quantities and symbols. J Magn Reson Imaging. 1999;10:223–232.
- Zelhof B, Pickles M, Liney G, et al. Correlation of diffusion-weighted magnetic resonance data with cellularity in prostate cancer. BJU Int. 2009;103:883–888.
- Wang XZ, Wang B, Gao ZQ, et al. Diffusion-weighted imaging of prostate cancer: correlation between apparent diffusion coefficient values and tumor proliferation. J Magn Reson Imaging. 2009;29:1360–1366.
- Langer DL, Evans AJ, Plotkin A, et al. Prostate tissue composition and MR measurements: investigating the relationships between ADC, T2, Ktrans, Ve and corresponding histologic features. Radiology. 2010;255:485–494.
- Squillaci E, Manenti G, Cova M, et al. Correlation of Diffusion-weighted MR Imaging with Cellularity of Renal Tumours. Anticancer Res. 2004;4180:4175–4179.
- Manenti G, Di Roma M, Mancino S, et al. Malignant renal neoplasms: correlation between ADC values and cellularity in diffusion weighted magnetic resonance imaging at 3 T. Radiol Med. 2008;113:199–213.
- Koral K, Mathis D, Gargan L, et al. Common pediatric cerebellar tumors: correlation between cell coefficient metrics. Radiology. 2013;268:532–537.
- Sugahara T, Korogi Y, Kochi M, et al. Usefulness of diffusion-weighted MRI with echo-planar technique in the evaluation of cellularity in gliomas. J Magn Reson Imaging. 1999;9:53–60.
- Nonomura Y, Yasumoto M, Yoshimura R, et al. Relationship between bone marrow cellularity and apparent diffusion coefficient. J Magn Reson Imaging. 2001;13:757–760.
- Barentsz JO, Richenberg J, Clements R, et al. ESUR prostate MR guidelines 2012. Eur Radiol. 2012;22:746–757.
- Reynolds HM, Williams S, Zhang A, et al. Development of a registration framework to validate MRI with histology for prostate focal therapy. Med Phys. 2015;42:7078–7089.
- Haralick RM, Shanmugam K, Dinstein I. Textural features for image classification. IEEE Trans Syst Man Cybern. 1973;3:610–621.
- Lin D, Foster DP. VIF regression: a fast regression algorithm for large data. J Am Stat Assoc. 2011;106:232–247.
- Friedman JH. Multivariate adaptive regression splines. Ann Statist. 1991;19:91–92.
- Stigler SM. Gergonne’s 1815 paper on the design and analysis of polynomial regression experiments. Hist Math. 1974;1:431–439.
- Hastie T, Tibshirani R. Generalized additive models for medical research. Stat Methods Med Res. 1995;4:187–196.
- Haworth A, Williams S, Reynolds H, et al. Validation of a radiobiological model for low-dose-rate prostate boost focal therapy treatment planning. Brachytherapy. 2013;12:628–636.
- Bauman G, Haider M, Van der Heide UA, et al. Boosting imaging defined dominant prostatic tumors: a systematic review. Radiother Oncol. 2013;107:274–281.
- Casares-Magaz O, van der Heide UA, Rørvik J, et al. A tumour control probability model for radiotherapy of prostate cancer using magnetic resonance imaging-based apparent diffusion coefficient maps. Radiother Oncol. 2016;119:111–116.
- Grönlund E, Johansson S, Nyholm T, et al. Dose painting of prostate cancer based on Gleason score correlations with apparent diffusion coefficients. Acta Oncol. (Madrid). 2017;57:574–581.
- Borren A, Moman MR, Groenendaal G, et al. Why prostate tumour delineation based on apparent diffusion coefficient is challenging: an exploration of the tissue microanatomy. Acta Oncol. 2013;52:1629–1636.
- Groenendaal G, Berg CAT, Van Den Korporaal JG, et al. Simultaneous MRI diffusion and perfusion imaging for tumor delineation in prostate cancer patients. Radiother Oncol. 2010;95:185–190.
- Chatterjee A, Watson G, Myint E, et al. Changes in epithelium, stroma, and lumen space correlate more strongly with gleason pattern and are stronger predictors of prostate ADC changes than cellularity metrics. Radiology. 2015;277:751–762.
- Bourne RM, Kurniawan N, Cowin G, et al. Microscopic diffusivity compartmentation in formalin-fixed prostate tissue. Magn Reson Med. 2012;68:614–620.
- The American College of Radiology. Phantom test guidance for the ACR MRI accreditation programme. Reston (VA): The American College of Radiology USA; 2005.
- Liu X, Zhou L, Peng W, et al. Comparison of stretched-exponential and monoexponential model diffusion-Weighted imaging in prostate cancer and normal tissues. J Magn Reson Imaging. 2015;42:1078–1085.
- Lee JJ, Thomas I-C, Nolley R, et al. Biologic differences between peripheral and transition zone prostate cancer. Prostate. 2015;75:183–190.